HAL Id: hal-02457992
https://hal.archives-ouvertes.fr/hal-02457992
Submitted on 11 Mar 2020
HAL is a multi-disciplinary open access
archive for the deposit and dissemination of
sci-entific research documents, whether they are
pub-lished or not. The documents may come from
teaching and research institutions in France or
abroad, or from public or private research centers.
L’archive ouverte pluridisciplinaire HAL, est
destinée au dépôt et à la diffusion de documents
scientifiques de niveau recherche, publiés ou non,
émanant des établissements d’enseignement et de
recherche français ou étrangers, des laboratoires
publics ou privés.
THE EFFECTS OF KINETIC INSTABILITIES ON
SMALL-SCALE TURBULENCE IN EARTH’S
MAGNETOSHEATH
H. Breuillard, E. Yordanova, A. Vaivads, O. Alexandrova
To cite this version:
H. Breuillard, E. Yordanova, A. Vaivads, O. Alexandrova. THE EFFECTS OF KINETIC
INSTABIL-ITIES ON SMALL-SCALE TURBULENCE IN EARTH’S MAGNETOSHEATH. The Astrophysical
Journal, American Astronomical Society, 2016, 829 (1), pp.54. �10.3847/0004-637X/829/1/54�.
�hal-02457992�
THE EFFECTS OF KINETIC INSTABILITIES ON SMALL-SCALE TURBULENCE
IN EARTH’S MAGNETOSHEATH
H. Breuillard1, E. Yordanova1, A. Vaivads1, and O. Alexandrova2 1
Swedish Institute of Space Physics, IRF Uppsala, Sweden;hbreuill@gmail.com
2
LESIA/Observatoire de Paris-Meudon, Meudon, France
Received 2016 January 13; revised 2016 June 27; accepted 2016 June 28; published 2016 September 21
ABSTRACT
The Earthʼs magnetosheath is the region delimited by the bow shock and the magnetopause. It is characterized by highly turbulentfluctuations covering all scales from MHD down to kinetic scales. Turbulence is thought to play a fundamental role in key processes such as energy transport and dissipation in plasma. In addition to turbulence, different plasma instabilities are generated in the magnetosheath because of the large anisotropies in plasma temperature introduced by its boundaries. In this study we use high-quality magnetic field measurements from Cluster spacecraft to investigate the effects of such instabilities on the small-scale turbulence (from ion down to electron scales). We show that the steepening of the power spectrum of magnetic field fluctuations in the magnetosheath occurs at the largest characteristic ion scale. However, the spectrum can be modified by the presence of waves/structures at ion scales, shifting the onset of the small-scale turbulent cascade toward the smallest ion scale. This cascade is therefore highly dependent on the presence of kinetic instabilities, waves, and local plasma parameters. Here we show that in the absence of strong waves the small-scale turbulence is quasi-isotropic and has a spectral indexα≈−2.8. When transverse or compressive waves are present, we observe an anisotropy in the magneticfield components and a decrease in the absolute value of α. Slab/2D turbulence also develops in the presence of transverse/compressive waves, resulting in gyrotropy/non-gyrotropy of small-scale fluctuations. The presence of both types of waves reduces the anisotropy in the amplitude of fluctuations in the small-scale range.
Key words: Earth – instabilities – turbulence – waves 1. INTRODUCTION
Space plasmas are commonly in a turbulent state that is characterized by large and irregularfluctuations of the physical parameters (e.g., density, velocity, and electromagnetic field) from the largest(MHD) down to the smallest (electron) scales. Turbulence is a natural way to convert the energy of large-scale motions into small-scale fluctuations. The energy cascades by nonlinear interactions among eddies from MHD to kinetic (proton and electron) scales, where it is eventually dissipated into plasma heating(see the review by Bruno & Carbone2013).
It is believed that at kinetic scales turbulence plays a fundamental role in energy dissipation and plasma heating (Schekochihin et al. 2009). Therefore, it is crucial to
characterize the properties of kinetic turbulence (e.g., scaling law, anisotropy), the governing processes (e.g., wave–particle interactions), and the resulting coherent structures (see Alexandrova et al.2013).
Examples of turbulent space plasmas are stellar winds, the solar wind, and planetary magnetosheaths. Earthʼs magne-tosheath—the interface region between the solar wind and the terrestrial magnetosphere—is a region of particular interest in which to study turbulence (Zimbardo et al. 2010). The
magnetosheath forms as the plasma of the solar wind is decelerated and heated at the bow shock andflows around the Earthʼs magnetosphere. The proximity of the terrestrial magnetosheath makes it the best laboratory in which to investigate in situ the features of turbulence in collisionless plasma and to understand the solar–terrestrial interactions, i.e., the transport of mass and energy from the solar wind to the magnetosphere. The pile-up of the magnetosheath plasma in front of the Earthʼs magnetosphere introduces an important ion temperature anisotropy T⊥i>TPi(parallel and perpendicular to
the magnetic field), causing various kinetic instabilities (Schwartz et al. 1996) that affect the plasma turbulence (see,
e.g., Bale et al.2009).
The presence of variousfluid and kinetic instabilities implies that linearly unstable waves can grow and propagate in this region(see, e.g., Zimbardo et al.2010). A rich variety of
low-frequency(below the ion gyrofrequency fci) waves is observed in Earthʼs magnetosheath (see the review by Schwartz et al. 1996). According to observations and kinetic linear
theory, two wave modes seem to dominate the magnetosheath due to the ion anisotropy T⊥i>TPi, which pervades through-out. The Alfvén/ion-cyclotron (AIC) mode grows readily under conditions where the ion plasma beta βi is typically below 1. AIC is a left-hand circularly polarized wave for parallel propagation in the plasma rest frame( k B0, where k is
the wave vector and B0is the background magneticfield). AIC
is cyclotron-resonant with the ions and its growth rate is positive in the frequency range f~0.1-0.7fci with a maximum at ~0.5fci (Schwartz et al. 1996). At higher βi
(typically above 3), mirror modes (zero-frequency waves in the plasma rest frame) usually dominate the power spectra at low frequencies. A mirror mode is a compressive (δBP?δB⊥) slow mode with k B^ 0 and it is linearly polarized with
antiphase variations in the density and the magnitude of the magnetic field (Shevyrev et al. 2006). Under conditions of
intermediate βi (1βi3), both AIC and mirror-wave modes are usually observed (see, e.g., Alexandrova et al.2013).
It has long been known that at frequencies corresponding to the ion scales Doppler-shifted by the plasmaflow velocity, the power spectrum of turbulentfluctuations steepens. In the solar wind the steepening is typically seen at frequencies fsc∼0.1
The Astrophysical Journal, 829:54 (7pp), 2016 September 20 doi:10.3847/0004-637X/829/1/54
−1 Hz (Russell 1972; Alexandrova et al. 2013; Bruno & Carbone 2013). It is attributed to a change in the nature of
turbulence at these scales. It has been shown that in the solar wind(see Hellinger et al.2006; Matteini et al.2007,2013; Bale et al.2009), plasma instabilities can have an important impact
on the power spectral density (PSD) of the magnetic field, because the fluctuations and compressibility are enhanced along the thresholds of the temperature anisotropy. Therefore, it is important to understand the role of these local instabilities in order to be able to interpret correctly the physical processes of dissipation at the kinetic scales.
In a case study (Sahraoui et al. 2006) where the
Cluster spacecraft was located in the magnetosheath close to the magnetopause, the effects of the latter and mirror modes on the k-vector small-scale turbulence were investigated. The authors stated that the magnetopause was acting as an external constraint, preventing the cascade from developing in the direction normal to it, and that this, as well as the presence of mirror-mode structures, could affect the spectral index and the anisotropy of k fluctuations in the small-scale range. The results of Sahraoui et al. (2006) also emphasized the
importance of the Doppler shift in the measured temporal spectra.
The spectral index and anisotropy of the amplitude of magnetic fluctuations in the magnetosheath have been investigated in Alexandrova et al. (2008b): In the small-scale
frequency range, dB^2anddB2are generally observed to follow
a similar power law fα with −3α−2, and usually
dB^2>dB2, except for the largestβi(>5) wheredB^2~dB2. In
particular, when large mirror modes seem to be observed(i.e., a strong parallel component below fr
i), the spectral index of the
parallel component in the small-scale range is decreased, modifying the global index(see Figure7 in Alexandrova et al.
2008b). At small scales, the turbulence is also observed to be
non-gyrotropic: the energy along the direction perpendicular to v and B is larger than the energy along the projection of v in the plane perpendicular to B. This non-gyrotropy has been attributed to the presence of 2D turbulence (i.e., k^k),
whereas in the case of slab turbulence (i.e., kk^) the
fluctuations are gyrotropic (see Bieber et al. 1996; Matthaeus et al. 2007). Alexandrova et al. (2008b) argued that this
non-gyrotropy might be reinforced by different Doppler shifts for fluctuations with k parallel and perpendicular to v in the plane perpendicular to B.
In addition to the spectral indexα, indicating how the energy is transferred between scales, it is important to identify the scale associated with the spectral break (e.g., Alexandrova et al. 2013). Several ion kinetic scales have been associated
with the break, most notably the ion gyroradius ρi and ion inertial length λi (for details, see Chen et al. 2014, and references therein). These scales are related to different physical processes, respectively kinetic Alfvén turbulence (Schekochihin et al.2009) for ρiand Hall–MHD (Galtier2006)
or the thickness of current sheets(Leamon et al.2000; Dmitruk et al.2004) for λi. In a solar wind withβ≈1 different effects can be at work at ion scales, and it is difficult to associate one scale with a break(see, e.g., Lion et al.2016). To address this
question, in a recent study Chen et al. (2014) investigated
exceptional intervals in the solar wind withβi=1 and βi?1 and concluded that the ion spectral break occurs at the larger of the two scales.
Czaykowska et al.(2001) showed that, similarly to the solar
wind, in the magnetosheath there is a break in the spectrum, with the spectral index going from aboutα∼−1 below the proton gyrofrequency to α∼−2.6 above it. In this study, the authors also observed a “knee” (i.e., a local and broad maximum) at the spectral break, which was interpreted as the signature of AIC waves. Nonlinear structures such as Alfvén vortices have also been associated with the knee (Alexandrova et al. 2006, 2008b). In Alexandrova et al.
(2006), Alfvén vortices were observed to be controlled by λi, i.e., by the largest scale (for this particular case βi<1), in agreement with Chen et al.(2014). However, to the authorsʼ
knowledge, the scale at which the ion spectral break occurs for conditions of higherβiin the magnetosheath has not been reported yet.
In this work we analyze Cluster spacecraft measurements in Earthʼs magnetosheath to investigate at what scale the power spectrum of magnetic field fluctuations breaks and what the effect is of kinetic instabilities on small-scale plasma turbulence. First, we select events with different plasma parameters (βi and the bulk velocity vector v) to clearly separate spatial and temporal scales, and determine at which one the break eventually occurs(Section2). Then, we focus on
time intervals with different dominant kinetic waves (i.e., mirror modes and AIC waves) and investigate their respective effects on the spectral index and anisotropy offluctuations in the small-scale range of the spectrum(Section3). Finally, we
conclude the paper with a discussion and summary of the results(Section4).
2. ION-SCALE SPECTRAL BREAK
In this section wefirst present the data processing we used to obtain the PSDs shown in the different figures. We use waveform data measured by the FGM(Balogh et al.2001) and
STAFF(Cornilleau-Wehrlin et al.1997) instruments on board
Cluster spacecraft, which are merged, allowing us to study fluctuations with frequencies up to 12.5 Hz, which covers the ion scales. To combine the data from the two instruments, we apply afinite impulse filter, where FGM has been low-passed and STAFF has been high-passed with the same cutoff frequency of ∼1 Hz. We use a low-pass filter at 0.01 Hz to define the background magnetic field B0 and dB=B-B0.
This value has been chosen because in our cases it is the closest to the ion scales but does not affect the spectra(notably mirror modes that have a typical frequency of 0.025–0.05 Hz in the three cases shown). The ratio δB/B0 is on average ∼0.125 using this low-pass filter value for all cases analyzed in this paper, thus the mean-field approximation is appropriate here. Then we define a reference frame based on B0 and v, as
follows: the z component is chosen parallel to B0, x is
perpendicular to B0 in the plane containing B0 and v, and y
completes the direct orthonormal frame (see, e.g., Bieber et al.1996; Alexandrova et al. 2006). This reference frame is
reconstructed every 4 s, which is the velocity sampling rate provided by CIS(Rème et al.2001). Wavelet analysis (Morlet
mother wavelet, see Torrence & Compo 1998) is then
employed to compute the PSD of each δB component and the totalδB. To help better identify waves and structures, we also make use of the WHAMP program (Rönnmark1982) to
calculate the growth rate and we compute the polarization ofδB waveforms as well(not shown).
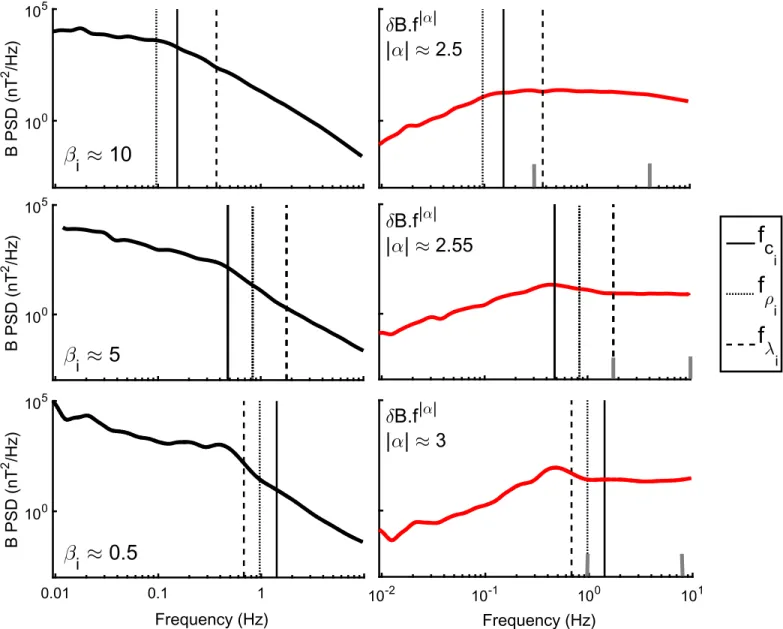
Figure1shows the PSDs of the magneticfield for the three selected time intervals of 15–20 minutes each. The data have been recorded on Cluster 3 (C3) under different plasma conditions in the magnetosheath. Each case shows a different ion scale(fci,fri,fli) as the largest: (1) high beta βi∼10 (with
fρias the largest scale) from 2001 March 16, 13:00–13:20 UTC (top panel); (2) another case of high beta βi∼5 (but with fcias
the largest scale) from 2001 December 16, 06:10–06:30 UTC (intermediate panel); and (3) low beta βi∼0.5 (with flias the
largest scale) from 2001 March 31, 16:57–17:12 UTC (bottom panel). In all cases v≈200 km s−1; however, high/low βi allows us to clearly separate fr
i from fli(shown in Figure1by
dotted and dashed vertical lines in each panel, respectively). The transformation from spatial to time domain is done assuming Taylorʼs hypothesis.
In all cases of Figure 1 a spectral break is observed at the largest of the three scales, i.e., the scale corresponding to the lowest ion frequency fmini. This result is consistent with the
observations in the solar wind(Chen et al.2014). However, in
the range fmin f fmax
i i, where fmaxi is the frequency
corresponding to the smallest ion scale, the power spectra are modified by ion instabilities: while a power law seems to develop after the break in the case of very high beta(Figure1, top panel), the onset of the cascade is shifted toward higher frequencies (Figure 1, middle and bottom panels) by the formation of a broader “knee” and develops at >f fmax
i. For
example, in the bottom panel, we observe a local bump at the break, which has been identified in this particular event (see Alexandrova et al. 2006) as the signature of Alfvén vortices,
controlled by fl
i. Each case presents a different slopeα in this
range, as shown by the compensated spectra dB2´f-a
depicted by red lines in each panel (the spectral index α is indicated in each panel on the right).
Kinetic instabilities can modify the power spectrum at ion scales and affect the fluctuations in the small-scale range. Therefore, the identification of kinetic instabilities is important and it is the subject of investigation in the following section.
Figure 1. PSDs of δB measurements on board C3 on 2001 March 16 at 13:00–13:20 UT (top panel), 2001 December 16 at 06:10–06:30 (middle panel), and 2001 March 31 at 16:57–17:12 (bottom panel). Black thick solid lines indicate the total δB PSD and red thick solid lines indicate the compensated PSD d ´B f a. The plasmaβiof each case is indicated on each panel, along with the absolute value of the spectral index ∣ ∣a , computed between the two gray vertical lines. The ion
3. SMALL-SCALE TURBULENCE ANISOTROPY AND SPECTRAL INDEX
In this section we study in detail the effects of mirror modes and AIC waves, which are observed to dominate in the magnetosheath (Schwartz et al. 1996), on the spectral index
and anisotropy of fluctuations in the small-scale range, i.e., fä[0.2–10] Hz in our case. To do so, we choose four time intervals of about 3–5 minutes each (i.e., PSDs at frequencies <0.025 Hz are not reliable) and we sort them out depending on the nature of the present waves. The selected cases are chosen as follows: (1) no waves are dominating the spectrum (2008 March 17, 12:30–12:35 UTC); (2) only strong mirror modes are observed (2008 March 25, 07:01–07:05 UTC); (3) strong AIC waves dominate(2008 March 30, 01:35–01:39 UTC); and (4) a mixture of the mirror and AIC waves is observed (2008 March 25, 06:51–06:56 UTC). These intervals are selected during periods of low v (v≈50 km s−1) so that the effects of the Doppler shift due to the plasma flow past the spacecraft (i.e., increase of δBy) are minimized (Sahraoui et al. 2006; Alexandrova et al. 2008b). Because of the low bulk
velocityTaylorʼs hypothesis could be violated (see, e.g., Klein et al. 2014), thus we performed three tests to ensure that this
hypothesis holds in the selected cases. First, we determined the turbulence intensity I=(vrms v0)2 (v0 being the mean bulk velocity and vrmsthe root mean square of v fluctuations) to be in the range [0.04–0.09] (i.e., I=1); then, we found that the relation fr fr =r ri e
e i is fulfilled (for a detailed description of
the test, see Sahraoui et al. 2012); and finally, we found good
agreement between the probability density functions of spatial and temporal fluctuations of spacecraft C3 and C4 (for a detailed description of the test, see Vörös et al. 2006).
Therefore, despite the low bulk velocity Taylorʼs hypothesis holds in all the selected cases in this study.
We then process data using the method described in the previous section to study the spectral index and anisotropy of the obtained magneticfield PSDs (shown in the upper panels of Figures2–5). To verify whether waves are present or not in the
time intervals considered, and to clearly identify their nature (mirror, AIC, mixture of the two), we use the WHAMP program(Rönnmark1982). We also compute the thresholds for
mirror andproton cyclotron instability in the (T⊥/TP, βiP) parameter plane derived from the linear theory (see Hellinger et al. 2006; Bale et al.2009). The thresholds are displayed in
the lower panels of Figures 2–5. Since we aim to identify strong waves dominating the spectrum here, we choose the parameters corresponding to a strong growth rate γ=10−2 (Samsonov et al.2001) to clearly differentiate between waves
of different natures. Note that the observed results also hold (not shown) using a weaker growth rate γ=10−3(Hellinger et al.2006).
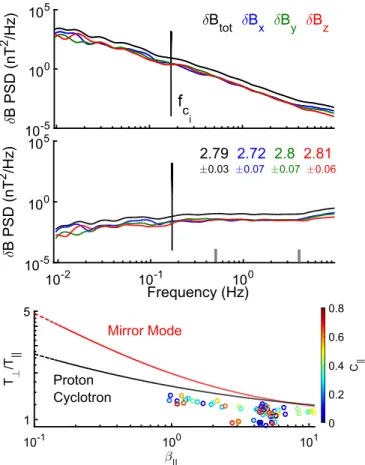
Figure 2 (upper panel) presents a case where no wave
dominates the magnetic PSD. The spectrum is quasi-isotropic at all frequencies with a spectral index α≈−2.8 at 0.5 Hzf4 Hz. There is also a slight deviation from spectral isotropy at high frequencies, in the range[5, 10] Hz, due to the presence of whistler waves. However, the study of the entire power spectrum of whistler waves in this case is not possible due to instrumental limitations, because the waveform data are limited to 12.5 Hz sampling. The absence of dominant wave activity is also demonstrated in the lower panel of Figure2. The circles in color represents the magnetic field compressibility
( )
=d d +d ^
C B2 B2 B2 (Bale et al.2009) plotted as a function
of T⊥/TP and βiP. We see that every circle lies below the theoretically obtained thresholds for ion instability (red and black dotted curves), i.e., the fluctuations are stable against these ion instabilities.
Figure3 shows the case where we observe the signature of mirror modes (δBz dominates at f<0.05 Hz) and no AIC waves(at »f fc
i). This is corroborated by the lower panel, in
which almost every point lies on or is above the threshold for mirror instability. In this case the parallel component (δBz) prevails in the high-frequency range and the fluctuations are non-gyrotropic, i.e., δBy>δBx (Alexandrova et al. 2008b).
While the indicesδBxandδByare close to−2.8 (except for the part >6 Hz, due to whistlers), the parallel component δBz is much less steep withα=−2.
Figure 4 shows the case where AIC waves are observed. This can be seen because the perpendicular components Bxand By dominate the PSD at 0.04f0.2, i.e., ~0.1-0.5fci.
Withβi mostly<1 and the temperature anisotropy quite high (∼2), most of the data points are concentrated around/above the threshold of the proton cyclotron instability(lower panels). The resulting spectra (upper panel) of Bx and By both have
Figure 2. PSDs of δB measurements (upper panel) on board C3 on 2008 March 17 at 12:30–12:35. The solid lines indicate the observed magnetic field spectra (top panel) and the dashed lines indicate the compensated (d ´B f a) spectra
(middle panel). The different components of dB are color-coded (top panel) along with the absolute value of their corresponding spectral index ∣ ∣a (middle panel) and its uncertainty (calculated from the power-law fit with 95% confidence bounds), computed in the frequency range delimited by gray vertical lines. The gyrofrequency is indicated by the vertical black line. The thresholds for mirror(red) and proton cyclotron (black) instability are shown (as T⊥/TPvs.βiP) in the bottom panel, for a relatively strong growth rate (for
details see Samsonov et al.2001): γ=10−2. Every 4 s of data a circle is obtained, the color of which indicates the magnetic compressibility(see the color bar).
higher power than Bz in the high-frequency range and the fluctuations are gyrotropic, unlike in the previous case of mirror modes. The perpendicular components show a steepen-ing at 0.25 Hz (~ f0.5ci), whereas the parallel component
displays a break at ∼0.1 Hz. The fluctuations become slightly more isotropic close to the observed break, which can be due to a superposition of AIC waves and possible coherent structures with k⊥at these frequencies, as has been observed in the solar wind by S. Lion et al. (2016, private communication). As a result, the total spectral index shows a steepening due to AIC waves at ∼0.25 Hz. The spectral index for the parallel component is steeper(α=−2.65) than for the perpendicular components(α≈−2.4).
Finally, Figure5 presents a case where both mirror modes and AIC waves are observed; this is corroborated by the lower panel, where the plasma is unstable to both wave modes. Strong mirror modes dominate the spectrum at frequencies f<0.04 Hz, whereas AIC waves prevail in the range 0.04 Hzf0.3 Hz, where the spectral break is observed at f≈0.1 Hz (~0.4fci). In the high-frequency range, the
fluctuations are observed to be almost isotropic even though δByis slightly larger thanδBxandδBz(see the following section for explanation). Interestingly, the total spectral index is close to−2.8 (α≈−2.75).
4. DISCUSSION AND SUMMARY
In this article, we study the effects of kinetic instabilities—in particular, mirror modes and AIC waves—on the small-scale turbulence in Earthʼs magnetosheath in terms of magnetic field
Figure 4. Same format as Figure2, but for measurements on board C3 on 2008 March 30 at 01:35–01:39.
Figure 5. Same format as Figure2, but for measurements on board C3 on 2008 March 25 at 06:51–06:56.
Figure 3. Same format as Figure2, but for measurements on board C3 on 2008 March 25 at 07:01–07:05.
anisotropy, spectral index, and spectral break at and above the ion scales using measurements from Cluster spacecraft.
First, we address the question of the scale responsible for the ion spectral break. We use cases of very high and low βi to clearly separate spatial scales (ρi and λi). We provide three cases, each showing a different scale (ρi, λi, and fc
i) as the
largest of the three. We show that, similarly to the solar wind (see Chen et al. 2014), a steepening occurs at the largest
characteristic scale (i.e., at fmin
i), which thus affects the
spectrum first (Spangler & Gwinn 1990), regardless of its
nature. However, we also demonstrate that at ion scales(i.e., in the range fmin f fmax
i i), power spectra can be modified
because of ion instabilities that are superposed on the background turbulence, and thus a power law is observed only at f>fmax
i(see Figure 1). Therefore, to study the small-scale
cascade(down to electron scales) more accurately we suggest to define its onset at fmaxi rather than at the break frequency.
Further we study the effects of mirror modes and AIC waves on the spectral index and anisotropy of magneticfield PSD in the high-frequency range ( fä[0.2, 10] Hz, depending on cases). In the case where no strong waves dominate, we observe a “background” small-scale turbulence that is quasi-isotropic(δBx≈δBy≈δBz). It has a spectral index α≈−2.8, which is consistent with scenarios of kinetic Alfvén waves (Howes 2008; Schekochihin et al. 2009), whistler modes
(Stawicki et al. 2001; Gary & Smith 2009), and compressive
Hall–MHD (Alexandrova et al. 2007, 2008a). When mirror
modes prevail at ion scales( <f fr
i), the parallel component is
enhanced in the dispersive range(Czaykowska et al.2001) and
δBP?δB⊥can be observed (see Figure3). Therefore, mirror modes can decrease the absolute value of the spectral index of amplitudefluctuations in the small-scale range, which is more likely to happen with large βi (see also Alexandrova et al. 2008b). Further, along with mirror modes we observe
non-gyrotropy(see also Figure5), which can be explained by
the fact that mirror modes have k^B0, and therefore 2D
turbulence is present, resulting in δBy>δBx since δBx has a component parallel to v (see Bieber et al. 1996; Matthaeus et al. 2007, for details). Here δBy=2δBx, which is consistent with the model of 2D turbulence developed in the cited papers. In cases where v is not low, this non-gyrotropy can also be reinforced by Doppler-shift effects as stated above (see also Alexandrova et al.2008b).
In contrast, when AIC waves prevail at ion scales, perpendicular components dominate in the high-frequency range and the fluctuations are observed to be gyrotropic (see Figure 4), because AIC waves have k B0 and thus slab
turbulence is present, resulting in δBx=δBy due to the axisymmetric condition (see again Bieber et al. 1996; Mat-thaeus et al.2007, for details). In the presence of either strong mirror or AIC waves at ion scales, the absolute value of the spectral index of the parallel or perpendicular components, respectively, is decreased (∣ ∣a ≈2–2.7). However, when both types of waves are observed simultaneously(see Figure 5),
k-vectors are mixed and thus a composite of 2D and slab turbulence is present (Bieber et al. 1996). This results in a
smaller non-gyrotropy(here δBy=1.2δBx) and the fluctuations become more isotropic(Alexandrova et al.2008b). In Figure5, the resulting spectral index is decreased(∣ ∣a » 2.75) but close to −2.8. This could be due to the fact that in this case the instabilities are already developed, and thus the energy of waves is lost to particles by wave–particle interaction at ion
scales and does not cascade toward higher frequencies. Therefore we mostly observe the background turbulence, whereas the cases in Figures3 and4 could correspond to the developing phase of the ion instabilities. However, this question requires a detailed study and is left for future investigation.
In summary, in this article the clear identification of kinetic instabilities in magnetic spectra provides experimental evi-dence showing that in Earthʼs magnetosheath: (1) the break of power spectra of magnetic field fluctuations occurs at the largest characteristic ion scale, regardless of its nature;(2) ion instabilities that are superposed on the background turbulence can, depending on the plasma parameters, modify the spectra up to fmaxi (corresponding to the smallest ion scale), and thus
we suggest to define the onset of the small-scale cascade at
fmax
i rather than at the break frequency;(3) in the small-scale
range, when no waves are observed, the background turbulence is quasi-isotropic (δBx≈δBy≈δBz) with an index of −2.8, consistent with kinetic Alfvén waves, whistler, and compres-sive Hall–MHD scenarios; (4) the observed non-gyrotropy of kinetic amplitude fluctuations can be due to a 2D turbulence developing in the presence of mirror modes (i.e., k^B0),
whereas gyrotropic amplitude fluctuations result from the possible development of slab turbulence in the presence of AIC waves (i.e., k B0); (5) when strong waves dominate, the
absolute values of spectral indices of the corresponding components are decreased (∣ ∣a < 2.8); (6) the presence of both waves reduces the anisotropy of amplitudefluctuations in the small-scale range, probably because of a combination of 2D and slab turbulence.
In conclusion, we point out that the power spectra at ion scales in Earthʼs magnetosheath are highly dependent on local plasma parameters and ion instabilities. Thus, in order to interpret them correctly, it is necessary to identify the local inhomogeneities(waves, structures) and take into account their respective effects on the turbulence at ion scales and in the small-scale range.
H.B.ʼs and E.Y.ʼs research has received funding from the European Communityʼs Seventh Framework Programme ([7/2007–2013]) under grant agreement n◦313038/STORM. Wavelet software was provided by C. Torrence and G. Compo, and is available athttp://atoc.colorado.edu/research/wavelets/.
REFERENCES
Alexandrova, O., Carbone, V., Veltri, P., & Sorriso-Valvo, L. 2007,P&SS,
55, 2224
Alexandrova, O., Carbone, V., Veltri, P., & Sorriso-Valvo, L. 2008a,ApJ,
674, 1153
Alexandrova, O., Chen, C. H. K., Sorriso-Valvo, L., Horbury, T. S., & Bale, S. D. 2013,SSRv,178, 101
Alexandrova, O., Lacombe, C., & Mangeney, A. 2008b,AnGeo,26, 3585
Alexandrova, O., Mangeney, A., Maksimovic, M., et al. 2006,JGRA, 111, 12208
Bale, S. D., Kasper, J. C., Howes, G. G., et al. 2009,PhRvL,103, 211101
Balogh, A., Carr, C. M., Acuña, M. H., et al. 2001,AnGeo,19, 1207
Bieber, J. W., Wanner, W., & Matthaeus, W. H. 1996,JGR,101, 2511
Bruno, R., & Carbone, V. 2013,LRSP,10, 2
Chen, C. H. K., Leung, L., Boldyrev, S., Maruca, B. A., & Bale, S. D. 2014,
GeoRL,41, 8081
Cornilleau-Wehrlin, N., Chauveau, P., Louis, S., et al. 1997,SSRv,79, 107
Czaykowska, A., Bauer, T. M., Treumann, R. A., & Baumjohann, W. 2001,
AnGeo,19, 275
Dmitruk, P., Matthaeus, W. H., & Seenu, N. 2004,ApJ,617, 667
Galtier, S. 2006,JPlPh,72, 721
Gary, S. P., & Smith, C. W. 2009,JGRA,114, 12105
Hellinger, P., Trávníček, P., Kasper, J. C., & Lazarus, A. J. 2006,GeoRL,
33, 9101
Howes, G. G. 2008,PhPl,15, 055904
Klein, K. G., Howes, G. G., & TenBarge, J. M. 2014,ApJL,790, L20
Leamon, R. J., Matthaeus, W. H., Smith, C. W., et al. 2000,ApJ,537, 1054
Lion, S., Alexandrova, O., & Zaslavsky, A. 2016,ApJ,824, 47
Matteini, L., Hellinger, P., Goldstein, B. E., et al. 2013,JGRA,118, 2771
Matteini, L., Landi, S., Hellinger, P., et al. 2007,GeoRL,34, 20105
Matthaeus, W. H., Bieber, J. W., Ruffolo, D., Chuychai, P., & Minnie, J. 2007,
ApJ,667, 956
Rème, H., Aoustin, C., Bosqued, J. M., et al. 2001,AnGeo,19, 1303
Rönnmark, K. 1982, Computation of the Dielectric Tensor of a Maxwellian Plasma, Tech. Rep.
Russell, C. T. 1972, NASSP,308, 365
Sahraoui, F., Belmont, G., & Goldstein, M. L. 2012,ApJ,748, 100
Sahraoui, F., Belmont, G., Rezeau, L., et al. 2006,PhRvL,96, 075002
Samsonov, A. A., Pudovkin, M. I., Gary, S. P., & Hubert, D. 2001,JGR,106, 21689
Schekochihin, A. A., Cowley, S. C., Dorland, W., et al. 2009, ApJS,
182, 310
Schwartz, S. J., Burgess, D., & Moses, J. J. 1996,AnGeo,14, 1134
Shevyrev, N. N., Zastenker, G. N., Eiges, P. E., & Richardson, J. D. 2006,
AdSpR,37, 1516
Spangler, S. R., & Gwinn, C. R. 1990,ApJL,353, L29
Stawicki, O., Gary, S. P., & Li, H. 2001,JGR,106, 8273
Torrence, C., & Compo, G. P. 1998,BAMS,79, 61
Vörös, Z., Baumjohann, W., Nakamura, R., Volwerk, M., & Runov, A. 2006,
SSRv,122, 301