HAL Id: hal-01780314
https://hal.archives-ouvertes.fr/hal-01780314
Submitted on 4 Jul 2018
HAL is a multi-disciplinary open access
archive for the deposit and dissemination of
sci-entific research documents, whether they are
pub-lished or not. The documents may come from
teaching and research institutions in France or
abroad, or from public or private research centers.
L’archive ouverte pluridisciplinaire HAL, est
destinée au dépôt et à la diffusion de documents
scientifiques de niveau recherche, publiés ou non,
émanant des établissements d’enseignement et de
recherche français ou étrangers, des laboratoires
publics ou privés.
and growth efficiency in the open NW Mediterranean
Sea
R. Lemee, E. Rochelle-Newall, France van Wambeke, Marie-Dominique Pizay,
P Rinaldi, Jean-Pierre Gattuso
To cite this version:
R. Lemee, E. Rochelle-Newall, France van Wambeke, Marie-Dominique Pizay, P Rinaldi, et al..
Sea-sonal variation of bacterial production, respiration and growth efficiency in the open NW
Mediter-ranean Sea. Aquatic Microbial Ecology, Inter Research, 2002, 29, pp.227 - 237. �10.3354/ame029227�.
�hal-01780314�
INTRODUCTION
Bacteria are the most abundant and most important biological component involved in the transformation and mineralization of organic matter in the biosphere. Planktonic heterotrophic bacteria contribute to the car-bon cycling in 2 major ways: (1) by the production of new biomass (bacterial secondary production, BP); and (2) by the remineralization of organic carbon (bacterial respiration, BR). However, the magnitude of the flow of organic carbon through bacterioplankton remains largely unknown because measurements of BP are sel-dom accompanied by measurements of BR (Jahnke & Craven 1995). Direct measurement of BR is
problem-atic because it requires either physical separation of bacteria from other members of plankton, the use of assumptions about the contribution of bacteria to total respiration or the use of selective inhibitors. The lack of knowledge about BR limits our ability to understand the role of bacteria in the carbon cycle of aquatic sys-tems (del Giorgio & Cole 1998).
More estimations of BP and BR would allow direct calculation of bacterial growth efficiency (BGE), which can simply be considered as the efficiency of conver-sion of dissolved to particulate organic carbon. Jahkne & Craven (1995) pointed out the large degree of uncer-tainty in estimates of BGE. In addition, Cole & Pace (1995) have argued that the high variability is probably not random and if the causes of this variation are envi-ronmental factors (such as nutrient status or type of organic substrate), then ecological information linked
© Inter-Research 2002 · www.int-res.com *E-mail: lemee@obs-vlfr.fr
Seasonal variation of bacterial production,
respiration and growth efficiency in the open
NW Mediterranean Sea
R. Lemée
1,*, E. Rochelle-Newall
1, F. Van Wambeke
2, M.-D. Pizay
1, P. Rinaldi
1,
J.-P. Gattuso
11Observatoire Océanologique, Laboratoire d’Océanographie de Villefranche, Equipe ‘Diversité, Biogéochimie et Ecologie Microbienne’, UPMC-CNRS UMR 7093, 06234 Villefranche-sur-Mer Cedex, France
2Laboratoire de Microbiologie Marine, CNRS UMR 6117, Centre d’Océanologie de Marseille, Campus de Luminy, Case 907, 13288 Marseille Cedex 09, France
ABSTRACT: Bacterial growth efficiency (BGE) can have a major influence on planktonic food web structure and function; however, its controlling factors are poorly understood. Here, we report results from an annual study aimed at examining bacterial respiration (BR), production (BP), biomass (BB) and BGE in the upper 130 m of the DYFAMED station (JGOFS site, France) in the NW Mediterranean Sea. From the pre-bloom period to early summer, and with a negative gradient from sub-surface to 130 m, bacterial parameters seem to follow each other, i.e. maximum respiration in February, maximum pro-duction in March and maximum biomass in April. BGE ranged from 0.1 to 43% throughout the study period and was highest during the spring bloom and during the fall. These data clearly showed the wide range of BGE that can be experienced at 1 site on an annual timescale in the surface mixed layer and suggest that several factors (concentrations of inorganic nutrients and DOC) control BGE at this site. Our results also suggested that this oligotrophic system is net heterotrophic.
KEY WORDS: Bacterial abundance · Bacterial production · Bacterial respiration · Bacterial growth efficiency · NW Mediterranean · DYFAMED
to this variance would be useful. In a review of BGE in natural aquatic systems, del Giorgio & Cole (1998) showed a consistent increase in BGE along gradients of productivity in aquatic systems, and this led them to suggest that a combination of the quality of the organic matter, nutrient availability and particular energetic demands in each type of system may regulate BGE.
The aim of this paper is to investigate bacterioplank-ton processes over a year in an open ocean system in order to establish environmental factors linked to BGE variation. The literature suggests seasonal cycles of bacterial metabolic activity (Pomeroy & Wiebe 1993, Griffith & Pomeroy 1995), but few studies have attempted to address seasonal changes in microbial respiratory rates, although such cycles could have a major influence on planktonic food web structure and function (Griffith & Pomeroy 1995) and on the carbon cycle. We compared seasonal variations of primary production (PP), chlorophyll a (chl a), DOC
concentra-tions, bacterial biomass (BB), bacterial production (BP), community respiration (CR) and bacterial respiration (BR), in the upper water column of the time series sta-tion DYFAMED (JGOFS site, France); a site which can be considered as representative of the whole NW Mediterranean Sea (Marty et al. 1994).
MATERIALS AND METHODS
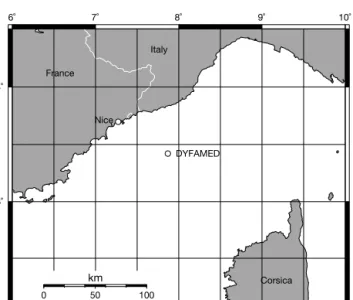
Study area and sample collection. Samples were collected at approximately monthly intervals at the DYFAMED station located in the central part of the NW Mediterranean Sea (43° 25’ N, 7° 52’ E; Fig. 1) from
January 1999 to January 2000. Water was sampled between 12:00 and 14:00 h GMT. Sampling was car-ried out at 5 depths for measurement of bacterial pro-cesses (5 m, depth of chl a maximum [DCM], 50, 90 and
130 m) using 12 l Niskin bottles mounted on a rosette coupled to a Seabird CTD system (SBE 9). Samples were also collected at 20 m depth when the DCM was close to 50 m.
Determination of nutrient and dissolved organic carbon concentrations. Additional samples were col-lected at 10 depths between the surface and 130 m for determination of inorganic nutrients. They were stored in 100 ml polyethylene bottles at –20°C pending analy-sis in the laboratory. Measurements were carried out using an Alliance-Instrument EV2 AutoAnalyzer as described by Tréguer & Le Corre (1975).
Samples for DOC analysis were collected in com-busted (450°C for 4 to 5 h) glass ampoules, flame-sealed immediately after collection and stored frozen (–18°C) until analysis. The samples were not filtered as the POC content of the samples is low at this site (< 3.6 µmol C l–1, Copin-Montégut & Copin-Montégut
1983) and should not, therefore, contribute signifi-cantly to the DOC values. The DOC analysis was performed using high temperature combustion on a Shimadzu TOC-5000 total organic carbon analyzer. A 4-point calibration curve (range: 0 to 200 µmol C l–1)
was constructed for each measurement day using potassium phthalate standards prepared fresh in UV treated Milli-Q water. The instrument blank was assessed using 2 external standards (Certified Refer-ence Materials, Hansell Laboratory, Bermuda Biologi-cal Station). The instrument blank was between 10 and 12 µmol C l–1for all samples and was subtracted from the measurements. All DOC concentrations reported are the average of 3 injections from each sample.
Chl a concentration and PP. Chl a concentrations
were determined by HPLC following the method of Vidussi et al. (1996, 2000). 14C PP was measured at 10
depths between the surface and 90 m with the self-contained in situ let go device (Dandonneau & Le
Boutellier 1992). The 250 ml chambers were incubated
in situ for 4 h centered around 12:00 h GMT after
addi-tion of 25 µCi of 14C sodium bicarbonate. At the end of
the incubation, the water samples were filtered on to glass fiber filters (GF/F, Whatman) and the incorpora-tion of label into the particulate fracincorpora-tion was counted on a Packard Tri-Carb 4000 scintillation counter. The correction factor described by Moutin et al. (1999) was used to convert PP rates obtained during the 4 h incu-bations to daily (24 h) rates.
BB and BP. Bacterial abundance was measured by a direct count method using epifluorescent microscopy and DAPI-stained samples (Porter & Feig 1980).
6˚ 7˚ 8˚ 9˚ 10˚ 42˚ 43˚ 44˚ France DYFAMED Nice Italy Corsica 0 50 100 km
Fig. 1. Location of the study site. Map plotted with online map creation (OMC) available at www.aquarius.geomar.de/omc/
Samples (20 ml) were preserved with 0.2 µm pore size filtered borax-buffered formalin (2% final concentra-tion) and stored refrigerated in the dark. With the exception of 2 instances, when we had technical prob-lems, slides were prepared within 24 h of sampling. For each slide, 5 ml of sample were stained with 0.2 µm filtered DAPI solution for 10 min and filtered onto a black 0.2 µm pore size Nuclepore membrane filter. Filters were mounted on glass slides with non-fluorescent immersion oil and stored frozen until enu-meration. Samples were analyzed in duplicate and at least 10 randomly selected microscope fields on each filter were counted using a Zeiss microscope (magnifi-cation 1250×). BB was calculated from the number of bacteria and a carbon content per cell of 15 fg C cell–1
(Caron et al. 1995).
Heterotrophic BP was estimated from the rate of pro-tein synthesis determined by the incorporation of 3
H-leucine into trichloroacetic acid (TCA) insoluble macromolecular material (Kirchman et al. 1985). Three 20 ml replicates from each depth were spiked with 20 nM of 2 nM 3H-leucine, specific activity 150 Ci
mmol–1 and 18 nM cold leucine mix and were incu-bated in the dark at in situ temperatures (±1.5°C) for
2 h. Preliminary experiments confirmed that leucine incorporation is linear during this period. One of the replicates, to which formalin had been added (2% final concentration) served as a control. The live incubations were terminated with formalin and all samples were filtered onto 0.2 µm, 25 mm diameter nitrocellulose fil-ters. Samples were then extracted with 5% TCA for 10 min followed by five 3 ml rinses with 5% TCA. The filters were placed in scintillation vials and 20 ml of filter count scintillation cocktail (Packard) was added. Radioactivity was counted with a Beckman LS 1800 counter and the counting efficiency was corrected for quenching. Concentration kinetic experiments showed that isotopic dilution was negligible when using 20 nM leucine. BP rates were then calculated from leucine incorporation rates using the conversion factor of 1.5 kg C mol–1leucine (Kirchman 1993). Daily BP were
calculated as 24 times the hourly rates.
CR, BR and BGE. Water samples were distributed into 60 ml BOD bottles (overflowing > 60 ml) as soon as the Niskin bottles arrived on deck. Three bottles were immediately fixed with Winkler reagents and a further 8 bottles were incubated in darkness at in situ
temper-ature (±1.5°C). A second set of 11 BOD bottles (3 ini-tials and 8 for incubations) were filled with filtered sea-water (0.8 µm, low vacuum pressure) from each depth, processed and incubated as described above. Two or 3 BOD bottles were fixed with Winkler reagents after approximately 30 and 48 h. At each timepoint, 1 bottle was processed, as described above, for subsequent determination of bacterial abundance.
Oxygen concentration was titrated with automated Winkler titration technique using a potentiometric end-point detection (Anderson et al. 1992) with an Orion redox electrode (9778-SC) and a custom built titrator. Reagents and standardizations were other-wise similar to those described by JGOFS (1996). The rate of respiration was determined by regressing O2
against time for all 3 timepoints (0, 30 and 48 h). We used a respiratory quotient of 1 and consider that respiration rates of non-filtered water correspond to community respiration (CR) and respiration of fil-tered water (0.8 µm) correspond to BR. BGE was calculated as BGE = BP/(BP + BR), where BR was calculated from the incubations described above and BP was determined using the incorporation of leucine in non-filtered water at each depth at the time of sampling.
The integrated values were calculated according to the classical trapezoidal method. All data are reported as mean ± SE.
RESULTS
Hydrological and nutrient conditions
The water column was well stratified in summer and surface temperature reached 25°C in August (Fig. 2A). In winter, water was well mixed and temperature was homogeneous with depth (13°C). The transition peri-ods between stratified and mixed water (and vice versa) occurred in spring (April) and early winter
(December). Density was mostly temperature-driven so that isopycnal contours (data not shown) match the isotherms.
Deep water mixing during winter brought up new nutrients into the upper layers. Highest nitrate concen-trations were observed in February when all upper water column nitrate concentrations were higher than 1 µmol l–1(Fig. 2B). In contrast, during stratified
peri-ods in spring and summer (late April to October), the well-established pycnocline constituted a strong bar-rier to nutrient replenishment of the surface layers and nitrate concentrations were below 0.5 µmol l–1 in the
upper (30 to 40 m) water column.
Chl a concentration and PP
High concentrations of nutrients in late winter drove maximum phytoplankton development in early spring. Chl a concentrations were higher than 1.0 µg l–1over
the entire water column (5 to 130 m) in March and exceeded 1.3 µg l–1between 20 and 110 m (Fig. 2C). A more modest chl a maximum was also observed in
De
p
th
(
m
)
De
p
th
(m
)
12 13 14 15 16 17 18 19 20 21 22 23 24 Temperature (°C)De
p
th
(
m
)
0.5 1 2 3 4 5 6 7Jan Feb Mar Apr May Jun Jul Aug Sep Oct Nov Dec Jan Jan Feb Mar Apr May Jun Jul Aug Sep Oct Nov Dec Jan
De
p
th
(
m
)
0 0.2 0.4 0.6 0.8 1 1.2 1.4Jan Feb Mar Apr May Jun Jul Aug Sep Oct Nov Dec Jan
Jan Feb Mar Apr May Jun Jul Aug Sep Oct Nov Dec Jan
Chl a (µg l-1 ) 10 30 50 70 90 110 130 10 30 50 70 90 110 130 10 30 50 70 90 110 130 10 30 50 70 90 110 130 40 50 60 70 80 90 100 110 120
A
B
C
D
DOC (µmol C l-1 ) NO 3 (µmol N l )-1Fig. 2. (A) Temperature, (B) nitrate, (C) chl a and (D) DOC at DYFAMED during the study period (January 1999 to January 2000). Points indicate sampling depths
De
p
th
(
m
)
De
p
th
(m
)
0 0.05 0.1 0.15 0.2 0.25 0.3De
p
th
(m
)
0.01 0.05 0.5 1 1.5 2 2.5Jan Feb Mar Apr May Jun Jul Aug Sep Oct Nov Dec Jan
Jan Feb Mar Apr May Jun Jul Aug Sep Oct Nov Dec Jan
BGE (%)
Jan Feb Mar Apr May Jun Jul Aug Sep Oct Nov Dec Jan
Jan Feb Mar Apr May Jun Jul Aug Sep Oct Nov Dec Jan
0 5 1 0 1 5 2 0 2 5 3 0 3 5 4 0 4 5 BP (µmol C l-1d-1) BB (µmol C l-1 ) BR (µmol O2 l-1d-1) 10 30 50 70 90 110 130 10 30 50 70 90 110 130 10 30 50 70 90 110 130
B
C
D
0 0.2 0.4 0.6 0.8 1 1.2 1.4 1.6 10 30 50 70 90 110 130A
De
p
th
(m
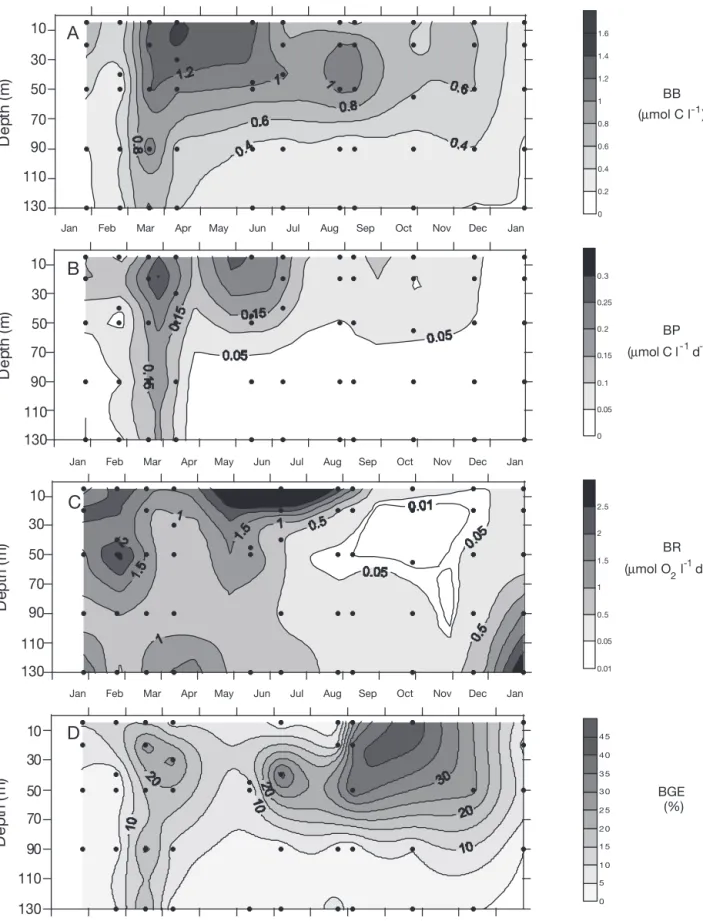
)
Fig. 3. (A) Bacterial biomass (BB), (B) bacterial production (BP), (C) bacterial respiration (BR) and (D) bacterial growth efficiency (BGE). Points indicate sampling depths
early summer, with concentrations ranging from 0.9 to 1.9 µg l–1between 30 and 50 m. The lowest chl a
con-centrations (< 0.2 µg l–1) were observed in sub-surface water in summer and in deep water (80 to 130 m) from June to January.
PP was highest in the surface water (Fig. 4A) at the beginning of February (>1.4 µmol C l–1d–1). Apart from
a sub-surface peak in April, PP was less than 0.2 µmol C l–1d–1throughout the entire water column.
DOC concentration
There are no data for the first half of the study period (January 1999 to July 1999). In August, surface values were approximately twice that of the deep water (113 vs 49 µmol l–1), indicating a net accumulation of
DOC in the upper water column (Fig. 2D). From August onwards, DOC concentration decreased in the upper water column to a surface value of 48 µmol l–1in
Janu-ary 2000. There was little change in the concentration of DOC below 60 m depth throughout the study period and the average concentration of the deeper samples was 50 ± 2 µmol l–1.
Bacterial biomass and production
Bacterial abundance ranged from 1.4 ×10⁵cells ml–1
at 130 m in January to 1.1 × 10⁶ cells ml–1 in
sub-surface water in April, corresponding to a BB of 0.18 and 1.40 µmol C l–1, respectively (Fig. 3A). The BB
maximum was located between 5 and 20 m during all of the study period, except from July to October, where it varied between 45 and 55 m depth. BB greater than 0.75 µmol C l–1 were observed from March to
Sep-tember in the upper 50 m, with maximum values in spring (>1.1 µmol C l–1). Deep water (90 and 130 m)
exhibited very low BB (mean = 0.26 µmol C l–1) except
in March and April, during which values higher than 0.45 µmol C l–1were observed.
BP ranged from undetectable at 130 m depth in January to 0.40 µmol C l–1d–1at 20 m in March (Fig. 3B).
It exhibited a similar evolution to BB, except that: (1) maxima were always measured between 5 and 20 m, even in summer; and (2) highest values (> 0.15 µmol C l–1
d–1) were observed from March to July. Deep water
(90 and 130 m) exhibited very low BP (mean = 0.01 µmol C l–1
d–1) except in March and April when higher rates were observed (mean = 0.14 µmol C l–1d–1).
De
p
th
(
m
)
0.1 0.3 0.5 0.7 0.9 1.1 1.3 1.5Jan Feb Mar Apr May Jun Jul Aug Sep Oct Nov Dec Jan
PP (µmol C l-1d-1) 0 1 2 3 4 5 6
Jan Feb Mar Apr May Jun Jul Aug Sep Oct Nov Dec Jan
CR (µmol O2 l-1d-1
10
30
50
70
90
110
130
10
30
50
70
90
110
130
A
B
De
p
th
(
m
)
)Respiration rates and BGE
Total CR rates ranged from 0 to 5.9 µmol O2l–1 d–1
(Fig. 4B). The lowest rates (< 0.5 µmol O2l–1d–1) were
observed in deep water during January and February, at intermediate depths during August and September, and throughout most of the water column from Octo-ber to DecemOcto-ber. CR was highest (>1.5 µmol O2 l–1
d–1) from March to July, with maxima in June and
July at 5 m (5.5 and 5.9 µmol O2l–1d–1, respectively).
Surface water in January and February 1999 and also some deeper points exhibited rates of respiration higher than 1.5 µmol O2 l–1 d–1. For the whole study
period, 75% of the CR rates measured were lower than 2 µmol O2l–1d–1with a median of 1.1 µmol O2l–1
d–1.
BR (fraction filtered on 0.8 µm) ranged from 0 to 3.18 µmol O2l–1d–1(Fig. 3C). A total of 75% of the BR
rates measured were lower than 1.4 µmol O2 l–1 d–1
with a median of 0.4 µmol O2l–1d–1. From January to
July, BR rates exceeded 0.5 µmol O2l–1d–1, with
max-ima located below 90 m in January and February, at 5 and 130 m in April and below 50 m from May to July. During the latter period (including 5 m in August and 130 m in December), BR accounted for 78% of total CR (n = 25, SE = 11). From August to December (excluding 5 m in August and 130 m in December), the average BR rate was 0.22 µmol O2 l–1 d–1. During this period, BR
accounted for only 33% (n = 13, SE = 6) of total CR (n = 11). Overall, BR accounted for 67% (n = 39, SE = 9) of CR.
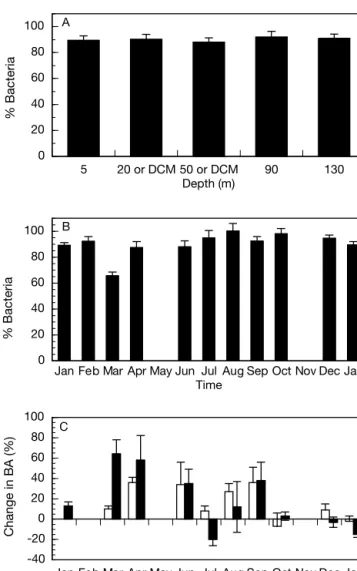
On average, only 10 ± 2% of bacteria were retained on the filters used to prepare the BR size fraction. Although the annual average of the fraction of bacteria passing through the filter did not vary with depth (Fig. 5A), there were some differences between the monthly averages (Fig. 5B): in March, only 66 ± 3% of the seawater bacteria were recov-ered in the filtrate whereas in August, all the bacteria were recovered.
Bacterial abundance generally increased during the incubations. After 48 h, the average increase was 17 ± 4% for seawater incubations and 16 ± 5% for the < 0.8 µm size fraction. There were large differences between months and sometimes the number of bacte-ria decreased during incubation in the < 0.8 µm size fraction (Fig. 5C). In 2 of the months studied (July 1999 and January 2000), we saw slight decreases in bacter-ial abundance during the incubations. This could have been due to the presence of viruses (Fuhrman 1999) or grazing activity, although the latter is unlikely as we used a 0.8 µm filter to separate the size fractions, a pore size that should have removed the majority of the grazers in this environment (Tanaka & Rassoul-zadegan 2002).
BGE was calculated using all data except those for which BP or BR was below detection limits (10 data). BGE varied from 0.1% (January 1999, 90 m) to 43% (October, 5 m), with mean and median values of 11% (n = 43, SE = 2) and 7%, respectively, and with 3⁄
4 of
the values less than 18% (Fig. 3D). During January and February, BGE was low throughout the whole water column (<10%); it then increased during March and April (>10% at most depths), reaching a maxi-mum of 26% in the DCM. In summer, BGE was higher than 10% at intermediate depths and reached 38% at 50 m in July. In the fall, BGE was above 10% down to a depth of 90 m. 5 20 or DCM 50 or DCM 90 130 0 20 40 60 80 100 Depth (m) A
Jan Feb Mar Apr May Jun Jul Aug Sep Oct Nov Dec Jan 0 20 40 60 80 100 Time B
Jan Feb Mar Apr May Jun Jul Aug Sep Oct Nov Dec Jan -40 -20 0 20 40 60 80 100 Time C % Bacteria % Bacteria Change in BA (%)
Fig. 5. Percentage of bacteria in the 0.8 µm size fraction and changes in bacterial abundance (BA) in the respiration incu-bations. (A) Average percentage of bacteria in the 0.8 µm size fraction at each depth for the whole year. DCM: depth of chloropyll a maximum. (B) Monthly averages of the percent-age of bacteria in the 0.8 µm size fraction relative to that of unfiltered water. (C) Change in bacterial abundance over the 48 h of the incubations for both the unfiltered (open bars) and
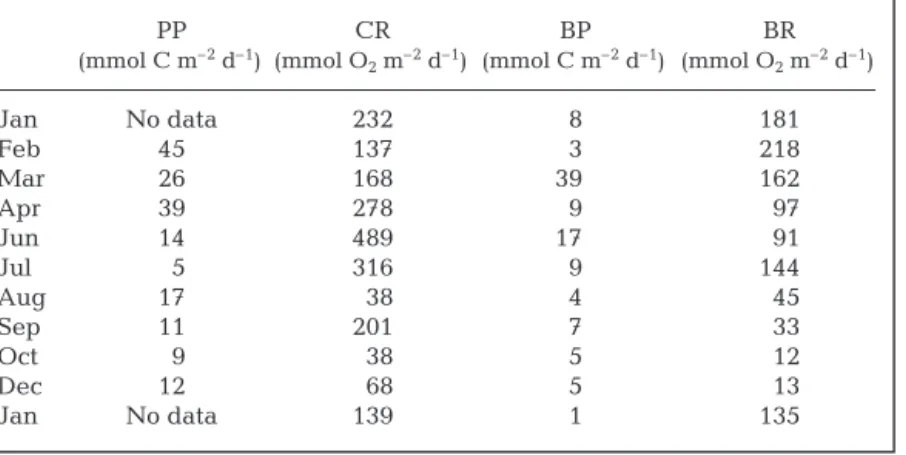
Depth-integrated PP and CR
The PP integrated between the surface and 90 m was highest in February and April, and lowest in the sum-mer and fall (Table 1). The depth-integrated CR exhib-ited a relatively similar pattern with an additional peak in June and a relatively high value in September.
DISCUSSION
Trophic status and seasonal changes of biological processes
The DYFAMED station, situated in the central part of the Ligurian sea, is not influenced by the Ligurian Cur-rent. The Liguro-Provencal frontal system (Béthoux et al. 1988) acts as a physical barrier to lateral inputs and limits the influence of the coast. The weakness of horizontal advective movements at this site has re-cently been confirmed (Andersen & Prieur 2000) and DYFAMED can be considered as representative of the whole NW Mediterranean Sea (Marty et al. 1994). This area is characterized by a large seasonal variability of hydrological structures, from deep homogenization of the water column in winter to strong stratification in summer. These conditions result in various seasonal trophic regimes from mesotrophic conditions in spring to oligotrophy in summer, with characteristic spring blooms occurring during April and May (Andersen & Prieur 2000, Vidussi et al. 2000). During our study, an early bloom occurred in March and was followed by a deep (40 m) chl a maximum during the summer
strati-fication.
The various hydrologic and trophic regimes ob-served over a year at DYFAMED led to a great varia-tion of bacterial activity. From the pre-bloom period to
early summer, and with a negative gradient from sub-surface to maxi-mum depth of sampling, bacterial parameters seem to follow each other, i.e. maximum respiration in February, maximum production in March and maximum biomass in April.
The fraction of the bacterial commu-nity passing through the 0.8 µm poros-ity membrane (for BR measurements) also exhibited seasonal changes. It ranged from 66% in March to 100% in August. Two hypotheses could explain this difference: (1) a seasonal change in bacterial cell size, with larger bacteria in the bloom period; or (2) a seasonal change in the fraction of free and attached bacteria. Since the BR was measured on the filtered fraction, it is likely that its estimate was good in summer but probably underestimated in March, implying an overestimation of BGE in this month.
Diel variations were not taken into account in our study since we collected samples at the same hour (± 2 h) each month. Our aim was to study bacterial processes at a seasonal scale, with samples collected monthly. Nevertheless, processes measured in a sample collected once a month may not exactly reflect the monthly mean of the processes. This has already been demonstrated at DYFAMED, since BB and BP can exhibit large changes over a few days, especially in post bloom period (Van Wambeke et al. 2001).
Assuming a conversion factor of 15 fg C per bacteria, BB in our study is in agreement with those reported in the literature for the open NW Mediterranean, which ranged from 0.23 to 1.6 µmol C l–1(e.g. Fernandez et al.
1994, Van Wambeke et al. 1996, Tanaka & Rassoul-zadegan 2002). Values of BP (ranging from unde-tectable to 0.34 µmol C l–1d–1) are also comparable to
those already measured at DYFAMED or in other parts of Mediterranean (Conan et al. 1999, Van Wambeke et al. 2001).
Regulation of BGE
BGE ranged from less than 1% to more than 40% throughout the study period, and were within the ranges observed by other researchers in oligotrophic and oceanic sites (Carlson & Ducklow 1996). Many factors, such as temperature and availability of inor-ganic nutrients and DOC, can potentially control BGE. Although temperature appears to have little effect on BGE in our data set, BGE is negatively correlated with NO3(r = –0.54, p < 0.01) and PO4(r = –0.63, p < 0.01), PP CR BP BR (mmol C m–2d–1) (mmol O 2m–2d–1) (mmol C m–2d–1) (mmol O2m–2d–1) Jan No data 232 8 181 Feb 45 137 3 218 Mar 26 168 390 162 Apr 39 278 9 097 Jun 14 489 170 091 Jul 05 316 9 144 Aug 17 038 4 045 Sep 11 201 7 033 Oct 09 038 5 012 Dec 12 068 5 013 Jan No data 139 1 135
Table 1. Integrated values of primary production (PP), community respiration (CR), bacterial production (BP) and bacterial respiration (BR). Data were
and positively correlated with DOC (r = 0.50, p < 0.05) and chl a (r = 0.32, p < 0.05). It is surprising that
rela-tively high concentrations of PO4would lead to lower
BGE because the Mediterranean Sea is generally con-sidered to be P limited (e.g. Thingstad & Rassoulzade-gan 1995). There is, therefore, another factor involved in the control of BGE at this site, perhaps DOM quality (Biddanda et al. 1994, Carlson & Ducklow 1996).
Although these correlations permit us to predict when we would see elevated BGE, it does not really identify the regulatory mechanisms. The equation for calculating BGE is comprised of 2 parameters (BR and BP), either of which can be responsible for changes in BGE. There is no significant relationship between BR and any of the physical or chemical parameters mea-sured, with the exception of chl a. This suggests that
BR is controlled by either another unmeasured factor, or is controlled at a timescale (i.e. sub-monthly), which has not been addressed in this data set. It seems that BR was not directly influenced by temperature, con-trary to the conclusions of Rivkin & Legendre (2001).
The lack of correlation between BR and the other parameters could be in part due to the probable under-estimation of BP in March. However, this only concerns 5 data and cannot fully account for the lack of correla-tion. Conversely, BP was highly correlated with NO3,
PO4, DOC and chl a, which suggests that it is BP rather
than BR that is varying in response to changes in these environmental parameters.
Interestingly, although the correlations between BP and DOC and chl a were positive, the correlations
between BP and inorganic nutrients were negative. It is probable that these parameters themselves are not directly influencing BP but are exerting an influence on the accumulation of DOC and chl a. This is intuitive
when one examines the depletion of inorganic nutri-ents corresponding to the increase in chl a and DOC.
del Giorgio & Cole (1998) proposed that the variability of BGE is probably not so much explained by 1 single factor but by a combination of factors. Given the rela-tively large seasonal changes in environmental para-meters experienced at DYFAMED, it is improbable that 1 single factor controls BGE at all depths and throughout the entire season. Indeed, recently, Van Wambeke et al. (2002) found that in the fall, BP at DYFAMED appears to be limited by phosphorus in the upper 40 m and by carbon below 40 m.
Autotrophy versus heterotrophy
The rates of 14C PP (0 to 1.6 mmol C m–2 d–1) are
within the range of data reported in the literature in the NW Mediterranean Sea (0 to 5.6 mmol C m–2d–1; Lefèvre et al. 1994, Conan et al. 1999, Diaz et al. 2001).
The rates of CR at depths lower than 130 m (range of 0 to 3.18 and average of 0.8 mmol O2m–2d–1) are also in
good agreement with published values for the Mediterranean Sea (range between –1 and 4.5 and average value of 0.7 mmol O2m–2d–1; e.g. Williams &
Robinson 1990, 1992, Savenkoff et al. 1992, 1993, Lefèvre et al. 1994, 1996, Agustí et al. 1998). The rates of 14C PP are significantly lower than the rates of CR
whether expressed in volumetric (µmol l–1 d–1) or
depth-integrated (mmol m–2d–1) units.
The status of oligotrophic areas in terms of carbon balance has been the subject of considerable contro-versy. del Giorgio et al. (1997) have suggested that aquatic ecosystems exhibiting rates of 14C PP lower than 8.3 µmol C l–1d–1are net heterotrophic (PP lower
than CR). This conclusion was supported by Duarte & Agusti (1998) who examined the balance between heterotrophy and autotrophy in a range of environ-ments, and concluded that there was evidence of net heterotrophy in the upper ocean. This was subse-quently challenged by Williams (1998) who could not find any evidence of this in his analyses of the balance between net heterotrophy and net autotrophy in open ocean regions. Over and above the problems associ-ated with the numerical analysis of the P versus R relationship (Williams & Bowers 1999), there are also several methodological reasons that render the estima-tion of metabolic status difficult. It is beyond the scope of the present paper to review these reasons, and so we will just list the major ones.
Most techniques used to estimate PP and respiration involve incubation of water samples. Containment potentially changes the original pelagic community, for example by excluding the predators of microzooplank-ton, which then graze phytoplankton at a higher rate. The 14C technique is the most popular method used
to estimate PP because it is relatively easy to use. However, it is unknown whether it measures net or gross PP because some of the radiolabel incorporated in photosynthates can subsequently be respired (Peterson 1980). The rates measured are close to gross PP when short (typically a few hours) incubations are used and close to net PP when longer (typically 12 h or more) incubations are used. Furthermore, the stan-dard 14C technique (JGOFS 1996) only measures the
incorporation of carbon into particulate matter (14
C-POC). However, some of the carbon fixed can leak from phytoplanktonic cells as dissolved organic mat-ter (14C-DOC), with the result that the total PP can be
significantly underestimated. Recent data collected in the subtropical North Pacific Ocean demonstrate that
14C-DOC can be nearly 50% of 14C-POC (Karl et al.
1998) and in the SW Mediterranean sea dissolved PP can represent 4 to 44% of total PP (Morán & Estrada 2001).
The sensitivity of the oxygen technique is lower than that of the 14C technique. Consequently incubations
must be longer and measurements of CR in oligo-trophic areas usually last for 24 to 48 h. This can lead to a large increase in the bacterial population (Pomeroy et al. 1994) and to changes in the bacterial community composition (Massana et al. 2001, Gattuso et al. in press).
An additional difficulty arises when PP and respira-tion are measured using different techniques. Meta-bolic quotients must then be used to express the pro-cesses in similar units in order to compare them. These quotients are not often measured and their values are not well constrained. The photosynthetic quotient (PQ: mole of O2released per mole of CO2fixed) varies as a
function of O2and CO2concentration, nitrogen
avail-ability, photosynthate quality and light intensity (see Williams et al. 1979, Gattuso & Jaubert 1988). A PQ value of 1.25 is often assumed. The respiratory quo-tient (RQ: mole of CO2 released per mole of O2
con-sumed) varies essentially as a function of the quality of the organic matter catabolized (Gnaiger 1983) and ranges between 0.7 and 1.0.
Assuming that PQ = 1.25 and that 14C-DOC is 50% of 14C-POC, the ratio of depth-integrated PP versus CR at
the DYFAMED site ranges from 0.1 to 1.1. This sug-gests that it was net autotrophic in February and August, and net heterotrophic during the remaining months. All the 14C PP measured at DYFAMED during
the study period are lower than the threshold value of 8.3 µmol C m–2 d–1 suggested by del Giorgio et al.
(1997). Our data seem therefore to support their con-clusion that oligotrophic systems are net heterotrophic. However, as mentioned above, our estimates involve many assumptions (fixed PQ and percent 14C-DOC PP)
and must be considered as preliminary.
Our study only considered the balance between res-piration and photosynthesis in the upper 130 m. In the deeper waters, where there is no PP and degradation of organic matter dominates, clearly the respiration processes will accentuate the water column CO2
bud-get and so render this environment even more hetero-trophic. The probable decoupling between production in the surface layers and degradation deep layers further complicates the development of an integrated carbon budget in this system.
Acknowledgements. Thanks are due to A. Stock as well as the Captain and crew of the RV ‘Tethys II’ for invaluable help in the field. J. Chiaverini and J.-C. Marty kindly provided chlorophyll a and primary production data. We also wish to thank 2 anonymous reviewers for their helpful comments. Funding was provided by a CNRS ATIPE grant. This is a contribution of the DYFAMED project, a France-JGOFS initiative.
LITERATURE CITED
Agustí S, Satta MP, Mura MP, Benavent E (1998) Dissolved esterase activity as a tracer of phytoplankton lysis: evi-dence of high phytoplankton lysis rates in Northwestern Mediterranean. Limnol Oceanogr 43:1836–1849
Andersen V, Prieur L (2000) One-month study in the open NW Mediterranean Sea (DYNAPROC experiment, May 1995): overview of the hydrobiological structures and effects of wind events. Deep-Sea Res I 47:397–422
Anderson LG, Haraldsson C, Lindegren R (1992) Gran lin-earization of potentiometric Winkler titration. Mar Chem 37:179–190
Béthoux JP, Prieur L, Bong JH (1988) Le courant Ligure au large de Nice. Oceanol Acta 9:59–67
Biddanda B, Opsahl S, Benner R (1994) Plankton respiration and carbon flux through bacterioplankton on the Loui-siana Shelf. Limnol Oceanogr 39:1259–1275
Carlson CA, Ducklow HW (1996) Growth of bacterioplankton and consumption of dissolved organic carbon in the Sar-gasso Sea. Aquat Microb Ecol 10:69–85
Caron DA, Dam HG, Kremer P, Lessard EJ and 6 others (1995) The contribution of micro-organisms to particulate carbon and nitrogen in surface waters of the Sargasso Sea near Bermuda. Deep-Sea Res I 42:943–972
Cole JJ, Pace ML (1995) Why measure bacterial production? A reply to the comment by Jahnke and Craven. Limnol Oceanogr 40:441–444
Conan P, Turley C, Stutt E, Pujo-Pay M, Van Wambeke F (1999) Relationship between phytoplankton efficiency and the proportion of bacterial production to primary production in the Mediterranean Sea. Aquat Microb Ecol 17:131–144 Copin-Montégut C, Copin-Montégut G (1983) Stoichiometry
of carbon, nitrogen, and phosphorus in marine particulate matter. Deep-Sea Res 30:31–46
Dandonneau Y, Le Bouteillier A (1992) A simple and rapid device for measuring planktonic primary production by in situ sampling, and 14C injection and incubation. Deep-Sea
Res 39:795–803
del Giorgio PA, Cole JL (1998) Bacterial growth efficiency in natural aquatic systems. Annu Rev Ecol Syst 29:503–541 del Giorgio PA, Cole JJ, Cimbleris A (1997) Respiration rates in bacteria exceed phytoplankton production in unpro-ductive aquatic systems. Nature 385:148–151
Diaz F, Raimbault P, Boudjellal B, Garcia N, Moutin T (2001) Early spring phosphorus limitation of primary productivity in a NW Mediterranean coastal zone (Gulf of Lions). Mar Ecol Prog Ser 211:51–62
Duarte CM, Agustí S (1998) The CO2balance of unproductive
aquatic ecosystems. Science 281:234–236
Fernandez M, Bianchi M, Van Wambeke F (1994) Bacterial biomass, heterotrophic production and utilization of dis-solved organic matter photosynthetically produced in the Almeria-Oran front. J Mar Syst 5:313–325
Fuhrman JA (1999) Marine viruses and their biogeochemical and ecological effects. Nature 399:541–548
Gattuso JP, Jaubert J (1988) Computation of metabolic quo-tients in plant-animal symbiotic units. J Theor Biol 130: 205–212
Gattuso JP, Peduzzi S, Pizay MD, Tonolla M (in press) Changes in bacterial community composition during measurements of microbial and community respiration. J Plankton Res
Gnaiger E (1983) Calculation of energetic and biochemical equivalents of respiratory oxygen consumption. In: Gnaiger E, Forstner H (eds) Polarographic oxygen sensors: aquatic and physiological applications, Appendix C.
Springer-Verlag, Berlin, p 337–345
Griffin PC, Pomeroy LR (1995) Seasonal and spatial variations in pelagic community respiration on the south eastern U.S. continental shelf. Cont Shelf Res 15:815–825
Jahnke RA, Craven DB (1995) Quantifying the role of hetero-trophic bacteria in the carbon cycle: a need for respiration rate measurements. Limnol Oceanogr 40(2):436–441 JGOFS (Joint Global Ocean Flux Study) (1996) Protocols for
the JGOFS core measurements. In: Knap A, Michaels A, Close A, Ducklow H, Dickson A (eds) JGOFS Rep No. 19. Reprint of the Intergovernmental Oceanographic Com-mission Manuals and Guides (1994) No. 29, Bergen Karl DM, Hebel DV, Bjökman K, Letelier RM (1998) The role
of dissolved organic matter release in the productivity of the oligotrophic North Pacific Ocean. Limnol Oceanogr 43:1270–1286
Kirchman DL (1993) Leucine incorporation as a measure of biomass production by heterotrophic bacteria. In: Kemp PF, Sherr BF, Sherr EB, Cole JJ (eds) Handbook of meth-ods in aquatic microbial ecology. Lewis, Boca Raton, p 509–512
Kirchman DL, K’nees E, Hodson R (1985) Leucine incorpora-tion and its potential as a measure of protein synthesis by bacteria in natural aquatic ecosystems. Appl Environ Microbiol 49:599–607
Lefèvre D, Bentley TL, Robinson C, Blight SP, Williams PJLeB (1994) The temperature response of gross and net commu-nity production and respiration in time-varying assem-blages of temperate marine micro-plankton. J Exp Mar Biol Ecol 184:201–215
Lefèvre D, Denis M, Lambert CE, Miquel JC (1996) Is DOC the main source of organic matter remineralization in the ocean water column? J Mar Syst 7:281–291
Marty JC, Nicolas JC, Miquel JC, Fowler SC (1994) Particu-late fluxes of organic compounds and their relationship to zooplankton fecal pellets in the northwestern Mediter-ranean Sea. Mar Chem 46:387–405
Massana R, Pedrós-Alió C, Casamayor EO, Gasol JM (2001) Changes in marine bacterioplankton phylogenetic compo-sition during incubations designed to measure biogeo-chemically significant parameters. Limnol Oceanogr 46: 1181–1188
Morán XAG, Estrada M (2001) Short-term variability of pho-tosynthetic parameters and particulate and dissolved pri-mary production in the Alboran Sea (SW Mediterranean). Mar Ecol Prog Ser 212:53–67
Moutin T, Raimbault P, Poggiale JC (1999) Primary produc-tion in surface waters of the western Mediterranean sea. Calculation of daily production. CR Acad Sci Paris 322: 651–659
Peterson BJ (1980) Aquatic primary productivity and the 14
C-CO2method: a history of the productivity problem. Annu
Rev Ecol Syst 11:359–385
Pomeroy LR, Wiebe WJ (1993) Energy sources for microbial food webs. Mar Microb Food Webs 7:101–118
Pomeroy LR, Sheldon JE, Sheldon WMJ (1994) Changes in bacterial numbers and leucine assimilation during estima-tions of microbial respiratory rates in seawater by the precision Winkler method. Appl Environ Microbiol 60: 328–332
Porter KG, Feig TS (1980) The use of DAPI for identifying and counting aquatic microflora. Limnol Oceanogr 25: 943–948
Rivkin RB, Legendre L (2001) Biogenic carbon cycling in the
upper ocean: effects of microbial respiration. Science 291: 2398–2400
Savenkoff C, Da Silva NL, Lefèvre D, Denis M, Rassoulzade-gan F (1992) Contribution of the different planktonic microbial assemblages to ETS activity in the Ligurian frontal area: northwestern Mediterranean Sea. J Plankton Res 14:835–850
Savenkoff C, Prieur L, Reys JP, Lefevre D, Dallot S, Denis M (1993) Deep microbial communities evidenced in the Liguro-Provencal front by their ETS activity. Deep-Sea Res 40:709–725
Tanaka T, Rassoulzadegan F (2002) Full-depth profile (0–2000 m) of bacteria, heterotrophic nanoflagellates and ciliates in the NW Mediterranean Sea: vertical partition-ing of microbial trophic structures. Deep-Sea Res II 49:2093–2107
Thingstad TF, Rassoulzadegan F (1995) Nutrient limitations, microbial food webs, and ‘biological C-pumps’: suggested interactions in a P-limitated Mediterranean. Mar Ecol Prog Ser 117:299–306
Tréguer P, Le Corre P (1975) Manuel d’analyse des sels nutri-tifs dans l’eau de mer (utilisation de l’AutoAnalyzer Tech-nicon), 2nd edn. Université de Bretagne Occidentale, Brest
Van Wambeke F, Christaki U, Gaudy R (1996) Carbon fluxes from the microbial food web to mesozooplankton. An approach in the surface layer of a pelagic area (NW Mediterranean Sea). Oceanol Acta 19:57–66
Van Wambeke F, Goutx M, Striby L, Sempéré R, Vidussi F (2001) Bacterial dynamics during the transition from spring bloom to oligotrophy in the Northwestern Mediter-ranean Sea: relationships with particulate detritus and dis-solved organic matter. Mar Ecol Prog Ser 212:89–105 Van Wambeke F, Christaki U, Giannakourou A, Moutin T,
Souvemerzoglou K (2002) Longitudinal and vertical trends of bacterial limitation by phosphorus and carbon in the Mediterranean Sea. Microb Ecol 43:119–133
Vidussi F, Claustre H, Bustillos-Guzman J, Cailliau C, Marty JC (1996) Determination of chlorophylls and carotenoids of marine phytoplankton: separation of chlorophyll a from divinyl-chlorophyll a and zeaxanthin from luthein. J Plankton Res 18:2377–2382
Vidussi F, Marty JC, Chiaverini J (2000) Phytoplankton pig-ment variations during the transition from spring bloom to oligotrophy in the Northwestern Mediterranean sea. Deep-Sea Res I 47:423–445
Williams PJLeB (1998) The balance of plankton respiration and photosynthesis in the open oceans. Nature 394:55–57 Williams PJLeB, Bowers DG (1999) Regional carbon
imbal-ances in the oceans. Science 284:1735
Williams PJLeB, Robinson C (1990) Seasonal differences in the control of productivity in the Rhone outfall region of the Gulf of Lions. In: Martin JM, Barth H (eds) Water pol-lution research reports ‘EROS 2000’. Commission of the European Communities, Brussels, Vol 20, p 145–154 Williams PJLeB, Robinson C (1992) Analysis of oxygen-based
productivity measurements through phase I of the EROS 2000 programme. In: Martin JM, Barth H (eds) Water pol-lution research reports ‘EROS 2000’. Commission of the European Communities, Brussels, Vol 28, p 151–162 Williams PJLeB, Raine RCT, Bryan JR (1979) Agreement
between the 14C and oxygen methods of measuring
phyto-plankton production: reassessment of the photosynthetic quotient. Oceanol Acta 2:411–416
Editorial responsibility: David Karl, Honolulu, Hawaii, USA
Submitted: January 11, 2002; Accepted: June 7, 2002 Proofs received from author(s): September 12, 2002