https://doi.org/10.4224/12340979
READ THESE TERMS AND CONDITIONS CAREFULLY BEFORE USING THIS WEBSITE.
https://nrc-publications.canada.ca/eng/copyright
Vous avez des questions? Nous pouvons vous aider. Pour communiquer directement avec un auteur, consultez la
première page de la revue dans laquelle son article a été publié afin de trouver ses coordonnées. Si vous n’arrivez pas à les repérer, communiquez avec nous à [email protected].
Questions? Contact the NRC Publications Archive team at
[email protected]. If you wish to email the authors directly, please see the first page of the publication for their contact information.
For the publisher’s version, please access the DOI link below./ Pour consulter la version de l’éditeur, utilisez le lien DOI ci-dessous.
Access and use of this website and the material on it are subject to the Terms and Conditions set forth at
Microstructure of First Year Sea Ice Ridges
Johnston, Michelle; Barker, Anne
https://publications-cnrc.canada.ca/fra/droits
L’accès à ce site Web et l’utilisation de son contenu sont assujettis aux conditions présentées dans le site LISEZ CES CONDITIONS ATTENTIVEMENT AVANT D’UTILISER CE SITE WEB.
NRC Publications Record / Notice d'Archives des publications de CNRC:
https://nrc-publications.canada.ca/eng/view/object/?id=458d2a71-fedf-4741-af2b-c0134f0c6fe7 https://publications-cnrc.canada.ca/fra/voir/objet/?id=458d2a71-fedf-4741-af2b-c0134f0c6fe7
M. Johnston and A. Barker
Technical Report HYD-TR-043 May 2000
M. Johnston and A. Barker Canadian Hydraulics Centre National Research Council of Canada
Ottawa, Ont. K1A 0R6 Canada
Technical Report HYD-TR-043
ABSTRACT
First year sea ice ridges were characterized off the West Coast of Newfoundland from 07 to 22 March 1999. This report presents a comprehensive investigation of five ridges sampled during the March 1999 program. The ice microstructure of the ridges is correlated to the bulk physical properties (temperature, salinity and density) and consolidated layer thickness of the ridged ice.
The ridges had a maximum sail height that ranged from 1.5 to 3.8 m. The consolidated layer thickness of the ridged ice ranged from 0.7 to 2.1 m and the total ice thickness varied from 1.8 to 5.0 m. The temperature of the ice cores was just below 0°C. The average bulk ice salinity ranged from 3.6 to 4.1 ‰, with a maximum of 6 ‰. Ice densities from the examined ridge site ranged from 0.85 to 0.93 Mg/m³. The warm temperatures, high porosity and low density of the ice indicated temperate ridges in a deteriorated state. Due to the deteriorated state of the ridged ice, it is expected that the measured average salinity of the ridges may have decreased after the ridge formed.
The sail blocks showed that the ice involved in the ridge formation consisted of columnar grained ice, predominantly. Examination of the macrostructure of ridged ice cores showed highly porous, loosely consolidated ice with discrete banding. The microstructure of the cores revealed a non-uniform matrix comprised of mostly granular ice, with some coarse frazil particles and elongated columns.
TABLE OF CONTENTS
ABSTRACT ... i
TABLE OF CONTENTS ... ii
LIST OF FIGURES... iii
LIST OF TABLES... iii
1. INTRODUCTION ...1
2. BACKGROUND ...2
3. WEST COAST NEWFOUNDLAND FIELD STUDY ...3
3.1 Macrostructure of Ridged Ice ...4
3.2 Profiles of Ridge Surface/Bottom Topography ...5
3.3 Consolidated Layer of Ridged Ice ...6
3.4 Extraction of Ice Cores from Ridged Ice off the West Coast of Newfoundland...8
3.5 Cores Extracted for Temperature and Salinity Measurements...9
3.6 Cores Extracted for Microstructural Studies ...9
4. REFERENCES ...50
APPENDIX A: ...1
Microstructure of Site 10 ...1
APPENDIX B: ...1
LIST OF FIGURES
Figure 1 First year Ridges analyzed for Ice Microstructure ... 4
Figure 2 Ridge Macrostructure... 5
Figure 3 Simplified Illustration of the Consolidated Layer in Ridged Ice ... 7
Figure 4 Typical Consistency of Core Fragments from Ridged Ice ... 8
LIST OF TABLES
Table 1 Ridges Sampled during the Field Project ... 3MICROSTRUCTURE OF FIRST YEAR SEA ICE RIDGES
1. INTRODUCTION
Ridged ice can exert significant loads on structures in ice covered waters. Consequently, ridges are of primary concern to arctic offshore platforms and ships traversing polar regions. To date, a considerable amount of field work and mechanical strength testing has been devoted to multiyear ridges in the Beaufort Sea (Kovacs and Mellor, 1971; Kovacs, 1975; Cox et al., 1984, 1985). Similar studies have been conducted on first year ridges in the high Arctic (Gladwell, 1976; McGonigal, 1978; Vaudrey, 1980). Less work has been performed on ridges in the temperate latitudes (Veitch et al., 1991; Williams and Kirby, 1994; Smirnov et al. 1999).
Previous investigations of first year and multiyear ridges have focussed upon the ice macrostructure. Ridges have been characterized by their surface topography, total thickness, consolidated layer thickness and by the mechanical strength of the ice. Most of these studies, however, did not document ice microstructure of the ridges. Notable exceptions include the examination of first year ridges by Nadreau (1976) and the comprehensive documentation of multiyear ridges by Cox et al. (1984;1985).
The relevance of ice microstructure to the mechanical strength of the ice has been well established. In the context of this report, the ice microstructure of five ridges sampled off the West Coast of Newfoundland is used to further the understanding of ridge formation and the ice consolidation process.
A brief background of the West Coast Newfoundland field program is given followed by a discussion of the ridge building process and ridge-related parameters. Subsequent sections present the physical property measurements of the ice from five ridges on a case-by-case basis. Particulars of each site are discussed, including profiles of the consolidated layer thickness and the temperature and salinity of the ice. The microstructural details of ridged ice from the five sites are then examined. Several thin sections are used to illustrate the observed crystallographic patterns and trends from each site.
2. BACKGROUND
The potential development of hydrocarbon resources off the West Coast of Newfoundland motivated a two-week investigative effort into ridged ice in that area. Ten first year ridges off the West Coast Newfoundland were examined from 07 to 22 March 1999. The field program was conducted by K.R. Croasdale and Associates, co-sponsored by the Program of Energy Research and Development (PERD) and Exxon Production Research (EPR). Canadian Hydraulics Centre (CHC) of the National Research Council of Canada (NRCC) managed and participated in the field studies.
Five of the examined ridges were grounded in coastal landfast ice and the remaining five ridges were embedded in the dynamic pack ice between Newfoundland and Quebec. The spatial coordinates of each site were recorded and measurements were made of the ridge surface topography, keel depth, ice mechanical strength, ice density and snow depth (Croasdale et al., 1999). Bulk physical properties such as the ice temperature and ice salinity were also measured, as reported in Johnston (1999). This report documents the microstructure of the ice cores extracted from five different ridges sampled during the field campaign.
3. WEST COAST NEWFOUNDLAND FIELD STUDY
The winter of 1998/99 was extremely mild off the West Coast of Newfoundland. Warm air temperatures resulted in light ice conditions in the northern part of the Gulf of St. Lawrence. Due to the light ice conditions and frequently inclement weather, only ten ridges were sampled during the two-week field program in March 1999. Table 1 lists the sampled ridge sites, numbered according to the date on which they were surveyed. Five of the ten ridges were grounded in coastal landfast ice and five ridges were floating in the dynamic pack ice, as shown in Table 1.
This report details the ice microstructure of five ice ridge sites (shaded in Table 1 and shown in Figure 1, circled in black). Two of these ridges, Site 3 and Site 12, were grounded in fast ice along the Newfoundland coast. The remaining three ridges (Site 7, Site 8 and Site 9) were floating in the dynamic pack ice between Newfoundland and Quebec. Level bay ice at Site 10 and lake ice at Site 11 were used for equipment testing (Figure 1). The microstructural details of level ice from Site 10 and Site 11 are presented in the Appendices.
Table 1 Ridges Sampled during the Field Project
Site Locale Latitude Sampled Ice Type
S11 St. Genevieve Bay 51°09N, 56°52W 09 March Grounded
Ridge
S2 Flower’s Cove 51°18.75N, 56°45.57W 10 March Grounded
Ridge
S3 Flower’s Cove 51°18.77N, 56°45.44W 11-16 March Grounded
Ridge
S4 Forteau Bay 51°25.73N, 56°53.17W 13 March Floating Ridge
S5 Isles aux Chiens 57°52.30N, 57°52.30W 13 March Grounded
Ridge
S6 Bradore Bay 51°18.76N, 57°17.77W 13 March Floating Ridge
S7 North Central Gulf 51°07.24N, 57°23.96W 15 March Floating Ridge
S8 North Central Gulf 51°18.98N, 57°00.76W 15 March Floating Ridge
S9 Outside Flower’s Cove 51°19.62N, 56°48.01W 15 March Floating Ridge
S121 Eddy’s Cove 51°25N, 56°28.8W 19 March Grounded
Ridge
S101 Plum Point 51°04N, 56°53W 18 March Level Bay Ice
S111 Otter Lake 51°04N, 56°53W 19 March Lake Ice
1
7 8 9 3 51 00 12 1011 Quebec Isles aux Chiens Blanc Sablon Eddy’s Cove Flower’s Cove Plum Point St. Genevieve Bay Newfoundland Strait of Belle Isle Northern Gulf of St. Lawrence
Figure 1 First year Ridges analyzed for Ice Microstructure 3.1 Macrostructure of Ridged Ice
First year ridges are formed when external driving forces cause individual ice floes to forcibly interact. The ridge building process results in a haphazard accumulation of ice blocks that extend above and below the waterline. Ridges classify either as shear ridges or compression ridges. Shear ridges occur when floes interact in shear by moving approximately parallel to their contacting edges. Frequently, shear ridges form when dynamic ice moves past landfast ice. In that case, the tangential force of the dynamic pack exceeds the force exerted perpendicular to the landfast ice. Shear ridges are composed of highly compacted granular ice blocks that are oriented in a long straight pile and normally has one vertical side along the initiating fracture plane (Gladwell, 1976). Compression ridges are the second type of ridge. Compression ridges, or pressure ridges, form when the contacting edges of the interacting floes collide at a larger angle than is characteristic of shear ridges. Depending upon the driving force and the ice strength, the floes may fail in bending (pushed under/over each other, resulting in rafted ice) or the floes may fail in compression. Pressure ridges usually have long, square-edged blocks, as opposed to the highly pulverized ice in shear ridges. The ridge sail (and keel) can have a jagged linear shape or may undulate between the opposing floes.
Usually, ridges are defined by their sail height (HS) and keel depth (HK), as shown in Figure 2. The total ice thickness of the ridge is the sum of the sail height and the keel depth, as shown by Equation 1.
K S
R H H
T = + (1)
where
TC = Total ice thickness HS = ridge sail height HK = ridge keel depth
Ridge crest T R Sail, H Keel, H S K
Figure 2 Ridge Macrostructure
Ridges can be subdivided into five different layers, (Gladwell, 1976). The ridge sail consists of loose rubble, between which extend either empty voids or snow filled cavities. The consolidated layer is a region of solid, competent ice that extends into the ridge keel, but can also extend into the ridge sail. The ridge keel is subdivided into three additional layers. There is the zone of frozen, porous ice, followed by the region of unconsolidated rubble beneath which extends a layer of slush.
3.2 Profiles of Ridge Surface/Bottom Topography
The surface topography of a ridge is measured by surveying along lines oriented perpendicular to the ridge crest. The bottom profile (or keel depth) of the ridge is measured with a mechanical auger (50 mm in diameter) along these survey lines. Ideally, enough measurements of the sail height and keel depth should be taken for a three dimensional representation of the ridge. This is not easy,
however, since the bottom profile of the ridge is usually determined by drilling through the full thickness of the ridge (a depth of 3 m, or more). Since this is time-consuming and exhausting, the ice thickness through the ridge crest was not measured during the West Coast Newfoundland field program. Rather, auger holes were drilled on either side of the ridge crest.
The jumbled array of ice blocks that comprise the ridge sail preserve different aspects of the history of the ridge formation. First, the sail blocks provide an indication of the floe thickness during ridge building. Sail blocks that have a fairly uniform thickness indicate that the ridge formed from the collision of two floes of similar thickness. The sail blocks can be used to infer the age of the ridge. Sail blocks that are considerably thinner than the surrounding level floes indicate an older ridge. The sail blocks reveal the ice microstructure of the floes, at the time of ridge building. The weathering process does not change the basic ice microstructure (grain size), but does result in sail blocks that are nearly devoid of brine and have increased ice porosity.
3.3 Consolidated Layer of Ridged Ice
In recently formed ridges, ice blocks in the sail and keel are loosely consolidated. As the ridge ages, the ridge solidifies as water in the block interstices freezes. The consolidated layer thickness is a direct measure of the solidity of the ridge. Figure 3 shows that the consolidated layer can extend from some distance in the ridge sail (above the waterline) into the ridge keel (below the waterline). The thickness of the consolidated layer, designated as TC, varies along the width (and length) of the ridge. A useful parameter by which to evaluate ridge consolidation is the consolidation ratio, as determined by the following equation,
C R T T CR = (2) where CR = Consolidation Ratio
TR = Total thickness of the ridge
Consolidated Layer voids T T R C
Figure 3 Simplified Illustration of the Consolidated Layer in Ridged Ice
The consolidated layer thickness is determined most accurately by profiling the mechanical strength of the ice with increasing depth. Mechanical strength profiles obtained with the borehole jack can be used to distinguish competent ice from ice that has minimal strength, as discussed subsequently. This is done using a borehole jack to measure the confined compressive strength of the ice. The confined compressive strength can not be related directly to the ice strength obtained from standard compression tests of unconfined samples. The borehole jack does provide, however, an index of ice strength.
During testing, the borehole jack is inserted into a 0.15 m diameter hole (made by the corer) and the end platen of the jack is extended until the ice fails. After the test is completed at one depth in the ice, the jack is lowered and the testing procedure continues. The top and bottom of the consolidated layer are defined as ice with appreciable strength. This definition of the consolidated layer excludes low strength ice in the sail and keel of the ridge.
Alternately, the thickness of the consolidated layer may be inferred from the resistance encountered during penetration of the ice with either a 50 mm diameter auger or a 0.15 m diameter corer. The mechanical auger is used to record the total ice thickness and the corer is used to extract ice cores. Both of these devices can be used to gauge the cutting resistance of the ice. In this report, the ice cutting resistance ranks from solid, competent “hard” ice to areas of no ice or “void” (Table 2 after Croasdale et al., 1999).
Table 2 Description of Ice During Mechanical Drilling
4 Hard Requires the application of pressure for good drill penetration.
Indicates solid ice.
3 Soft Requires no applied pressure to drill through the ice. Indicates
warm and weaker ice, but competent layers.
2 Ram Auger can be pushed down by ramming the drill into the hole.
Tightly compacted rubble or high porosity ice.
1 Push Very weak or loose rubble through which the auger can be pushed,
without ramming.
Gauging the consolidated layer thickness by the cutting resistance during ice penetration is, however, much more subjective than mechanical strength measurements. Since borehole jack tests, generally, were not conducted during the West Coast Newfoundland field program, the ice cutting resistance was used to determine the consolidated layer thickness in this report. The bottom of the
consolidated layer occurs at the top of the first void or the first area where the drill could be pushed (Croasdale et al., 1999). Small voids above or near
the waterline were included in the consolidated layer.
3.4 Extraction of Ice Cores from Ridged Ice off the West Coast of Newfoundland
Figure 4 shows that, typically, cores retrieved from the first year ridges off the West Coast of Newfoundland consisted of fragmented ice. The cores ranged in consistency from bands of solid ice to layers of highly porous, loosely bound ice. The depth of the fragmented core had to be determined from information gathered about the length of the core barrel (with respect to the ice surface) and the cutting resistance felt during the core extraction process. Consequently, there is some uncertainty in the correlation between the measured ice properties and their actual ice depth.
3.5 Cores Extracted for Temperature and Salinity Measurements
Cores were extracted from each ridge site to measure the temperature and salinity of the ice. After a core was retrieved, holes were drilled along its length, at as regular intervals as possible (considering the state of the fragmented ice cores). Since the ice was very soft, a gentle push of the drill, usually, was all that was required to make a hole in the ice. Immediately after the holes were drilled, the temperature was measured by inserting a thermal probe into the holes.
The salinity of the ice was measured on a separate core. That core was sectioned into 50 mm thick sections, roughly. The thick sections were double bagged (to prevent leakage) and brought to room temperature. The salinity of the melt water was measured with an electrical conductivity meter, calibrated in the laboratory at CHC/NRC.
3.6 Cores Extracted for Microstructural Studies
One core was retrieved from the ridge sites for future crystallographic work. That core was placed in a thermal cooler, packed with snow and stored in a walk-in freezer until completion of the field program. The cores were shipped to CHC/NRC, Ottawa at below freezing temperatures on a refrigerated, transport truck. Upon arrival in Ottawa, the cores were transferred to a deep freezer and inspected. The cores remained solidly packed with snow and showed no evidence of melt. They were repacked into the thermal coolers and stored at -10°C until ice crystallographic work was undertaken, several weeks later.
The ice microstructure was documented by preparing thin sections of ice (less than 1 mm thick) from the transported cores. The double microtoming technique (Sinha, 1977) was used to process two, full-thickness cores (Site 9, total depth 2.03 m and Site 12, total depth 1.36 m). The double microtoming method was also used to prepare thin sections from two sail blocks and core pieces from Site 3. One of the primary advantages of the double microtoming technique is that, since no heat is applied to the specimen, it preserves the ice crystal structure and the embedded inclusions (air, brine and a combination of both). Using the double microtoming technique is, however, a laborious process. Consequently, seven of the transported cores were processed (more expediently) with the hot-plate technique. Both the double microtoming technique and the hot-hot-plate technique were performed in a cold room temperature at –10°C.
4. FLOWER’S COVE, SITE 3
The first year ridge at Site 3 (51°18.7N, 56°45.4W) was located in a rubbled area of ice that was grounded in about 5.5 m of water near Flower’s Cove. The ridge, about 100 m long and about 3.8 m high, had relatively level ice floes on either side (Figure 5). Site 3 was investigated over a four-day period, during which time the surface topography was surveyed (11 March) and the total ice thickness and bulk ice properties were measured (14 to 16 March).
In addition to the standard suite of measurements noted above, the mechanical strength of the ridged ice at Site 3 was tested in situ with a borehole jack. Ice strength measurements were conducted in the slab of smooth ice north of the sampled ridge (Figure 5-a). In addition, four pull-up tests were conducted to measure the cohesive force of the ridged ice. The site for the pull-up tests was about 10 m from the ridge crest. The pull-up tests required cutting blocks of ice from the sheet ice and forcibly removing them until an ice failure plane was noted (for details see Croasdale et al., 1999). Figure 5-b shows the ice blocks from the four pull-up tests at Site 3.
(a) Site 3 (b) four ice blocks removed from Site 3
Figure 5 First year Ridge at Site 3 4.1 Sail Block Dimensions
A total of 39 sail blocks were measured at Site 3, most of which were about 0.30 m thick. The uniform thickness of the sail blocks indicates that the ridge most likely formed during a single ridging event between floes of equivalent thickness. Typically, block lengths at Site 3 ranged from 1 to 2 m and had a much more random size distribution than the block thickness.
4.2 Consolidated Layer Thickness, Site 3
Figure 6 shows profiles of the ice consolidation for Site 3. The ice cutting resistance during drill penetration ranked from “hard” ice (4) to “void” (0). The ice consolidation profiles were measured for three stations (each separated by a distance of 5 m) along one of the survey lines. The two holes drilled at Station 70 (a and b) were separated by a distance of 0.50 m. The station number increases with proximity to the ridge crest (Station 70 closer to crest than Station 60/65). A horizontal bar is used to show the freeboard at each station. The total thickness of the ridged ice is denoted as TC.
0 1 2 3 4 5 6 0 1 2 3 4 5 Ice Resistance Ic e D ep th ( m ) Station 70_b TC = 0.95 m W 0 1 2 3 4 5 6 0 1 2 3 4 5 Ice Resistance Ic e D ep th ( m ) Station 70_a TC =1.8 m W 0 1 2 3 4 5 6 0 1 2 3 4 5 Ice Resistance Ic e D ep th ( m ) Station 65 TC = 0.9 m W 0 1 2 3 4 5 6 0 1 2 3 4 5 Ice Resistance Ic e D ep th ( m ) Station 60 TC = 0.9 m W
Figure 6 Ice Consolidation Profiles for Site 3
Table 3 lists some of the ridge-related parameters for Site 3. The total ice thickness at Site 3 ranged from 2.0 to 5.0 m. The ice freeboard increases as the ridge crest is approached, as illustrated the comparison of Station 60 (0.35 m freeboard) and Station 70_b (0.52 m freeboard). The consolidated layer thickness at Site 3 varied from 0.9 to 1.8 m. The ratio of the consolidated layer thickness (TC) to the total ridge thickness (TR) was used to determine the consolidation ratio (CR) per equation (2). This consolidation ratio ranged from 0.2 to 0.5 for the examined areas of ridged ice.
Table 3 Ridge Parameters for Site 3, evaluated from Cutting Resistance
Station Total Ridge
Thickness, TR (m) Freeboard (m) Consolidated Layer Thickness, TC from cutting resistance (m) Consolidation Ratio (CR) Station 60 4.7 0.35 0.90 0.2 Station 65 2.0 0.42 0.90 0.5 Station 70_a 4.9 0.50 1.80 0.4 Station 70_b 5.0 0.52 0.95 0.2
The consolidated layer thickness also was determined at Station 65 and Station 70 by measuring the mechanical strength of the ice with a borehole jack (at depth intervals of 0.25 m). A threshold stress of 1 MPa was used to denote the bottom of the consolidated layer. Ice that had strength less than 1 MPa was considered unconsolidated. The borehole jack tests showed that the bottom of the consolidated layer corresponded to a depth of 0.9 m at Station 65 and a depth of 1.1 m at Station 70 (Croasdale et al., 1999). The consolidated layer thickness estimates from the borehole jack and the cutting resistance are the same for Station 65 (0.9 m) but different for Station 70 (1.1 m versus 1.8 m and 0.95 m, see Table 3).
4.3 Temperature, Salinity and Density of Ridged Ice from Site 3
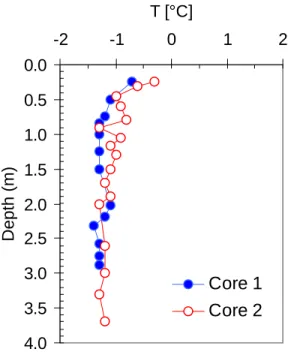
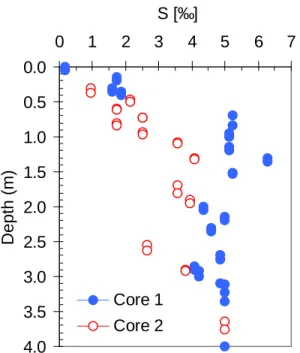
Two cores of ice, about 5 m apart, were extracted from the relatively level area of ice 10 m north of the ridge crest (Figure 5). Both were fragmented cores that needed to be pieced together. The ice temperature of the two cores ranged from –1.4°C to approximately 0°C (Figure 7). Since the upper 0.25 m of ice consisted of loosely consolidated snow ice that fell apart during handling, data are not available in the surface layer of Core 1 and Core 2. Figure 8 shows that the salinity of the uppermost metre of ice from the two cores ranged from 0.2 ‰ to less than 4 ‰ and then increased to about 6.3 ‰.
0.0 0.5 1.0 1.5 2.0 2.5 3.0 3.5 4.0 -2 -1 0 1 2 T [°C] Depth (m) Core 1 Core 2
0.0 0.5 1.0 1.5 2.0 2.5 3.0 3.5 4.0 0 1 2 3 4 5 6 7 S [‰] Depth (m) Core 1 Core 2
Figure 8 Salinity Profiles of Core 1 and Core 2, Site 3
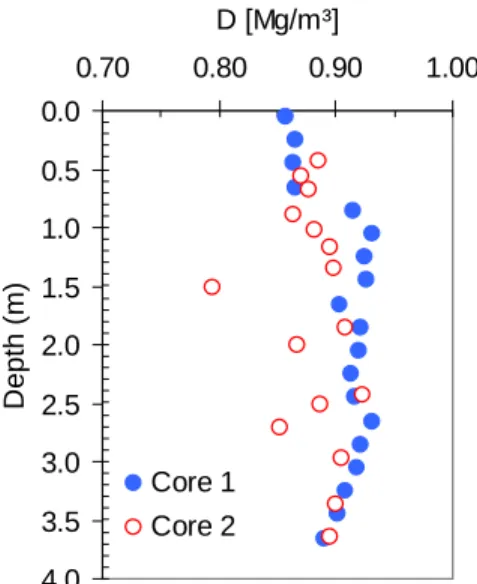
Site 3 is the only ridge site for which the ice density was measured. The density of the ice was measured using the submergence technique (Croasdale et al., 1999). Ice sections were submerged in a fluid of known density and the displaced volume and change in sample weight were measured. The density was calculated from the buoyant and fully submerged sample weight and volume. Ice density profiles were also obtained using the “bulk volume” technique, which required only the weight and dimensions of the core pieces. Ice density measurements from the bulk volume technique are, on average, about 3% lower than densities obtained using the submergence technique (Croasdale et al., 1999). This is to be expected, since the submergence technique yields a “saturated” density, compared with the “drained” density based upon only the sample weight and dimensions.
Figure 9 shows the density profiles for Core 1 and Core 2, measured using the submergence technique. The ice density from these two, ridged ice cores ranged from 0.85 to 0.93 Mg/m³ (with the exception of one sample, 0.79 Mg/m³). The average density of ridged ice from Site 3 was 0.88 Mg/m³.
0.0 0.5 1.0 1.5 2.0 2.5 3.0 3.5 4.0 0.70 0.80 0.90 1.00 D [Mg/m³] D epth ( m ) Core 1 Core 2
Figure 9 Ice Density Profiles of Site 3, using the Submergence Technique
4.4 Microstructure of Sail Block from Site 3
The ridge sail blocks preserve information about the floes that initially formed the ridge. Full-thickness remnants of ice were cut from two sail blocks at Site 3. One of the sail blocks had a thickness of 0.10 m and the other block had a thickness of 0.17 m. Thin sections from the 0.10 m thick sail block (prepared by double-microtoming) are included in this report. The vertical and horizontal sections prepared from the 0.17 m block were very similar to the 0.10 m thick block.
Figure 10 shows the vertical thin sections from the sail block, photographed under cross polarized light and parallel polarized light. The vertical section consisted of fairly large grains (up to 20 mm in length), with some granular ice. The same vertical section is shown under parallel polarized light in the adjacent figure. Viewing the section under parallel polarized light enhances the air inclusions. When the ridge formed, most of the inclusions were smaller and filled with brine, as typifies first year sea ice. The weathering process leached brine from the ice and produced the abundant air bubbles.
(a) Crossed polarized light (b) Parallel polarized light
Figure 10 Vertical Thin Section from Sail Block, Site 3
Figure 11 shows the horizontal thin section of the sail block under (a) crossed polarized light, (b) parallel polarized light and (c) crossed polarized light with side illumination. The horizontal section consisted of grains elongated parallel to the ice surface. Due to the large number of air bubbles, it is difficult to say whether the fine grained material (the lower left region of the section in Figure 11-a), in fact, is elongated columnar ice. Figure 11-c shows the horizontal section examined under cross polarized light, with side illumination. This lighting reveals the high porosity of the sail blocks.
(a) cross polarized light (b) parallel polarized
light
(c) cross polarized, with side light
4.5 Microstructure of Ridged Ice from Site 3
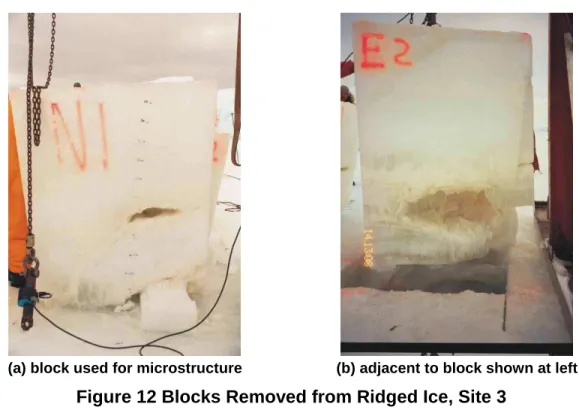
Figure 12 shows two blocks that were used in the pull-up tests. Both of the blocks contained large voids that drained their slush as they were hoisted. A full-thickness section was cut from the block labeled ‘N1’ (Figure 12-a) and was used later for crystallography.
(a) block used for microstructure (b) adjacent to block shown at left
Figure 12 Blocks Removed from Ridged Ice, Site 3
Table 4 lists the thin sections that were prepared from the one metre thick block that was cut from block N1. The vertical microstructure of the top metre of ice was documented using eight thin sections. Horizontal thin sections were prepared at eight ice depths. The vertical and horizontal thin sections were placed under a polariscope and photographed under both crossed polarized light and parallel polarized light.
Table 4 Prepared Thin Sections from Site 3
Vertical sections Description Illustrated
0 – 0.20 m freshwater and granular Figure 13
0.20 – 0.40 m granular
--0.40 – 0.50 m granular and tabular fragments
--0.50 – 0.67 m columnar Figure 14
0.67 – 0.85 m granular
--0.85 – 1.0 m granular, needles, columnar Figure 15
Horizontal sections Description Illustrated
0.05 m granular Figure 13 0.20 m granular --0.46 m granular --0.50 m columnar Figure 14 0.60 m granular/columnar --0.70 m granular/columnar --0.85 m granular/columnar
--0.90 m granular, some needles Figure 15
Table 4 indicates that the grain size at Site 3 varied with depth from granular to columnar. Figure 13-a shows the vertical thin section from the uppermost 0.40 m of ice. The uppermost 30 mm of ice was comprised of freshwater grains, with a diameter of about 5 mm. At a depth of 30 mm, a very fine-grained matrix of snow ice developed and extended to an ice depth of about 0.50 m (Figure 13-b).
(a) Vertical section, depth 0 to 0.20 m (b) Horizontal section, depth 0.50 m
Columnar grains developed at a depth of 0.50 m. Columnar grains are characteristic of ice that forms under uni-directional freezing conditions. The vertical section from 0.50 to 0.67 m (Figure 14-b) contained columnar grains with average lengths of 20 to 30 mm. Similarly, the horizontal section at a depth of 0.50 m contained randomly oriented columnar grains (about 10 mm wide) with jagged grain boundaries (Figure 14-b).
Figure 14-c shows the horizontal thin section from a depth of 0.50 m under parallel polarized light. At a depth of 0.50 m the ice from Site 3 contained many, large inclusions (average length of about 2 mm). It is difficult to state whether the inclusions shown in Figure 14-c are attributed to air or brine. The measured salinity at a depth of 0.50 m (3 to 4 ‰, Figure 8) implies that the inclusions are probably entrapped air (as opposed to brine inclusions).
(b) Horizontal section under crossed polarized light, depth 0.50 m
(a) Vertical section, depth 0.50 to 0.67 m (c) Horizontal section under parallel
polarized light, depth 0.50 m
Figure 15-a shows the vertical thin section (depths 0.87 to 0.99 m) that is from the area of ice adjacent to the large void shown in Figure 12-a. The vertical section and horizontal sections were comprised of mostly fine-grained ice. A few narrow columnar grains are evident in both sections, some of which have a length of about 10 mm (Figure 15-b).
(a) Vertical section, depth 0.87 to 0.99 m (b) Horizontal section, depth 0.90 m
5. NORTH CENTRAL GULF, SITE 7
The shear ridge at Site 7 (51°07.24, 57°23.96) had a clearly defined boundary between the level ice floe (in which the ridge was embedded) and the rougher ice beyond (Figure 16). The surface topography of Site 7 was measured along three survey lines, oriented perpendicular to the ridge crest. The shear ridge had a maximum sail height of about 1.6 m and a total ice thickness of 2.0 to 3.0 m.
(a) Aerial view (b) Surface topography
Figure 16 Aerial View and Surface Topography of Site 7
5.1 Sail Block Dimensions
A total of 26 sail blocks were measured at Site 7. About one third of the sail blocks were less than 0.15 m thick and less than 0.75 m long. It was speculated that thin and short sail blocks could be representative of shear ridges (Croasdale et al., 1999). This illustrates that shear ridges are associated with a high degree of compaction and pulverization.
5.2 Consolidated Layer Thickness, Site 7
Figure 17 shows the ice consolidation profiles at four different locations. Station 1 was located in relatively level ice close to the ridge and the three other stations were located in rougher ice near the survey lines (Croasdale et al., 1999). Recall that the ice cutting resistance ranges from “hard” ice (4) to “void” (0). The waterline is superimposed on the ice consolidation profiles (shown as horizontal bar).
The snow depth on the four stations at Site 7 was negligible. The uppermost 0.30 m of ice from Station 2, however, consisted of a layer of snow ice or candled ice. Since the surface layer of ice offered no resistance to drill penetration it qualified as a void. In comparison, the surface layer of the other stations was classified as hard ice (4).
0 1 2 3 4 5 6 0 1 2 3 4 5 Ice Resistance Ic e De pt h ( m ) Station 1, TC = 0.7 m W 0 1 2 3 4 5 6 0 1 2 3 4 5 Ice Resistance Ic e D ept h ( m ) Station 2, TC = 2.0 m W 0 1 2 3 4 5 6 0 1 2 3 4 5 Ice Resistance Ic e De pt h ( m ) Station 3, TC = 1.0 m W 0 1 2 3 4 5 6 0 1 2 3 4 5 Ice Resistance Ic e De pt h ( m ) Station 4, TC = 0.7 m W
Figure 17 Ice Consolidation Profiles for Site 7
Table 5 lists some of the ridge-related parameters for Site 7. The level ice at Station 1 had the least freeboard (0.3 m) and had a consolidated layer thickness of 0.7 m (Figure 17-a). One might expect that for level ice, the ice cutting resistance would be fairly constant with increasing depth. However, this is not the case. The consolidation profile from the “level” ice showed that ice adjacent to the crest was non-uniform.
Table 5 Ridge Parameters for Site 7, evaluated from Cutting Resistance
Station Feeboard (m) Total Ridge Thickness, TR (m) Consolidated Layer Thickness, TC from cutting resistance (m) Consolidation Ratio (CR) Station 1 0.30 2.0 0.7 0.4 Station 2 0.60 2.0 2.0 1.0 Station 3 0.49 3.0 1.0 0.3 Station 4 0.61 3.0 0.7 0.2
The total ice thickness for the various stations ranged from 2.0 to 3.0 m (Table 5). The consolidated layer thickness for those stations varied from 0.7 to 2.0 m. Using the above estimates, the consolidation ratio (CR) ranged from 0.2 to 1.0. The rough ice at Station 2 had a thicker consolidated layer than the level ice at Station 1.
5.3 Temperature and Salinity of Ridged Ice from Site 7
Figure 18 shows the temperature and salinity profiles of a core that was removed from the relatively level ice between survey Line 1 and Line 2. The ice temperature ranged from –2.5°C to –1.2°C. The salinity of the top 0.20 m of ice was 0 ‰ and steadily increased to 7.7 ‰, at a depth of 1.1 m. Below a depth of about one metre, the ice salinity ranged from 3 to 6 ‰.
0.0 0.2 0.4 0.6 0.8 1.0 1.2 1.4 1.6 1.8 -4 -2 0 2 4 6 8 10
Temperature (°C) and Salinity (‰)
Dept h ( m ) [‰] [°C] void void void
Figure 18 Ice Temperature and Salinity Profiles for Site 7
Figure 18 shows three measurable voids in the core that was retrieved for temperature and salinity measurements. A 50 mm long void occurred at a depth of 0.20 m and two larger voids occurred at a depths of 0.45 m (0.15 m long void) and 0.90 m (0.12 m long void).
5.4 Microstructure of Ridged Ice from Site 7
The core retrieved for crystallographic studies was in close proximity to the salinity/temperature core. The total length of core extracted for crystallographic work was about 1.3 m. Below a depth of about one metre, the ice consisted of very porous, soft ice. Core fragments were pieced together, allowing for the two 0.20 m voids noted during core extraction (at ice depths 0.40 m and 0.90 m). The thickness of solid core retrieved from Site 7 indicates a consolidated layer thickness of about 1 m. From this, it can also be inferred that the bottom of the
consolidated layer in the salinity/temperature core was probably associated with the second void (depth 0.90 m, Figure 18). These estimates are in agreement with average consolidated layer thickness obtained from the ice cutting resistance (Figure 17).
Table 6 lists the thin sections that were prepared from the upper 0.85 m of ice, and notes which sections are illustrated in the following figures. In general, the ridged ice at Site 7 consisted of predominantly granular ice, interspersed with bands of randomly oriented frazil ice.
Table 6 Prepared Thin Sections from Site 7
Vertical sections Description Illustrated
0 – 0.17 m freshwater; granular; frazil Figure 19
0.17 – 0.29 m granular; frazil; elongated frazil
--0.29 – 0.40 m granular; randomly oriented frazil Figure 20
0.40 – 0.54 m granular; randomly oriented frazil
--0.54 – 0.64 m granular; with occasional frazil
--0.64 – 0.85 m granular; with occasional frazil Figure 21
Horizontal sections Description Illustrated
0.03 m freshwater grains Figure 19
0.11 m granular
--0.39 m granular; frazil Figure 20
0.51 m granular; frazil
--0.70 m granular Figure 21
The thin sections in Figure 19 reveal that the first 30 mm of ice at Site 7 consisted of large grains of freshwater ice with an average diameter of 5 to 10 mm. Fine-grained snow ice developed at a depth of 30 mm and extended to a depth of 0.13 m. At that depth, frazil ice became established and extended to a depth of about 0.22 m (not shown).
(a) Vertical section, depth 0 to 0.17 m (b) Horizontal section, depth 0.03 m
Figure 19 Thin Sections from Site 7, depth 0 to 0.17 m
The vertical section that extends from 0.29 to 0.40 m provides a good example of the mixture of randomly oriented frazil and granular ice that characterized much of ridged ice core from Site 7 (Figure 20-a). This type of ice microstructure has been described as discontinuous columnar ice, typical of first year ice in the Beaufort Sea (Timco and Frederking, 1982). The horizontal section from a depth of 0.39 m was comprised of fine-grained material, with an occasional, large grain (width of about 10 mm, Figure 20-b).
(a) Vertical section, depth 0.29 to 0.40 m (b) Horizontal section, depth 0.39 m
Figure 21 shows the vertical section from a depth of 0.64 to 0.85 m. The vertical section and the associated horizontal section were comprised of very fine-grained material. Since this section was from a depth of about one metre, it can be used to characterize the consolidated layer. Figure 21 indicates that the fine-grained material extended to the bottom of the consolidated layer.
(a) Vertical section, depth 0.64 to 0.85 m (b) Horizontal section, depth 0.70 m
6. NORTH CENTRAL GULF, SITE 8
Site 8 was in the dynamic pack ice between Newfoundland and Quebec (51°18.98N, 57°00.76W). This 2.6 m high ridge was embedded in a small floe, as shown in Figure 22. The total ice thickness at two holes near the survey lines was 1.8 m and 3.0 m (Croasdale et al., 1999).
(a) Floe in which Site 8 was embedded (b) Surface topography of Site 8
Figure 22 Ridged Ice at Site 8
6.1 Sail Block Dimensions
A total of 26 sail blocks were measured at Site 8. Examination of the dimensions of the sail blocks revealed ice of relatively uniform thickness. Over half of the blocks were between 0.25 and 0.35 m thick.
6.2 Consolidated Layer Thickness, Site 8
The consolidation profiles for two holes near the survey lines are shown in Figure 23. Recall that the cutting resistance ranges from “hard” ice (4) to “void” (0). Since both stations were covered by a 0.25 m layer of snow, their uppermost surface qualifies as a void. The consolidation profiles for the ice below the snow cover do not reflect any measurable voids. This demonstrates that the consolidated layer of ice may not contain measurable voids. The ice freeboard at these two stations is not known.
0 1 2 3 4 5 6 0 1 2 3 4 5 Ice Resistance Ic e Dept h (m ) Station 1, TC = 1.5 m 0 1 2 3 4 5 6 0 1 2 3 4 5 Ice Resistance Ic e Dept h (m ) Station 2, TC = 1.1 m
Figure 23 Ice Consolidation Profiles for Site 8
Table 7 shows that the two stations had a total ice thickness of 1.8 m and 3.0 m. The corresponding consolidated layer thickness was 1.5 m and 1.1 m, respectively. The associated consolidation ratio (CR) for these two stations was 0.8 and 0.2.
Table 7 Ridge Parameters for Site 8, evaluated from Cutting Resistance
Station Total Ridge
Thickness, TR (m) Consolidated Layer Thickness, TC from cutting resistance (m) Consolidatio n Ratio (CR) Station 1 1.8 1.5 0.8 Station 2 3.0 1.1 0.2
6.3 Temperature and Salinity of Ridged Ice from Site 8
Although the consolidation profile of the ridged ice did not indicate any measurable voids, the nearby core that was retrieved for temperature and salinity profiles had numerous voids (Figure 24). Two of the voids were about 50 mm long (at depth 0.30 m and 0.95 m) and the third void was about 0.15 m long (at depth 0.45 m). The fourth and largest void (about 0.30 m long) occurred at a depth of 1.30 m.
Temperature measurements showed that the ice ranged from near 0°C at the surface to –1.4°C at a depth of 1.85 m. The ice salinity increased from near 0 ‰ (uppermost 0.15 m) to a maximum of 6.5 ‰ (at a depth of 1.05 m), with an average of 3.7 ‰. Below about one metre, the ice salinity varied from 3.8 ‰ to 5.2 ‰ before it increased to 6.3 ‰, in the bottom 50 mm of ice.
0.0 0.5 1.0 1.5 2.0 2.5 -2 0 2 4 6 8
Temperature (°C) and Salinity (‰)
Dept h (m) [‰] [°C] void void voids
Figure 24 Ice Temperature and Salinity Profiles for Site 8
6.4 Microstructure of Ridged Ice from Site 8
The metre-long core used for crystallographic studies consisted of numerous ice fragments (Figure 25). The ice thin sections that were prepared for Site 8 are listed in Table 8. The ice microstructure showed predominantly granular ice, interspersed with frazil particles of varying sizes and shapes.
Figure 25 Core retained for Crystallographic Studies of Site 8
Table 8 Prepared Thin Sections from Site 8
Vertical sections Description Illustrated
0 – 0.19 m freshwater; frazil Figure 26
0.19 – 0.36 m fine grained frazil; granular
--0.36 – 0.44 m fine grained frazil with a few ice needles
--0.44 – 0.60 m very fine grained with a few needles Figure 26
0.60 – 0.75 m fine grained; needles; coarse frazil Figure 27
0.75 – 0.90 m coarse frazil Figure 28
0.90 – 1.02 m frazil; granular
Horizontal sections Description Illustrated
0.50 m very fine grained/granular
--0.70 m oriented frazil Figure 27
0.80 m coarse, elongated frazil particles Figure 28
0.90 m very fine grained/granular
--Error! Reference source not found.Figure 26 shows two vertical ice thin
sections from Site 8. The surface of the ice contained a 30 mm thick layer of freshwater crystals with an average size of about 5 mm (Figure 26). Ice in the remainder of the vertical section consisted of relatively small grains, with an average diameter of 10 to 50 mm. In comparison, the vertical section from depths 0.44 to 0.60 m contained very fine-grained ice (less than 1 mm in diameter), with evidence of occasional elongated frazil particles (Figure 26-b).
(a) 0 to 0.19 m (b) 0.44 to 0.60 m
Figure 26 Two Vertical Sections from Site 8
The vertical thin section from depths 0.60 to 0.75 m was comprised of a combination of fine grains, ice needles and coarse frazil (Figure 27-a). The region of coarse, frazil particles in the vertical section was also evident in the horizontal section from a depth of 0.70 m (Figure 27-b). This horizontal section can be described as oriented frazil, as noted by the large area of grains with similar dark tones (grains in the extinct position under crossed polarized light). Oriented frazil frequently occurs when ice particles are “lined up” by the wind or current action, such that the adjacent particles have the same orientation.
(a) Vertical section, depth 0.60 to 0.75 m (b) Horizontal section, depth 0.70 m
Figure 28 shows the vertical section from a depth of 0.75 to 0.90 m with a horizontal section from a depth of 0.80 m. The sections classified as coarse frazil, elongated slightly in the vertical and horizontal planes. In comparison, the thin section from 0.90 to 1.02 m contained mostly fine-grained material, as mentioned in Table 8. The fine-grained material was associated with the bottom of the consolidated layer, which extended to a depth of 1.0 to 1.5 m.
(a) Vertical section, depth 0.75 to 0.90 m (b) Horizontal section, depth 0.80 m
7. FLOWER’S COVE, SITE 9
Site 9 was situated in the dynamic pack ice (51°19.62N, 56°48.01W) outside Flower’s Cove. The 1.5 m high ridge was embedded in a small, weathered floe about 50 m in diameter (Figure 29). The ridge surface topography was surveyed across three lines, oriented perpendicular to the ridge crest.
Site 9
Figure 29 Aerial perspective of Site 9
7.1 Sail Block Dimensions
A total of 41 sail blocks were measured at Site 9. The blocks at Site 9 were within a narrow range of the average block thickness of 0.20 m. The block length to thickness ratio averaged about 5.5 (Croasdale et al., 1999).
7.2 Consolidated Layer Thickness, Site 9
Figure 30 shows the ice consolidation profile for the only station where the total ice thickness and the consolidated layer thickness were measured. Recall that the ice cutting resistance ranges from “hard” ice (4) to “void” (0). The total ice thickness at that station was 3.0 m and the consolidated layer was 1.7 m thick. As with the ridge at Site 8, the consolidation profile does not show any significant voids. The consolidation ratio (CR) was 0.6. The ice freeboard at this hole was not measured.
0 1 2 3 4 5 6 0 1 2 3 4 5 Ice Resistance Ic e D ept h (m ) Station 1, TC = 1.7 m
Figure 30 Ice Consolidation Profile at Site 9 7.3 Temperature and Salinity of Ridged Ice from Site 9
The ice temperature at Site 9 ranged from near 0°C at the surface to –1.5°C at a depth of 1.75 m (Figure 31). The ice salinity increased from near 0 ‰ in the surface layer of ice to a maximum of 6.0 ‰, at a depth of 0.80 m. The average salinity of the examined ice core was 3.6 ‰. Below the consolidated layer, the ice salinity varied from about 2 ‰ to 5 ‰. The ice salinity decreased to 1 ‰ in the bottom 50 mm of ice.
0.0 0.2 0.4 0.6 0.8 1.0 1.2 1.4 1.6 1.8 2.0 -2 0 2 4 6 8
Temperature (°C) and Salinity (‰)
Dept
h (m
)
[‰] [°C]
7.4 Microstructure of Ridged Ice from Site 9
The core retrieved from Site 9 for crystallographic studies was about 2.03 m long (Figure 32). The core from Site 9 was the longest core retrieved from the five examined ridge sites during the West Coast Newfoundland field program. Vertical ice thin sections were prepared throughout the full-thickness of the core and horizontal sections were prepared at selected ice depths (Table 7).
Figure 32 Core Retrieved from Site 9 for Crystallographic Studies Table 9 Prepared Thin Sections from Site 9
Vertical sections Description Illustrated
0 – 0.21 m freshwater grains; coarse frazil; elongated frazil Figure 33
0.21 –0.37 m elongated frazil; narrow columnar grains Figure 33
0.37 – 0.45 m elongated frazil; narrow columnar grains
--0.45 – 0.66 m granular intrusions; narrow columnar grains Figure 34
0.66 – 0.74 m granular; coarse frazil
--0.74 – 0.94 m narrow columnar; granular intrusion; coarse frazil
--0.94 – 1.03 m narrow columnar; granular
--1.03 – 1.23 m narrow columnar; granular intrusions Figure 34
1.23 – 1.42 m coarse frazil; granular
--1.42 – 1.55 m aligned, narrow columns; granular Figure 36
1.60 – 1.75 m granular; elongated frazil
--1.75 – 1.91 m granular; elongated frazil
--1.91 – 2.03 m granular
--Horizontal sections Description Illustrated
0.30 m aligned, narrow columns; very coarse frazil
--0.55 m narrow columnar grains Figure 35
1.12 m aligned, elongated frazil
--1.17 m granular Figure 35
1.45 m granular; coarse frazil Figure 36
--Figure 33 presents two vertical sections from Site 9, prepared from the uppermost 0.32 m of ice. The first 30 mm of the ice surface was comprised of a layer of freshwater ice, similar to the thin freshwater layer of ice observed at the three previous ridge sites. The remainder of the section contained coarse and/or elongated frazil particles that were aligned roughly 45° to the ice surface (Figure 33-a).
The vertical section from 0.16 to 0.32 m had two distinctly different regions of ice at right angles to one another (Figure 33-b). The uppermost layer of ice consisted of coarse particles of frazil ice, elongated parallel to the ice surface. The lower half of the vertical section contained narrow columnar grains (about 10 to 20 mm long) that were oriented perpendicular to the ice surface. A dark band of ice (oriented 45° to the ice surface) separated the two different layers of ice.
(a) Vertical section, depth 0 to 0.16 m (b) Vertical section, depth 0.16 to 0.32 m
Figure 33 Vertical Sections from Surface Layer of Site 9
The vertical sections from depths 0.45 to 0.66 m and 1.03 to 1.23 m provide an excellent example of what is known as discontinuous columnar ice (Figure 34). It is interesting to note the distinct contrast between the granular ice and the elongated columns in these two vertical thin sections. Although both sections contained elongated grains, they mostly consisted of granular ice.
(a) Vertical section, depth 0.45 to 0.66 m (b) Vertical section, depth 1.03 to 1.23 m
Figure 34 Vertical Sections from Site 9
Figure 35 shows the two horizontal thin sections that correspond to each of the vertical sections presented in the previous figure. The horizontal section from a depth of 0.55 m was associated with the region of elongated columnar grained ice in the vertical section (halfway down the section, depth 0.45 to 0.66 m). The horizontal section from that depth (0.55 m) was comprised of predominantly elongated grains that were directionally aligned, with a preferential orientation. In contrast, the horizontal section from depth 1.17 m consisted of a fine-grained matrix with a uniform distribution of fine grains.
(a) Horizontal section, depth 0.55 m (b) Horizontal section, depth 1.17 m
The thin section from depths of 1.43 to 1.55 m is shown in Figure 36-a. The top half of the vertical section was comprised of well-defined, elongated columns that were aligned perpendicular to the ice surface. Ice in the lower half of the section consisted of granular ice. The horizontal section at a depth of 1.45 m is shown under crossed polarized light (Figure b) and parallel polarized light (Figure 36-c). There is a region of ice in the middle of the section that did not have any inclusions (region in yellow box). Also, the grain boundaries in that region were quite regular and smooth, as opposed to the ragged grain boundaries normally associated with saline ice. The region of ice within the yellow box was classified as a “lens” of freshwater ice that extended through the section. The lens had a microstructure that was visibly different than the surrounding ice.
(b) Horizontal section, depth 1.45 m
1.45 m
(a) Vertical section, depth 1.43 to 1.55 m (b) Horizontal section, depth 1.45 m
8. EDDY’S COVE, SITE 12
Site 12 was located within walking distance of the shoreline (about 200 m) outside the community of Eddy’s Cove (51°25N, 56°28.8W). The ridge at Site 12 was 2.5 m high and was grounded in 5 m of water (Figure 37). Sail blocks were from 0.20 to 0.50 m thick and about 1.0 to 3.5 m long.
Figure 37 Ridged Ice at Site 12
8.1 Consolidated Layer Thickness, Site 12
The ice consolidation profile was determined for Site 12 by conducting borehole jack tests, at depth intervals of 0.25 m. Figure 38 shows the ice consolidation profiles for three stations at Site 12. The maximum confined, compressive stress in the ice was 10 MPa, which occurred at a depth of about 0.5 m at the three stations. By the next depth interval, 0.75 m, the compressive strength of the ice had decreased considerably (from 2 to 4 MPa). By defining the consolidated layer as ice greater than 1 MPa strength (Croasdale et al., 1999), the consolidated layer thickness at the three holes ranged from 1.7 to 2.1 m. Since the total ice thickness of the ridge was not measured, the consolidation ratio can not be calculated for Site 12. No information about the ice cutting resistance is available for Site 12.
0.0 0.5 1.0 1.5 2.0 2.5 3.0 3.5 0 4 8 12 Crushing Pressure (MPa)
Ic e D ept h ( m ) Station 1, TC = 1.9 m 0.0 0.5 1.0 1.5 2.0 2.5 3.0 3.5 0 4 8 12 Crushing Pressure (MPa)
Ic e D ept h ( m ) Station 2, TC = 2.1 m 0.0 0.5 1.0 1.5 2.0 2.5 3.0 3.5 0 4 8 12 Crushing Pressure (MPa)
Ic e D ept h ( m ) Station 3, TC = 1.7 m
Figure 38 Mechanical Strength Profiles for Ridged Ice, Site 12
8.2 Temperature and Salinity of Ridged Ice from Site 12
Figure 39 shows the ice temperature and salinity profiles from Site 12. The ice temperature was consistently near 0°C throughout the entire 1.4 m thick core. It is not surprising then, that the low temperature of the ice resulted in a substantial amount of brine drainage. The salinity throughout the uppermost 0.80 m is negligible. Given the high temperature of the ice, it is not surprising that the uppermost 0.80 m of ice was devoid of brine. At a depth of 0.80 m, there is a slight increase in salinity to about 1 ‰. Below a depth of 1.15 m, the salinity was measured only at depths 1.35 m and 1.50 m. Ice at a depth of 1.35 m had a salinity of 3.3 ‰, the highest measured salinity in the core. The salinity decreased at a depth of 1.5 m was slightly less, 2.7 ‰.
0.0 0.2 0.4 0.6 0.8 1.0 1.2 1.4 1.6 -2 0 2 4
Temperature (°C) and Salinity (‰)
Depth (
m
)
[‰] [°C]
8.3 Microstructure of Ridged Ice from Site 12
A 1.36 m long fragmented core was extracted from Site 12 for crystallographic studies. The prepared thin sections are listed in Table 10. The microstructure of the loosely consolidated ice could be accurately documented only by using the double microtoming technique. It was found that the hot-plate technique caused the loosely bound, ice grains to fuse; individual grains could no longer be identified. Since the double microtoming method does not require the application of heat, it was used to prepare thin sections from the ridged ice at Site 12. Due to the fragile nature of the core, parts of the thin section would frequently crack and break off when the section was being microtomed. The description of those sections is denoted by a question mark, as shown in Table 10.
Table 10 Prepared Thin Sections from Site 12
Vertical sections Description Illustrated
0 – 0.16 m freshwater ice; coarse granular ice Figure 40
0.16 – 0.36 m coarse frazil; elongated grains
--0.36 – 0.56 m granular; coarse frazil; elongated grains Figure 41
0.56 – 0.76 m granular; coarse frazil; elongated grains
--0.76 – 0.83 m elongated columns? Figure 42
0.83 – 1.00 m granular; elongated columns
--1.00 – 1.07 m elongated columns?
--1.07 – 1.13 m elongated columns? Figure 42
1.13 – 1.29 m unable to prepare thin section
--1.29 – 1.36 m unable to prepare thin section
--Horizontal sections Description Illustrated
0.02 m freshwater ice; granular Figure 40
0.13 m granular
--0.44 m columnar grains Figure 41
0.51 m granular
--0.96 m columnar grains
--1.23 m columnar grains?
--The vertical thin section of ice from the uppermost 0.16 m is shown in Figure 40. That vertical section consisted of a 40 mm thick layer of freshwater ice. A horizontal section was prepared from the layer of freshwater ice, (depth of 20 mm, Figure 40-b). The horizontal section showed that the surface layer of ice had a wide range of grain sizes.
(a) Vertical section, depth 0 to 0.16 m (b) Horizontal section, depth 20 mm
Figure 40 Thin Sections from Site 12, depth 0 to 0.16 m
Figure 41-a shows distinct bands of ice in the vertical section from 0.36 to 0.56 m. This type of banded structure is commonly observed in discontinuous columnar ice (Timco and Frederking, 1982). The horizontal section that was prepared at a depth of 0.44 m showed large columnar grains with numerous, large inclusions. Since the ice at depth of 0.44 m had negligible ice salinity (Figure 39), the inclusions are most probably air inclusions (as opposed to brine inclusions). In the right half of the section, the bubbles mask the large, columnar grains.
(a) Vertical section, depth 0.36 to 0.56 m (b) Horizontal section, depth 0.44 m
It was difficult to prepare thin sections of the fragmented ice towards the bottom of the core. Figure 42 shows two thin sections from depths 0.76 to 0.83 m and from depths 1.03 to 1.13 m. The microtoming process substantially increased the initial size of the voids, which is why the thin sections had large holes. The voids, in themselves, illustrate the poor consolidation and high porosity of ice in the bottom of the consolidated layer.
(a) depth 0.76 to 0.83 m (b) depth1.03 to 1.13 m
9. DISCUSSION
Table 11 presents a summary of the measured properties of the five ridges sampled during the West Coast Newfoundland program. The sail height of the first year ridges ranged from 1.5 to 3.8 m. The total ice thickness (the sum of the sail height and keel depth) ranged from 1.8 to 5.0 m. Typically, the thickness of the ridge sail blocks varied from 0.15 to 0.35 m.
Table 11 Summary of Measured Ridge Properties
Property Site 3 Site 7 Site 8 Site 9 Site 12
Ridge Height (m) 3.8 1.6 2.6 1.5 2.5
Typical Sail Block Thickness (m) 0.30 0.15 0.30 0.20 0.35 Total Ice Thickness (m) 2.0 to 5.0 2.0 to 3.0 1.8 to 3.0 3.0 --Consolidated Layer Thickness (m) 0.9 to 1.81 0.7 to 2.0 1.1 to 1.5 1.7 1.7 to 2.12 Consolidation Ratio 0.2 to 0.5 0.3 to 0.7 0.6 to 0.8 0.6 --Temperature (°C) -1.4 to 0 -2.5 to –1.2 -1.4 to 0 -1.5 to 0 0 Salinity Range (‰) 0 to 6.3 0 to 7.7 0 to 6.5 0 to 6.0 0 to 3.3 Average Salinity (‰) 4.1 4.1 3.7 3.6 0.4 Ice Density (Mg/m³) 0.85 to 0.93 -- -- -- --Microstructure Core Thickness (m) 1.0 0.85 1.02 2.03 1.36 1
consolidated layer thickness estimates from both ice cutting resistance and borehole jack tests
2
consolidated layer thickness obtained from borehole jack tests only
9.1 Consolidated Layer Thickness
Profiles of consolidated layer thickness for each site were generally obtained from the ice cutting resistance encountered as the auger penetrated the ice. The consolidated layer thickness at Site 3 and Site 12 was estimated from ice strength profiles measured with the borehole jack. With the borehole jack tests, the bottom of the consolidated layer was taken as the depth at which the ice strength was less than 1 MPa. When the ice cutting resistance and the mechanical strength profiles were both used to estimate the consolidated layer thickness there was less than 50 mm difference between them.
The consolidated layer thickness of the ridges off West Coast Newfoundland ranged from 0.7 to 2.1 m. Note that Site 12 was characterized by the thickest consolidated layer (2.1 m). It is interesting to note that, in general, Site 12 also had the thickest sail blocks (0.35 m). The relation between the thickness of the
consolidated layer and the sail blocks is not a simple one, given the complexity of the formation and evolution of ridges. Some recently formed, first year ridges in the Arctic have a thicker consolidated layer than the older ridges (McGonigal, 1978). The thickness of the consolidated layer is not simply dependent upon the age of the ridge. Various factors that affect ridge consolidation include the initial floe thickness (and block size), the air/ice/water temperature and repeated rafting over the developing ridge, to name a few.
The consolidation ratio was used to quantify the extent of ridge consolidation. The consolidation ratio was a bulk, dimensionless quantity that was used to describe the depth of ridge consolidation compared to the total ice thickness. Table 11 shows that the consolidation ratio for the five sampled ridges varied from 0.2 to 0.8. The range of consolidation ratios observed in West Coast Newfoundland is confirmed by similar measurements by Gladwell (1976) and McGonigal (1978). No attempt was made, during the West Coast Newfoundland study, to quantify the constitution of the ice in the consolidated layer. That is a property that could be addressed by determining the void ratio, or the number and size of the voids in the consolidated layer.
Borehole jack tests indicated that the maximum, confined compressive strength of the ridged ice at Site 3 and Site 12 was 11 MPa and 10 MPa respectively. For comparison, the confined compressive strength of first year, Arctic ridges (in April and early May) ranged from 14 MPa to 20 MPa (McGonigal, 1978). In most cases, the ultimate confined compressive strength of the Arctic ridges decreased from about 17 MPa in the top of the refrozen layer to about zero, at the bottom of the refrozen layer. A similar trend in the strength profile was noted in the ridges off the West Coast of Newfoundland. McGonigal (1978) also reports that the compressive strength of the adjacent, undeformed ice sheet compare well with the top part of the refrozen keel.
9.2 Temperature and Salinity Profiles of Ridged Ice
First year ridges off West Coast Newfoundland consistently showed ice temperatures near 0°C in the surface layer of ice and slightly lower temperatures in the bulk layer of ice. The coldest ice temperature that was measured during the field program was –2.5oC. The fact that the ridged ice was characterized by near melting temperatures indicates that the sites were temperate ridges in a deteriorated state.
In each of the five examined ridges, the uppermost 0.20 m of ice had negligible salinity. The average salinity in the bulk of the ice, however, ranged from 3.6 to 4.1 ‰, with the maximum observed salinity of 6 ‰. The salinity of first year ridges off the West Coast of Newfoundland is within the limits of the salinity of cold first year ridges in the Arctic (0 to 7 ‰, after Kovacs and Mellor, 1971;
Gladwell, 1976; McGonigal, 1978). In comparison, the average salinity in the bulk layer of level, first year ice in the Arctic ranges from 4 to 6 ‰ (Nakawo and Sinha, 1981). It is expected that the warm temperatures and deteriorated state of the ice effected a decrease in the salinity of the ridges (compared to their salinity when formed initially).
Frequently, the salinity of the ridges off the West Coast of Newfoundland decreased towards the bottom of the ice. The observed trend is very unusual. Due to the accumulation of drained brine from the overlying layers of ice, one would expect the ice salinity to increase towards the ice bottom. The increased salinity of bottom ice is observed in cold, first year sea ice (Nakawo and Sinha, 1981) and some Arctic first year, ridge cores (Kovacs and Mellor, 1971; Gladwell, 1976; McGonigal, 1978). The observed decrease in salinity, at the bottom of some ridge cores from the West Coast of Newfoundland, may be explained by brine drainage during core extraction. The mild air/ice temperatures would have accelerated brine drainage. It is also possible that the decrease in salinity at the bottom of the ridged ice is not actually bottom ice, since the core fragments may not have been retrieved entirely from the core hole.
The salinity profiles of ridged ice off West Coast Newfoundland reveal variations that appear as discrete layers (aside from the size of the ice disks melted for salinity measurements). The ice salinity profile of Site 8 can be broken down into 0.10 to 0.40 m thick layers. The typical sail block thickness for Site 8 was about 0.30 m. The discrete salinity layers may be directly related to the individual blocks that were rafted/ridged during ridge formation.
In comparison to the other sites, the ridged ice from Site 12 was anomalous in that it had negligible salinity in the uppermost 0.80 m (as opposed to the uppermost tens of millimeters). The absence of brine from the ridged ice at Site 12 and the extent of its consolidated layer (as well as sail block thickness) imply that Site 12 was probably the oldest and most weathered of the examined ridges. This would explain the negligible salinity in the uppermost metre of ice.
The density of ridged ice was measured only at Site 3. The density of ridged ice
(using submergence technique) ranged from 0.85 to 0.93 Mg/m3. These
estimates are similar to the 0.89 Mg/m3 density given for first year ridges in the Arctic (Gladwell, 1976). The density of ridged ice is within the range of densities for first year ice, above the waterline, 0.84 to 0.94 Mg/m³ (Timco and Frederking, 1996). Level first year ice that is below the waterline, however, typically has a density between 0.90 and 0.94 Mg/m³. Ridged ice has a lower density than level, first year ice below the waterline.
Vertical and horizontal thin sections at Site 3 were prepared from two sail blocks (0.10 m thick and 0.17 m thick). Thin sections from the blocks revealed well-defined, columnar grained ice with a high porosity. In comparison, thin sections from the consolidated layer revealed an agglomeration of granular and columnar ice. There was a predominance of very fine-grained ice at all levels in the consolidated layer. Granular ice also comprises a large portion of ridged ice in the Arctic (Nadreau, 1976; Cox et al., 1984,1985). Frequently, the consolidated layer of ice classified as discontinuous columnar, as shown by the alternate regions of granular and columnar grained ice.
Figure 43 shows two vertical thin sections of the consolidated layer from Site 9. The ice consists of discrete regions of ice that have entirely different microstructures. The discrete regions appear to have different orientations (as shown by the yellow lines in Figure 43). Regions 1, 3, 4 and 5 have a significant amount of granular ice. Cox et al., 1984 states that granular ice can result from the following processes:
• superimposed snow ice
• accumulation of frazil particles
• pulverization of the sheet ice during the ridge formation
• freezing of snow and slush in the voids
Most probably, the granular ice in the West Newfoundland cores corresponds to either superimposed ice from the parent ice sheet or ice recently formed during ridge consolidation. 1 3 5 2 4 1 3 2
(a) depth 0.45 to 0.66 m (b) depth 1.03 to 1.23 m