1
Supplementary information for
Trithiocarbonate-functionalized PNiPAAm-based nanocomposites for
antimicrobial properties
Milène Tana, Lenke Horvàtha, Priscilla S. Brunettoa, Katharina M. Fromma*
a
University of Fribourg, Department of Chemistry, Chemin du Musée, 9. 1700 Fribourg, Switzerland. E-mail: [email protected]
Table of contents
1\ Structural characterization of the polymers and the nanocomposites
1.1
1H-NMR-spectra of the poly(N-isopropylacrylamide)’s……….S1-4
1.2 FT-IR spectra of the nanocomposites B, C and D………..S5-7
1.3 UV-Vis spectra of the nanocomposites with the ratio (3)………S8
1.4 Thermoreversible behavior studied by UV-vis upon heating-cooling cycles………S9-11
1.4 X-ray diffractogram of the polymer B and the nanocomposites………..S12
1.5 TEM micrographs of the polymer B, C, D and the nanocomposites………S13-15
2\ Thermal properties
2.1 TGA curves of the polymers B, C and D and the nanocomposites………S16-18
2.2 DSC traces of the polymers B, C and D and the nanocomposites……….S19-21
2.3 LCST behaviors of the polymers B and C and the nanocomposites………S22
3\ Stability studies
3.1 For all the nanocomposites the ratio (3) and (4) inH
2O………..S23-24
3.2 For the polymers B and C with the ratio (3) in PBS……….S25
4\ Release kinetics
4.1. Silver release profile of nanocomposite B and C………...S26-27
4.2. Silver release profile of nanocomposite A, B, C and D………...S28-31
5\ Antimicrobial properties for the polymers
5.1. Killing curves of the nanocomposite B and C with E. coli ………...…S32-33
5.2. Killing curves of the nanocomposite B and C with S. aureus………..…S34-35
2
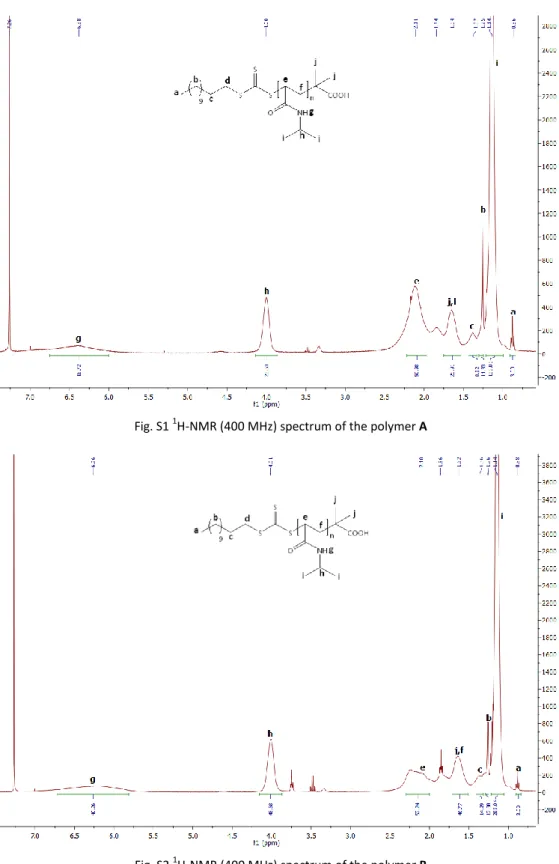
Fig. S1 1H-NMR (400 MHz) spectrum of the polymer A
3
Fig. S3 1H-NMR (400 MHz) spectrum of the polymer C
4
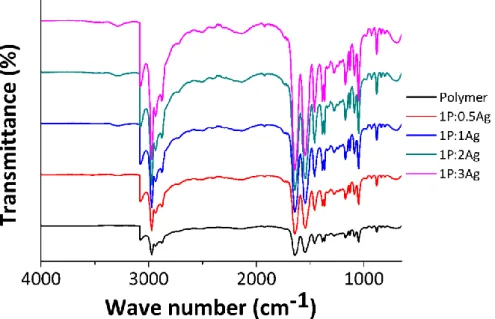
Fig. S5: FT-IR spectra of the polymer B and the nancomposites
5
Fig. S7 : FT-IR spectra of the polymer D and the nancomposites
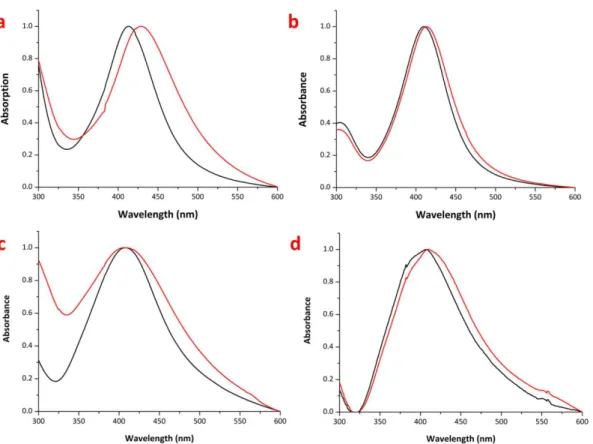
Fig. S8: UV-vis spectra of the nanocomposites a) polymer A, b) polymer B, c) polymer C, d) polymer D with the ratio (3) at RT (black) and 37 °C (red)
a
b
6
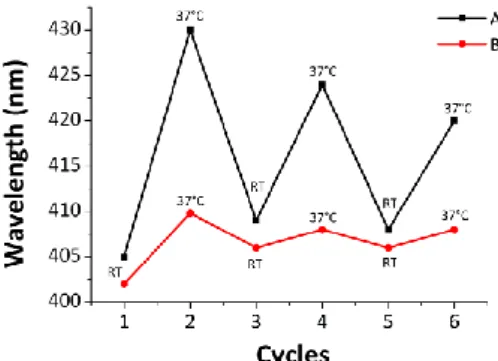
Fig. S9 Thermoreversible behavior studied by UV-vis for the polymer B with the ratios (3) (A) and (4) (B)
Fig. S10Thermoreversible behavior studied by UV-vis for the polymer C with the ratios (3) (A) and (4) (B)
7
Fig. S12 X-ray diffractogram of the polymer B and the nanocomposites
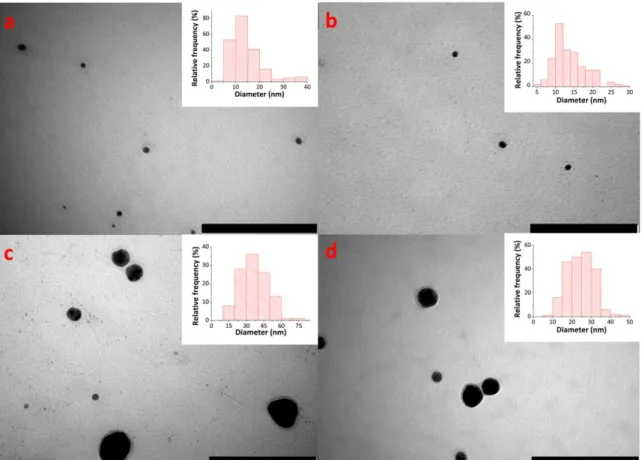
Fig. S13 TEM micrographs and distribution of the nanoparticles for the nanocomposites B with the different ratios (1) (a) (203 NPs), (2) (b) (208 NPs), (3)(c) (113 NPs), (4) (d) (216 NPs).
8
Fig. S14 TEM micrographs and distribution of the nanoparticles for the nanocomposites C with the different ratios (1) (a) (205 NPs), (2) (b) (105 NPs), (3)(c) (156 NPs), (4) (d) (143 NPs)
Fig. S15 TEM micrographs and distribution of the nanoparticles for the nanocomposites D with the different ratios (1) (a) (182 NPs), (2) (b) (174 NPs), (3)(c) (108 NPs), (4) (d) (148 NPs).
9
Fig. S16 TGA traces of the polymer B and the nanocomposites
10
Fig. S18 TGA traces of the polymer D and the nanocomposites
11
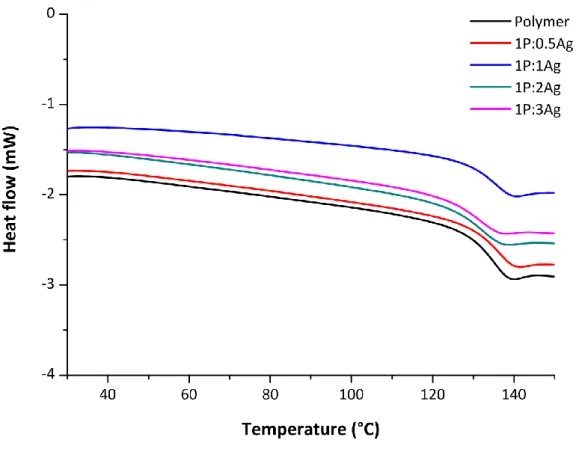
Fig. S20 DSC curves of the polymer C and the nanocomposites
12
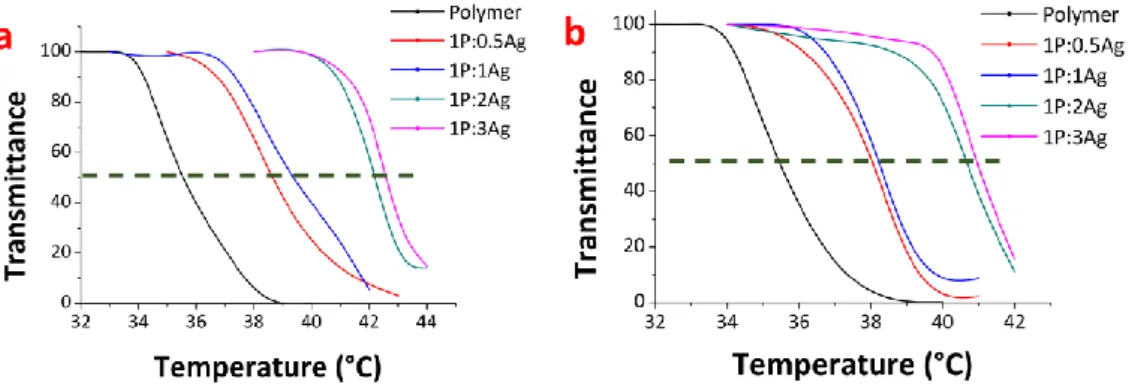
Fig. S22 LCST behaviors of the polymer and the nanocomposites B (left) and C (right)
13
Fig. S24 Stability studies for polymer C (up) and D (down) with the ratio (2) (a, c) and (3) (b, d) in H2O
14
Fig. S26 Ag+ release kinetics of the nanocomposites B at RT (left) and at 37 °C (right)
Fig. S27 Ag+ release kinetics of the nanocomposites C at RT (left) and at 37 °C (right)
Fig. S28 Ag+ release kinetics of the nanocomposites A at RT (left) and at 37 °C (right)
15
Fig. S30 Ag+ release kinetics of the nanocomposites C at RT (left) and at 37 °C (right)
16
Fig. S32 Growth curves of the nanocomposites B with the different ratios (1) (a), (2) (b), (3) (c), (4) (d) at various concentrations against E. Coli
Fig. S33 Growth curves of the nanocomposites C with the different ratios (1) (a) (2) (b), (3) (c), (4) (d) at various concentrations against E. Coli
17
Fig. S34 Growth curves of the nanocomposites B with the different ratios (1) (a) (2) (b), (3) (c), (4) (d) at various concentrations against S. aureus
Fig. S35 Growth curves of the nanocomposites C with the different ratios (1) (a) (2) (b), (3) (c), (4) (d) at various concentrations against S. aureus