Data S1.
Supplemental Methods
Implantation of telemetry, BP measurement and metabolic cages
BP telemetry devices, TA11PA-C40 (Data Science International, St Paul, MN, USA), were implanted as previously described (1) in the abdominal aorta of the rats. In short, following midline abdominal incision, the aorta was prepared and punctured just above the bifurcation using a 23-gauche needle for insertion of the telemetry catheter. After sealing (Vetbond 3M, Aichele Medico, Aesch, Switzerland) and control of the catheter placement, the device battery was attached to the left lateral abdominal wall and the skin closed. The data (systolic and diastolic BP) were transmitted to a receiver and collected for 10s, every 15min (Fig. S2).
After 3w of recovery, the animals were transferred to metabolic cages for approximately 30h before mating and at days 3 to 4 (week 1), 10 to 11 (week 2), and 16 to 17 (week 3) of pregnancy. A second cohort of non-pregnant rats was placed in metabolic cage at the same time points. Urine was collected and food/water intake was monitored. Telemetric BP recordings were obtained for 3d before mating and throughout pregnancy when the animals were returned to their original cage.
Urine analysis
Urinary creatinine and Na+ excretion were determined in our central hospital laboratories using validated routine clinical methods. Na+ balance was calculated as the ratio of Na+ intake vs. urinary Na+ excretion, A high ratio thus indicates a Na+ retention.
RNA extraction and TaqMan PCR analysis of components of the RAS in the renal cortex and medulla
Independent frozen kidney specimens (n=3 animals) were pulverized in liquid nitrogen and homogenized by ultrasonic homogenizer (20s) with RNA being extracted using the SV total RNA isolation kit or by the Trizol method. Using 2ug of RNA, reverse transcription using the Super Script III RT-PCR system was completed (Invitrogen, USA). Homology-based quantitative TaqMan PCR was performed with Roche Universal Probe Library primers and probes for angiotensinogen, angiotensin converting enzyme, renin, angiotensin receptor 1a and 1b, and the ENaC subunits α, β and γ to identify and quantify the respective transcripts. Negative controls for the RT and the PCR reagents were assessed. The geometric mean of β-actin, HPRT1 and Hmbs served as endogenous controls (Supplemental Table S2). Each measurement was repeated in triplicates.
Sample preparation for Western blot analysis
Independent plasma membrane fractions (n=3 animals) were prepared of cortical and medullary renal specimens. The frozen kidney specimens were pulverized in liquid nitrogen and homogenized by ultrasonic homogenizer (20s) in ice-cold homogenisation buffer containing 250mmol/L sucrose, 10mmol/L triethanolamine, 10mmol/L Na+ -pyrophosphate, 1mmol/L Na+-orthovanadate, 100mmol/L Na+-fluoride, 1.3mg/10μl DMSO of N-ethilaleimide and one tablet of complete protease inhibitor cocktail per 2ml (Roche, Grenzach-Wyhlen, Germany). The homogenate was centrifuged at 1,000g and 4°C for 5min and the supernatant was further centrifuged at 20,000g and 4°C for 60min to obtain a fraction enriched for plasma membranes. The pellet was resuspended in sucrose buffer containing phosphatase and protease inhibitors.
All protein concentrations from kidney cortex and medulla homogenates were determined using a colorimetric protein assay based on the biuret reaction (Pierce, BCA Protein Assay Kit, Thermo Scientific, Switzerland), using an albumin standard to establish a linear calibration curve.
SDS-Polyacrylamide gel electrophoresis (SDS-PAGE) and immunoblotting
The protein separation was performed by the SDS-Page method in an electrophoresis chamber (Biorad, California, USA) using an electrophoresis buffer consisting of 1% SDS, 192mmol/L glycine and 25mmol/L Tris at pH 8.3. The samples were dissolved in Laemmli buffer (3% SDS, 10% glycerol, 5% mercaptoethanol, 1% bromophenol blue, 95mmol/L Tris [pH 6.8]), denatured for 5min at 95°C, and loaded on 10% or 12% acrylamide gels. The molecular weight was determined with Page Ruler Plus prestained protein ladder (Thermo Fisher Scientific Inc., USA). The protein was transferred from the gel to a nitrocellulose membrane (Brunschwig, The Netherlands) with a tank-sandwich Western blotting system under permanent cooling conditions. Equal loading and electrophoretic transfer quality of the proteins onto nitrocellulose membranes were verified using 0.1% Ponceau red staining. Membranes were blocked with 5% skim milk for 60min and then incubated overnight at 4°C with primary antibodies. Thereafter, membranes were extensively washed with 0.5% Tween/TBS solution and incubated with secondary antibodies for 2h. Immunoreactive bands were detected using an enhanced chemiluminescence kit (Amersham ECL Select Western Blotting Detection Reagent, GE Healthcare, UK) followed by subsequent acquisition using Syngene G:Box Chemi XX6 software (Cambridge, UK). Band intensity was evaluated using Image J and normalized to β-actin abundance with control values set as 100%. Each measurement was repeated in triplicates.
For Western blot previously well-characterized primary antibodies were used: The non-commercial polyclonal, anti-rabbit antibodies against full length α-subunits of ENaC (1:500 (2)), against a synthetic peptide mapping to the N-terminal amino acids 46-68 (StressMarq Biosciences Inc., Victoria BC CANADA, catalogue # SPC-403; 1:500), against β-subunits of ENaC (1:500 (2)), against γ-subunits of ENaC (1:500 (2)), and against β-actin (Santa Cruz Biotechnology, Inc., USA; 1:2000). As secondary antibody was used HRP-conjugated affinity purified donkey anti-rabbit IgG (Jackson ImmunoResearch Laboratory Europe Ltd., UK; 1:5,000).
Table S1. Impact of salt intake on body weight, food and water consumption in non-pregnant (n=3-5) and pregnant (n=4) rats.
Non-pregnant
NS HS LS HS/LS
HS LS
Weight gain (day 20)
[% of initial body weight] 14.0± 4.0 14.7± 1.3 8.9± 7.6 10.8± 6.6 Water intake [ml/100g BW/d] 12.0± 5.2 26.5± 1.5* 15.9±12.5 26.5±1.8* 10.4± 9.8§ Food intake [g/100g BW/d] 11.5± 0.6 14.0± 1.1 12.6± 0.9 13.2±1.7 11.9± 1.2 Pregnant NS HS LS HS/LS HS LS
Weight gain (day 20)
[% of initial body weight] 45.7±11.8 30.1±11.7* 18.5± 9.3*** 28.9± 6.4* Weight gain (day 20)
[% of initial body weight/fetus] 2.0± 0.9 1.4±1.4 0.8± 0.9* 1.2± 0.5
Water intake
[ml/100g BW/d] 15.9± 9.4 29.6± 3.7** 22.7± 5.2 32.0±5.4*** 19.6± 6.2§
Food intake
[g/100g BW/d] 14.1± 2.8 12.0± 2.0 13.0± 0.8 12.7±1.4 10.2± 0.9**
Results in mean ± SD *P<0.05 **P<0.001 *** P< 0.0001 vs. NS §P<0.05 between the switch of salt diet (HS to LS)
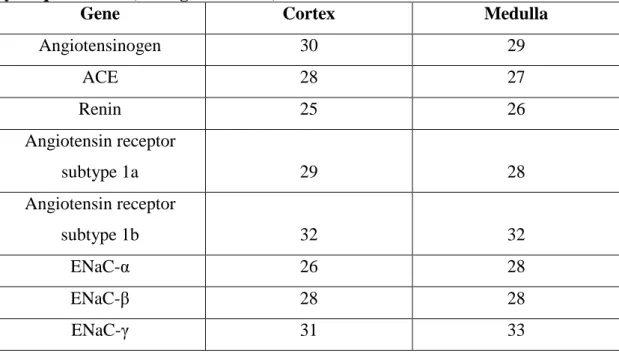
Table S2. Mean absolute expression levels of components of the RAS as assessed by TaqMan PCR (average Ct values).
Gene Cortex Medulla
Angiotensinogen 30 29 ACE 28 27 Renin 25 26 Angiotensin receptor subtype 1a 29 28 Angiotensin receptor subtype 1b 32 32 ENaC-α 26 28 ENaC-β 28 28 ENaC-γ 31 33
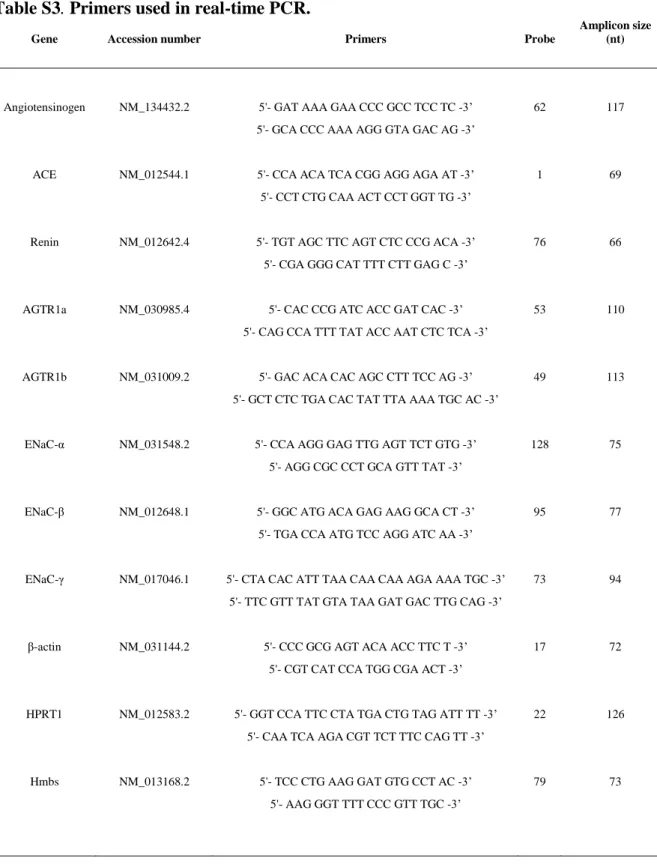
Table S3. Primers used in real-time PCR.
Gene Accession number Primers Probe
Amplicon size (nt)
Angiotensinogen NM_134432.2 5'- GAT AAA GAA CCC GCC TCC TC -3’ 62 117 5'- GCA CCC AAA AGG GTA GAC AG -3’
ACE NM_012544.1 5'- CCA ACA TCA CGG AGG AGA AT -3’ 1 69 5'- CCT CTG CAA ACT CCT GGT TG -3’
Renin NM_012642.4 5'- TGT AGC TTC AGT CTC CCG ACA -3’ 76 66 5'- CGA GGG CAT TTT CTT GAG C -3’
AGTR1a NM_030985.4 5'- CAC CCG ATC ACC GAT CAC -3’ 53 110 5'- CAG CCA TTT TAT ACC AAT CTC TCA -3’
AGTR1b NM_031009.2 5'- GAC ACA CAC AGC CTT TCC AG -3’ 49 113 5'- GCT CTC TGA CAC TAT TTA AAA TGC AC -3’
ENaC-α NM_031548.2 5'- CCA AGG GAG TTG AGT TCT GTG -3’ 128 75 5'- AGG CGC CCT GCA GTT TAT -3’
ENaC-β NM_012648.1 5'- GGC ATG ACA GAG AAG GCA CT -3’ 95 77 5'- TGA CCA ATG TCC AGG ATC AA -3’
ENaC-γ NM_017046.1 5'- CTA CAC ATT TAA CAA CAA AGA AAA TGC -3’ 73 94 5'- TTC GTT TAT GTA TAA GAT GAC TTG CAG -3’
β-actin NM_031144.2 5'- CCC GCG AGT ACA ACC TTC T -3’ 17 72 5'- CGT CAT CCA TGG CGA ACT -3’
HPRT1 NM_012583.2 5'- GGT CCA TTC CTA TGA CTG TAG ATT TT -3’ 22 126 5'- CAA TCA AGA CGT TCT TTC CAG TT -3’
Hmbs NM_013168.2 5'- TCC CTG AAG GAT GTG CCT AC -3’ 79 73 5'- AAG GGT TTT CCC GTT TGC -3’
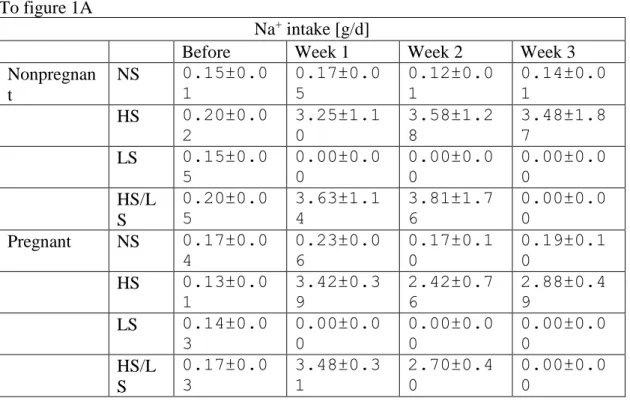
Table S4. Numerical data of figures.
To figure 1A
Na+ intake [g/d]
Before Week 1 Week 2 Week 3 Nonpregnan t NS 0.15±0.0 1 0.17±0.0 5 0.12±0.0 1 0.14±0.0 1 HS 0.20±0.0 2 3.25±1.1 0 3.58±1.2 8 3.48±1.8 7 LS 0.15±0.0 5 0.00±0.0 0 0.00±0.0 0 0.00±0.0 0 HS/L S 0.20±0.0 5 3.63±1.1 4 3.81±1.7 6 0.00±0.0 0 Pregnant NS 0.17±0.0 4 0.23±0.0 6 0.17±0.1 0 0.19±0.1 0 HS 0.13±0.0 1 3.42±0.3 9 2.42±0.7 6 2.88±0.4 9 LS 0.14±0.0 3 0.00±0.0 0 0.00±0.0 0 0.00±0.0 0 HS/L S 0.17±0.0 3 3.48±0.3 1 2.70±0.4 0 0.00±0.0 0 To figure 1B
Urinary Na+ excretion [mmol/mmol creatinine]
Before Week 1 Week 2 Week 3 Nonpregnant NS 15± 2 15± 3 13± 3 13± 2 HS 19± 4 237± 45 279± 79 255±131 LS 18± 4 3± 1 1± 0 3± 1 HS/LS 22± 4 220± 48 285± 19 5± 5 Pregnant NS 24± 7 15± 2 13± 7 11± 3 HS 19± 6 303± 24 174± 79 282± 67 LS 18± 2 4± 2 1± 1 0± 0 HS/LS 17± 5 314± 36 199± 26 2± 2 To figure 1C
Na+ intake/urinary Na+ excretion [(mg Na+)/(mmol Na+/mmol creatinine)]
Before Week 1 Week 2 Week 3
Nonpregnant NS 10.3± 1.6 11.5± 1.6 9.8± 0.9 10.8± 2.4 HS 10.9± 2.8 14.3± 6.1 13.5± 5.2 13.6± 0.3 LS 8.7± 1.2 1.6± 0.7 2.6± 0.8 1.4± 0.3 HS/LS 9.8± 2.8 17.2± 6.4 13.2± 5.2 4.0± 3.3 Pregnant NS 7.9± 3.4 15.0± 5.3 16.6± 7.9 15.7± 4.6 HS 7.4± 2.5 11.3± 1.5 14.9± 4.0 10.4± 1.4 LS 7.5± 0.7 1.6± 1.0 4.2± 2.2 38.6±31.9 HS/LS 10.3± 3.0 11.2± 1.4 13.9± 3.5 2.9± 2.4
To figures 2A-D
Systolic blood pressure [% of baseline]
Day NS HS LS HS/LS Nonpregnant -2 100± 3 100± 3 101± 4 100± 3 -1 100± 8 100± 3 99± 5 100± 3 01 102± 6 101± 1 103± 5 101± 1 02 103± 6 104± 3 102± 3 104± 3 05 103± 7 108± 3 102±10 108± 3 06 104± 4 107± 5 102± 7 107± 5 07 103± 4 108± 6 101± 7 108± 6 08 103± 5 107± 6 98± 5 107± 6 09 100± 4 106± 3 100± 6 106± 3 12 103± 3 104±11 102± 8 104±11 13 99± 2 103± 6 105± 6 103± 6 14 101± 2 100± 7 102± 4 103± 6 15 102± 1 107± 6 100± 4 92± 6 18 102± 2 106± 1 104± 8 91± 7 19 99± 2 106± 6 102± 6 92± 5 Pregnant -2 100± 3 100± 4 101±10 100± 4 -1 100± 2 100± 7 100±12 100± 7 01 101± 6 98±10 101±12 98±10 02 102± 5 100±10 100± 8 100±10 05 103± 4 100± 6 106± 8 100± 9 06 103± 3 99± 7 104± 7 99± 7 07 103± 2 100± 9 104± 4 100± 9 08 103± 4 95±12 103± 7 95±12 09 102± 8 95± 8 103± 8 95± 8 12 102± 4 96± 7 104±10 96± 7 13 103± 7 99± 3 101± 7 99± 3 14 104± 6 97± 7 100± 5 97± 7 15 103± 5 96± 9 103± 6 92± 4 18 101± 4 89± 8 97±11 93± 6 19 99± 5 84±11 90± 5 85± 5 To figures 3A-B
Change of normalized AUC of systolic blood pressure [% of baseline] Before Week 1+2 Week 3 Nonpregnant NS 0.0±0.0 2.6±2.1 1.5±5.6 HS 0.0±0.0 5.9±3.1 4.6±7.4 LS 0.0±0.0 1.2±1.9 1.9±1.7 HS/LS 0.0±0.0 4.9±2.6 -7.2±8.2 Pregnant NS 0.0±0.0 2.5±4.8 1.8±4.1 HS 0.0±0.0 -2.1±4.4 -7.5±5.1 LS 0.0±0.0 2.6±3.1 -2.0±5.4 HS/LS 0.0±0.0 -1.6±2.5 -8.6±2.9 To figures 4A-E
mRNA [relative expression] NS HS LS HS/LS Angiotensinogen C-NP 1.0±0.2 1.3±0.1 0.5±0.1 0.7±0.2 C-P 1.0±0.2 1.0±0.3 1.1±0.2 0.7±0.1 M-NP 1.0±0.3 1.6±0.3 1.1±0.6 0.6±0.2 M-P 1.4±0.1 1.7±0.4 1.8±0.4 1.6±0.1 ACE C-NP 1.0±0.2 0.8±0.1 0.8±0.1 0.5±0.2 C-P 0.2±0.1 0.5±0.2 0.5±0.1 0.7±0.1 M-NP 1.0±0.3 1.4±0.1 1.0±0.4 0.5±0.2 M-P 0.4±0.1 0.8±0.1 0.9±0.2 1.6±0.1 Renin C-NP 1.0±0.5 0.3±0.1 1.0±0.5 0.5±0.1 C-P 1.0±0.5 0.3±0.1 2.0±0.3 1.1±0.4 M-NP 1.0±0.3 0.2±0.2 1.1±0.3 0.2±0.1 M-P 0.2±0.1 0.3±0.1 0.6±0.2 0.3±0.1 AGTR1a C-NP 1.0±0.2 1.2±0.1 0.6±0.1 0.7±0.1 C-P 0.9±0.3 0.5±0.2 0.5±0.1 0.4±0.1 M-NP 1.0±0.2 1.8±0.2 0.7±0.1 1.0±0.1 M-P 0.8±0.2 1.2±0.2 0.4±0.1 0.5±0.1 AGTR1b C-NP 1.0±0.2 0.9±0.1 0.8±0.2 1.0±0.2 C-P 0.9±0.5 0.5±0.2 0.6±0.2 0.4±0.1 M-NP 1.0±0.3 1.2±0.1 1.0±0.2 1.0±0.3 M-P 0.8±0.3 1.7±0.4 0.6±0.3 0.5±0.2 To figure 5
mRNA [relative expression]
NS HS LS HS/LS ENaC-α C-NP 1.0±0.1 1.1±0.1 0.8±0.1 0.9±0.1 C-P 1.0±0.3 0.7±0.0 0.6±0.2 0.5±0.1 M-NP 1.0±0.2 1.0±0.2 0.8±0.1 0.8±1.1 M-P 1.1±0.4 1.5±0.4 0.9±0.3 1.0±0.3 ENaC-β C-NP 1.0±0.2 1.9±0.1 0.9±0.2 1.0±0.3 C-P 1.3±0.7 0.9±0.3 0.5±0.1 0.4±0.1 M-NP 1.0±0.3 0.9±0.2 0.7±0.2 0.7±0.3 M-P 0.7±0.1 0.7±0.1 0.4±0.2 0.4±0.1 ENaC-γ C-NP 1.0±0.3 1.7±0.1 0.9±0.2 0.7±0.2 C-P 0.8±0.4 0.6±0.3 0.3±0.1 0.2±0.1 M-NP 1.0±0.3 0.8±0.4 0.7±0.2 0.8±0.3 M-P 0.7±0.3 1.0±0.1 0.6±0.4 0.4±0.1
To figures 6A-C
Protein expression [% of β-actin]
NS HS LS HS/LS ENaC-α full C-NP 100± 30 70±10 100±10 280± 40 C-P 330± 90 210±10 190±10 510± 10 M-NP 110± 30 110±10 120±20 140± 60 M-P 40± 40 110±30 100±10 220± 50 ENaC-α cleaved C-NP 100± 30 100±10 170±10 520± 30 C-P 420± 40 210±20 200±30 220± 10 M-NP 110±100 110±90 320±20 660± 30 M-P 700± 50 670±50 2100±30 1600± 50 ENaC-β full C-NP 100± 40 110±10 70±20 100± 30 C-P 110± 20 100±20 120±20 190± 20 M-NP 100± 30 100±30 110±50 120±100 M-P 210± 50 360±10 450±40 520± 30 ENaC-γ full C-NP 100± 10 110±20 120±30 80± 20 C-P 80± 40 80±20 50±50 70± 30 M-NP 110± 40 90±10 120±20 100± 20 M-P 70± 70 380±20 460±20 240± 60 ENaC-γ cleaved C-NP 100± 10 100±10 170±20 7100± 10 C-P 10500± 10 350±80 80±10 170± 50 M-NP 110± 30 70±10 110±30 90± 50 M-P 40± 40 70±10 90±60 50± 50
-4 -3 -2 -1 0 1 2 3 4 5 6 7 8 9 10 11 12 13 14 15 16 17 18 19 20 21
Metabolic Cage (Food, Water, Urine, Feces)
® Na
+and creatinine in urine
Telemetry (Food, Water)
mating
*
Baseline
Week 1
Week 2
Week 3
Study Design
Figure S1
D ay 1 N ig ht 1 D ay 2 N ig ht 2 D ay 5 N ig ht 5 D ay 6 N ig ht 6 D ay 7 N ig ht 7 D ay 8 N ig ht 8 D ay 9 N ig ht 9 D ay 12 N ig ht 12 D ay 13 N ig ht 13 D ay 14 N ig ht 14 D ay 15 N ig ht 15 D ay 18 N ig ht 18 D ay 19 N ig ht 19 D ay 20 90 100 110 120 130 140 S ys to lic bl oo d pr es su re [m m H g]
Night periods
Non-pregnant PregnantTypical telemetry data obtained during the experimental period
Figure S2
Supplemental References:
1. Schumacher M, Frey FJ, Montani JP, Dick B, Frey BM, Ferrari P. Salt-sensitivity of blood pressure and decreased 11beta-hydroxysteroid
dehydrogenase type 2 activity after renal transplantation. Transplantation. 2002;74:66-72.
2. Kastner C, Pohl M, Sendeski M, Stange G, Wagner CA, Jensen B, Patzak A, Bachmann S, Theilig F. Effects of receptor-mediated endocytosis and tubular protein composition on volume retention in experimental