HAL Id: hal-01256933
https://hal.archives-ouvertes.fr/hal-01256933
Submitted on 15 Jan 2016
HAL is a multi-disciplinary open access
archive for the deposit and dissemination of
sci-entific research documents, whether they are
pub-lished or not. The documents may come from
teaching and research institutions in France or
abroad, or from public or private research centers.
L’archive ouverte pluridisciplinaire HAL, est
destinée au dépôt et à la diffusion de documents
scientifiques de niveau recherche, publiés ou non,
émanant des établissements d’enseignement et de
recherche français ou étrangers, des laboratoires
publics ou privés.
Distributed under a Creative Commons Attribution - ShareAlike| 4.0 International
Drop formation in shear-thickening granular suspensions
Zhongcheng Pan, Nicolas Louvet, Yves Hennequin, Hamid Kellay, Daniel Bonn
To cite this version:
Zhongcheng Pan, Nicolas Louvet, Yves Hennequin, Hamid Kellay, Daniel Bonn. Drop formation in
shear-thickening granular suspensions. Physical Review E : Statistical, Nonlinear, and Soft Matter
Physics, American Physical Society, 2015, 92 (5), pp.052203 (1-6). �10.1103/PhysRevE.92.052203�.
�hal-01256933�
Drop formation in shear-thickening granular suspensions
Zhongcheng Pan,1 Nicolas Louvet,2,* Yves Hennequin,1 Hamid Kellay,2 and Daniel Bonn1,†
1Soft Matter group, Van der Waals–Zeeman Institute, IoP, Science Park 904, Amsterdam, Netherlands
2Universite´ de Bordeaux, Laboratoire Ondes et Matie`re d’Aquitaine CNRS UMR 5798, 351 cours de la Libe´ration, 33405, Talence, France
We study droplet formation in granular suspensions by systematically varying the volume fractions (ϕ) and particle diameters (d). For suspensions with water as the suspending liquid, we find three different regimes. For dilute suspensions (ϕ ≤ 45%), drop formation follows the predictions for inertial breakup and exhibits identical dynamics to that of pure water. The breakup is strongly asymmetrical in this case. Only for more concentrated suspensions (ϕ > 45%) does the presence of particles change the dynamics and two other regimes, a symmetrical inertial regime and a Bagnoldian regime, are uncovered. We construct and discuss a phase diagram that allows us to understand and predict the breakup behavior in granular suspensions.
PACS number(s): 45.70.−n, 47.57.−s, 47.20.Dr, 47.55.D−
Drop formation is essential for many industrial applications and processes [1]. For Newtonian fluids, liquid neck breakup leading to drop formation is well understood: it is governed by a competition between capillary forces that drive the breakup and viscous and/or inertial forces slowing down the fluid flow in the neck [1]. The detailed understanding of the phenomenon relies on finding the similarity solutions for the shape of the fluid neck that connects the drop to the orifice, and that eventually breaks up in a finite time [1].
On the other hand, drop formation in non-Newtonian fluids, which is important in areas such as emulsification, inkjet printing, and agricultural spraying, is still ill understood in many cases [1–4] and continues to attract considerable attention [5–13]. For instance, theoretical analysis predicts that the drop breakup in shear thinning fluids proceeds faster than that in the Newtonian case due to the high elongational rates present in the fluid neck during the thinning [14,15]. To the contrary, experiments show that in shear thinning and very strongly shear thinning yield stress fluids, the breakup dynamics can be described completely by the equations for the breakup of simple fluids [6], whereas other experiments do report a signature of the shear thinning behavior [7,16,17]. A very recent paper shows that nonlocal rheology may play a role in these yield stress fluids [18].
Here we consider an important class of complex fluids: granular suspensions made of solid particles homogeneously dispersed in a simple Newtonian liquid. The viscosity of these suspensions can be simply increased by adding particles without affecting the density or the surface tension of the suspensions [19], making these systems excellently suited for a systematic study. Different questions then arise: what is the relation between shear and elongational rheology, does the size of the particles affect the breakup dynamics, and what is the role of the suspension concentration? To answer these ques- tions we use a system whose rheology in shear flow is simple: if the suspensions are density matched they behave as Newtonian liquids at low shear rates, and show shear thickening at higher
*Present address: Laboratoire d’Energe´tique et de Me´canique
The´orique et Applique´e (LEMTA), Universite´ de Lorraine-CNRS, UMR 7563, F-54504 Vandoeuvre-Le`s-Nancy, France.
shear rates [20,21]. Recent studies show that during breakup different scenarios may occur [22]; the breakup may be visco- capillary but governed by either the solvent or the suspension viscosity [8–10]. Also new regimes are found that are dramat- ically different from the predictions for simple fluids [11–13]. In highly concentrated granular suspensions [11] the thinning of the neck was found to follow a power law versus time to breakup with an exponent of 2/3, which alone would be the inertial breakup; however with a counterintuitive symmetric breakup geometry. It was argued in [11] that the force balance takes place more locally here and that the capillary pressure exerted at the level of the individual particles protruding from the interface is balanced by the fluid inertia. Exponential thin- ning is also observed in colloidal and cornstarch suspensions: the thinning dynamics proceeds more slowly than that in the Newtonian case and the thinning neck becomes cylindrical [12,13]. The overall picture is still not clear and the different mechanisms at play deserve further systematic study.
In this paper, by systematically varying the particle di- ameters (d) and volume fractions (ϕ), we establish a phase diagram for suspension breakup. Three regimes for the drop breakup occur: an inertial regime identical to that of the solvent (water), a second inertial regime in which the breakup is still inertial but becomes up-down symmetric, and a third, which we refer to as a Bagnoldian regime, that likely corresponds to a shear-thickened state (with the emergence of significant normal stresses) of the material. The transitions between the different regimes are identified and possible criteria for the transitions between the different regimes are suggested.
The granular suspensions used in the experiments are prepared using poly(methyl methacrylate) (PMMA) parti- cles (d = 1.3,6,10,15 μm) with a density ρ ≈ 1.19 g/cm3
or polystyrene (PS) particles (d = 20, 40, 80, 140, 250,
500 μm) with ρ ≈ 1.05 g/cm3. To avoid sedimentation
or creaming, we prepare density-matched suspensions by dispersing particles in pure water, in which the salt NaI (purchased from Sigma Aldrich) is previously dissolved to adjust the density to that of the particles. The viscosity (η) of the suspensions is increased by simply increasing the volume fraction ϕ. Colloidal suspensions are prepared by dispersing
1.3 μm PMMA particles in density-matched mixed solvents,
cyclohexyl bromide (CHB) and decalin, which has a similar viscosity to that of water (η ≈ 1 mPa s).
min
0
FIG. 2. (Color online) Rescaled data for 40 μm suspen- sions with ϕ ); 50%. The red line is the equation Rmin ∼
(Aγ d/ρR0)1/3(t0 − t )2/3.
the prefactor, we fit the thinning curves close to the breakup time t0. For a fitting range 0 < (t0 − t ) < 2 ms, the data are
linear when plotted as 2R3/2 vs (t0 — t ), allowing evaluation
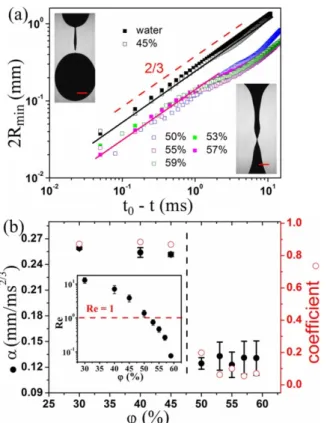
FIG. 1. (Color online) (a) Thinning dynamics 2Rmin vs (t0 − t )
for water and 40 μm suspensions with ϕ varying from 45% to 59%. Continuous lines: power law fit with 2Rmin = α(t0 − t )2/3. Inset: two
images showing the asymmetric and symmetric breakup, respectively. The scale bar is 1 mm. (b) Left: prefactor α from fitting the thinning curves in (a). Right: asymmetry coefficient. Inset: Reynolds number Re vs ϕ.
To study the dynamics of drop detachment for the granular suspensions in air, we use a high-speed video camera (Phantom V7 at 10000 frames/s). The controlled release of the drops is achieved by using a syringe pump to set a low drop emission rate. To prevent possible jamming in the syringe tip, two kinds of syringes are used, with radii R0 ≈ 1 mm for d �
40 μm particles and 2.25 mm for d ); 80 μm particles. The
rheological measurements are carried out using a cone-plate geometry with a 50 mm diameter cone and a 4◦ angle on a Physica MCR 300 rheometer for the smallest particles. For the larger particles we use a 5 mm gap Couette cell or a plate-plate geometry with variable gap, and ensure that the results do not depend on the gap size.
We first discuss the results for the 40 μm PS beads [20,23]. Figure 1(a) shows the temporal variation of the minimum neck diameter 2Rmin for different volume fractions ϕ. For comparison, we also plot the thinning curve for water
which follows the inertial-capillary prediction [1,24]: 2Rmin =
0.7(γ /ρ)1/3(t
0 − t )2/3, where γ is the surface tension, ρ is
of the slope. We also fit directly using 2Rmin = α(t0 − t )2/3
[Fig. 1(a)]; α is indistinguishable between the two methods of fitting and is shown in Fig. 1(b). Note that for low volume fractions this prefactor is similar to that for water (0.27 mm/ms2/3) but drops to a smaller value for ϕ ); 50%.
Further, there is a major, visual change in the shape of the interface at breakup at different volume fractions ϕ: for small
ϕ the breakup is strongly asymmetric, whereas for large ϕ
it becomes symmetric [Fig. 1(a) inset] and this happens at a larger scale instead of a single-particle level. The asymmetry coefficient defined in [6,26] shows a clear and sharp transition from asymmetric to symmetric breakup around ϕ ≈ 45% [Fig. 1(b)]. Here the observation of the 2/3 law thinning dynamics together with the symmetric breakup is in agreement with the observations in [11].
The main difference between concentrated and dilute suspensions may be that for the former particles are more likely to deform the interface during the breakup, as also observed for shear flow due to dilatancy [27]. As discussed in the introduction, the local force balance at the level of the individual particles leads to the scaling 2Rmin ∼
(Aγ d/ ρR0)1/3(t0 − t )2/3 [11], which resembles the usual
inertial scaling but includes an extra factor (Ad/R0)1/3 with R0
the syringe radius, and A an additional constant that accounts for the characteristics of the particles at the interface such as the contact angle and the depth of immersion. This is then likely to be the cause of the changed prefactor α in Fig. 1(b), allowing us to calculate the constant A; as an example, for ϕ ≈ 59%,
A ≈ 0.114, close to the reported value [11]. In fact, all the data
with ϕ ); 50% collapse on a single master curve at A ≈ 0.1 the density, and t0 is the breakup time. For dilute suspensions if Rmin/(R0A1/3) is plotted vs (t0 − t )/(ρR4/γ d) 1/2 (Fig. 2),
(ϕ � 45%), the dynamics is indistinguishable from that of pure water [Fig. 1(a)] with an asymmetric breakup [Fig. 1(a) inset], showing that the particles have no influence on the breakup dynamics [25]. To the contrary, the neck thinning curves for concentrated suspensions (ϕ ); 50%) deviate from the inertial prediction in that the prefactor is different, but the power of 2/3 in time seems to be conserved [Fig. 1(a)]. To quantify
suggesting that the breakup in all concentrated suspensions falls in the symmetric inertial regime.
As stated in the introduction, neither the density nor the sur- face tension changes upon varying the volume fractions. The viscosity does change [19,20,23], but this should be irrelevant for the inertial breakup dynamics. Consequently, the viscous forces are considered to be negligible not only in the inertial
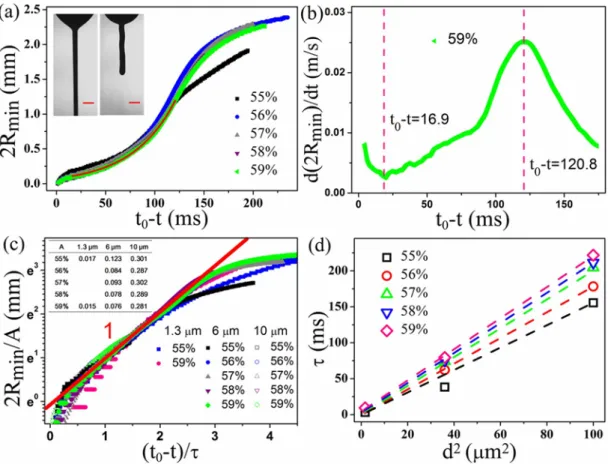
FIG. 3. (Color online) (a) Thinning dynamics 2Rmin vs (t0 − t ) for 6 μm suspensions with ϕ ); 55%. Red line: exponential fitting with
2Rmin = A exp [(t0 − t )/τ ]. Inset: two images showing the cylindrical neck geometry and the upper neck recoils after the breakup, respectively.
The scale bar is 1 mm. (b) The neck thinning velocity d(2Rmin)/dt vs (t0 − t ) with ϕ = 59%; the fitting range is chosen between the minimum
and maximum points in the curve. (c) Rescaled data for 1.3, 6, and 10 μm suspensions. Inset: prefactor A from exponentially fitting all thinning curves. (d) The quadratic dependence of the thinning time τ , in the Bagnoldian regime, on the particle diameter d.
but also in the symmetric inertial regimes, as viscosity is absent in both scalings. To examine whether the viscous forces can indeed be neglected, we estimate the ratio of the inertial to the viscous forces for the last instant before breakup: the Reynolds number Re = ρvt Rmin/η; here vt = d(2Rmin)/dt is the neck
thinning velocity, and η is obtained from shear rheology. We take an average velocity in the final stages (the last few milliseconds) of the thinning curves to estimate Re. This Reynolds number can also be estimated as Re = (Rmin/lv )1/2
with the viscous length scale given by lv = η2/ργ ; viscous
forces should dominate the dynamics when Rmin is smaller than lv . As shown in Fig. 1(b) inset, the estimated Re decreases with
increasing ϕ (increasing η). Thus, for high concentrations, for which Re < 1 and despite the fact that for a substantial part of the thinning dynamics the neck radius Rmin is smaller than the
viscous length scale lv , the thinning does not happen at constant
speed, but rather as 2Rmin ∝ (t0 − t )2/3. For Newtonian fluids,
if Rmin < lv , one would, expect 2Rmin ∝ (t0 − t ): the thinning
happens at constant speed.
In addition, our experiments show that the change of regimes is observed to happen around Re ≈ 1. This is surprising since in classical theory for Newtonian fluids, for Re ≈ 1 the drop breakup should follow viscous-inertial- capillary dynamics which is linear in time and asymmetric in breakup geometry [26]. The exact significance of this result is not obvious at present and may suggest that the mechanism
behind the symmetric inertial regime works only when viscous forces are important even though they do not enter explicitly into the force balance.
Measurements on systems with different particle diameters show the generality of the symmetric inertial regime; typical data for the thinning of the neck in 6 μm PMMA suspensions show that, similarly to what happens for the 40 μm particles, as
ϕ is increased (50% < ϕ < 55%), the thinning curves deviate
from that of water and again fall in this regime. However, for these small particles, yet another regime exists. If volume fraction is increased beyond ϕ ∼ 55%, the breakup dynamics shows a very different behavior. As shown in Fig. 3(a), before the final breakup, the thinning dynamics slows down for 2Rmin,l ≤ 2Rmin ≤ 2Rmin,u with the critical neck diameters
2Rmin,l and 2Rmin,u being the lower and the upper end of
this regime, respectively. The positions of these diameters (inflection points) can be obtained from the time dependence of the thinning velocity d(2Rmin)/dt , as shown in Fig. 3(b).
Upon increasing the volume fraction, 2Rmin,l decreases from
0.19 to 0.09 mm, while 2Rmin,u increases from 1 to 1.4 mm.
The temporal dynamics in this regime can be fitted well by the exponential scaling 2Rmin = A exp (t0 − t )/τ , where A is
the prefactor, τ is the exponential thinning time, and t0 is the
breakup time. Contrary to the above two regimes, the neck geometry becomes cylindrical during the exponential thinning [Fig. 3(a) inset]. The cylindrical shape is lost near the end of the
breakup process where the thinning process accelerates and the symmetry is broken as observed before [13]. After the breakup, the upper neck recoils, suggesting that the neck supports a strong tensile stress. All of these features (exponential thinning and cylindrical neck geometry) are consistent with the observations in [12,13]. The capillary force is mainly countered by the elongational viscosity of the suspensions and the tensile stress in the neck is usually associated with an increase of the first normal stress difference τzz − τrr , with
τzz and τrr being the normal stress components along the
axis and radius of the neck, respectively. In agreement with this idea, we find that all the thinning curves (for 1.3, 6, and
10 μm suspensions with ϕ ); 55%) collapse on a single master
curve if 2Rmin/A is plotted vs (t0 − t )/τ in semilogarithmic
coordinates [Fig. 3(c)]. This suggests that the exponential thinning model for this regime captures all the experimental data. The characteristic time of the exponential thinning shows a quadratic dependence on the particle diameter: τ ∝ d2
[Fig. 3(d)].
An interesting question in this regime is that the exponential thinning behavior cannot continue infinitely and must cease at some finite time (when 2Rmin = 2Rmin,l ) before the final
breakup. What happens close to breakup after exponential thinning has been studied rather extensively for polymer solutions [4]; here either secondary instabilities set in or dilution effects become important before a true asymptotic regime can be uncovered.
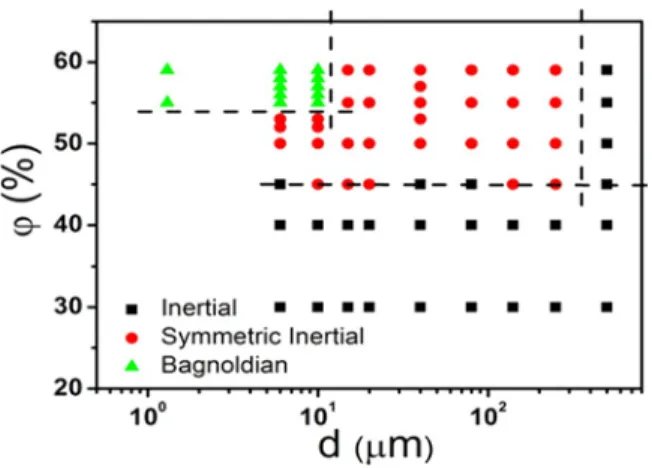
Combining the results for all different systems (systemat- ically varying the particle diameters d and volume fractions
ϕ), a phase diagram for drop formation in aqueous granular
suspensions is constructed (Fig. 4). Three regimes are shown in the diagram: the inertial, the symmetrical inertial, and the exponential regime. Interestingly, the transitions between the different regimes are observed to happen as a function of both the volume fractions ϕ and the particle diameters d (Fig. 4).
To understand the transitions, we start by noting that all suspensions at low volume fractions (ϕ � 45%) follow the inertial regime for water. As the volume fraction ϕ is increased
FIG. 4. (Color online) Phase diagram for drop formation in gran- ular suspensions. Water is used as the suspending liquid except for 1.3 μm suspensions, which are prepared in a mixed solvent of cyclohexyl bromide and decalin. For large particle (250 and 500 μm) suspensions, one drop of the surfactant Triton is added to stabilize the suspension. Dashed lines are guides to the eye.
(thus increasing the suspension viscosity), the particles start to affect the breakup and we observe the symmetric inertial regime. As shown in Fig. 4, the transition between these two regimes happens at ϕ ≈ 45% (which coincides with our estimate of Re ≈ 1); the fluctuations near the boundary are mainly due to the viscosity variations in different particle suspensions due to slight density mismatches that occur if the laboratory temperature varies. The asymmetric-symmetric transition is not observed for the 500 μm particles: even for
ϕ > 45%, the breakup still falls in the inertial regime. In
agreement with the arguments of [11], this happens because the pressure induced by the particles becomes small; the Laplace equation f'>P ∝ γ /d shows that the larger the particle, the smaller the pressure at the scale of the particle. For our case, if the ratio of the particle diameter d and syringe radius R0
(R0 ≈ 2.25 mm syringe is used for 500 μm particles) becomes
of order unity, and since (Aγ d/ρR0)1/3 is of the order of the
usual inertial prefactor α (0.27 mm/ms2/3), the equations for the two regimes become identical; in this case, the local force balance at the level of individual particles can be neglected. The condition d∼R0 then roughly defines the transition
between the two regimes as a function of the particle diameter. For the smallest particles at the highest concentrations, the breakup behavior also depends on the tensile stress in the thinning neck. Note that the exponential regime is also observed for a colloidal suspension of 1.3 μm particles (Fig. 4), showing that the thermal (Brownian) fluctuations of the particles do not change the breakup dynamics qualitatively; this is nontrivial since in some cases the breakup can be altered by fluctuation forces [28,29].
To understand the breakup behavior in the exponential regime, we correlate our observations with the shear rheology through measurements of the first normal stress difference N1;
here N1 = τ11 − τ22 with τ11 and τ22 being the normal stress
components along and perpendicular to the shear direction, respectively. Figure 5(a) shows that the viscosity of 6 μm particle suspensions is constant before shear-thickening, in agreement with [23]. The corresponding N1 curves are plotted
in Fig. 5(b). We measured a significant positive N1 in systems
with ϕ ); 55%; for ϕ < 55% cases, we did not observe positive normal stresses even at shear rates as high as 3000 s−1. A plot on a log-log scale shows that N1 scales with shear rate
squared γ˙ 2 [Fig. 5(b) inset]; the quadratic scaling suggests a Bagnoldian behavior, for which the shear and normal stresses are both proportional to the shear rate squared as observed in dry granular materials [20,30,31]; particle inertia may contribute to the emergence of the nonzero normal force [20,30]. We fit the N1 curves (positive part) with N1 = \ll1γ˙ 2,
where \ll1 is the first normal stress coefficient [Fig. 5(c)].
This enables us to compare the characteristic time τ for the exponential thinning with the relaxation time \ll1/η, measured
in the shear rheology with η being the suspension viscosity. We find that for the non-Brownian (6 and 10 μm) suspensions, the ratio of time scales is constant, i.e., \ll1/η varies linearly with
τ : \ll1/η ∼0.1 τ [Fig. 5(d)]. For the Brownian suspensions,
this measurement is difficult due to the rapid evaporation of the more volatile of the two solvents, and the suspension properties significantly change over time. The relation found nevertheless suggests a direct link between the time scales in elongational and shear flows. In [13], where an exponential
FIG. 5. (Color online) Rheological measurements for 6 μm suspensions. (a) Viscosity η vs shear rate γ˙ . (b) First normal stress difference
N1 vs γ˙ . Inset: log-log scale shows that N1 scales with γ˙ squared. The symbols are the same as in (a). (c) Determination of the critical shear
rate γ˙N and power law fit N1 = \ll1γ˙ 2 (red line). (d) Comparison between \ll1/η and τ (black symbols), and 1/γ˙N and τ (red symbols). Filled
and open symbols are for 6 and 10 μm suspensions, respectively, with ϕ varying from 55% (squares), 56% (circles), 57% (upward triangles), 58% (downward triangles), to 59% (diamonds).
thinning behavior was also observed in cornstarch suspensions, a critical shear rate γ˙N is defined as the point where N1 starts
to deviate from zero. In our experiments, if γ˙N is defined
in a similar way: the minimum point where N1 starts to
increase on increasing the shear rate [Fig. 5(c)], we also find a one-to-one correlation between the thinning time τ and γ˙N :
τ ∼ 3/γ˙N [Fig. 5(d)] in agreement with the results in [13]
albeit for a different suspension. All these observations point to a direct link between the elongational and shear rheology of suspensions with similar microscopic mechanisms regarding the emergence of the positive normal stresses. Therefore, we interpret the exponential regime regarding the drop breakup behavior as a granular Bagnoldian regime. The interesting negative part of the N1 curves in Fig. 5(b) may be due to the
solvent being sucked into the granular packing that is dilating due to the shear [32]; however, its study is beyond the scope of this work and will be pursued elsewhere.
For predicting the onset of shear thickening a critical Stokes number St = ρd2γ˙ /η
0 is sometimes used, with η0
the solvent viscosity [33]. In our elongational experiments (drop formation), we can estimate this from the elongation rate ε˙ = (−2/Rmin)(dRmin/dt ) = 2/τ and the viscous time τv = ρd2/η0 [using τ ∝ d2 as shown in Fig. 3(d)]; the latter
determines the time scale for the interstitial fluid passing through the space between particles. The Stokes number for the emergence of the Bagnoldian regime then turns out
becomes somewhat smaller (∼1 × 10⁻³) when the volume fraction increases up to ϕ = 59%, so that the Stokes number varies over a factor of 2. The phase diagram (Fig. 4) then indicates that St ∼ (1−2) × 10−3 gives the transition between the Bagnoldian regime and the symmetric inertial regime.
Compared with the Stokes number for the onset of shear thickening in the rheology, the onset shear rate for shear thickening gives Stokes numbers that are much smaller and vary over an order of magnitude when the volume fractions are changed: 0.3 × 10⁻⁴ < St < 5.4 × 10⁻⁴. Such small Stokes numbers for the onset of thickening are also found in other shear thickening systems; this is surprising since if the thickening were due to a viscous-to-inertial transition, one would expect the Stokes number to be of order unity. One interpretation of these small Stokes numbers is that they result from short-range interactions between particles that give the onset of thickening [20,34–37].
In conclusion, we studied drop formation in aqueous granular suspensions. Systematically changing the volume fractions (ϕ) and the particle diameters (d), we established a phase diagram that allows us to understand and predict the breakup behavior. It turns out that the behavior is very different from that of Newtonian fluids; which is important since many suspension flows can have an important elongational part, and it is this part that is characterized by our experiments. In addition, the results here allow the finite-time singularity that to be St = τv ε˙ ≈ 2 × 10⁻³ for ϕ = 55%, but gradually occurs at the breakup to be tailored in a controlled fashion.
One pertinent example is that the asymmetric inertial breakup invariably leads to the formation of satellite droplets. These are in fact suppressed in the symmetric inertial regime, which could find applications, e.g., in spraying and inkjet printing, where such satellites are unwanted.
We thank Mounir Aytouna for helpful discussions on the data. We thank NanoNextNL and FOM/NWO for the financial support of this research work. N.L. was supported by a fellowship from Rhodia-Solvay and H.K. was supported by LabEx AMADEus, ANR-10-LABX-0042-AMADEUS.
[1] J. Eggers and E. Villermaux, Rep. Prog. Phys. 71, 036601 (2008).
[2] M. Roche´, M. Aytouna, D. Bonn, and H. Kellay, Phys. Rev. Lett. 103, 264501 (2009).
[3] Y. Amarouchene, D. Bonn, J. Meunier, and H. Kellay, Phys. Rev. Lett. 86, 3558 (2001).
[4] C. Wagner, Y. Amarouchene, D. Bonn, and J. Eggers, Phys. Rev. Lett. 95, 164504 (2005).
[5] F. Ingremeau and H. Kellay, Phys. Rev. X 3, 041002 (2013). [6] M. Aytouna, J. Paredes, N. Shahidzadeh-Bonn, S. Moulinet, C.
Wagner, Y. Amarouchene, J. Eggers, and D. Bonn, Phys. Rev. Lett. 110, 034501 (2013).
[7] N. J. Balmforth, N. Dubash, and A. C. Slim, J. Non-Newtonian Fluid Mech. 165, 1139 (2010).
[8] R. J. Furbank, and J. F. Morris, Phys. Fluids. 16, 1777 (2004). [9] C. Bonnoit, T. Bertrand, E. Cle´ment, and A. Lindner, Phys.
Fluids. 24, 043304 (2012).
[10] T. Bertrand, C. Bonnoit, E. Clement, and A. Lindner, Granular Matter 14, 169 (2012).
[11] M. Z. Miskin, and H. M. Jaeger, Proc. Natl. Acad. Sci. USA 109, 4389 (2012).
[12] M. I. Smith, R. Besseling, M. E. Cates, and V. Bertola, Nat. Commun. 1, 114 (2010).
[13] M. Roche´, H. Kellay, and H. A. Stone, Phys. Rev. Lett. 107, 134503 (2011).
[14] M. Renardy, J. Non-Newtonian Fluid Mech. 103, 261 (2002); M. Renardy, and Y. Renardy, ibid. 122, 303 (2004).
[15] P. Doshi, R. Suryo, O. E. Yildirim, G. H. McKinley, and O. A. Basaran, J. Non-Newtonian Fluid Mech. 113, 1 (2003); P. Doshi and O. A. Basaran, Phys. Fluids, 16, 585 (2004); R. Suryo and O. A. Basaran, J. Non-Newtonian Fluid Mech. 138, 134 (2006). [16] J. R. Savage, M. Caggioni, P. T. Spicer, and I. Cohen, Soft Matter
6, 892 (2009).
[17] F. M. Huisman, S. R. Friedman, and P. Taborek, Soft Matter 8, 6767 (2012).
[18] N. Louvet, D. Bonn, and H. Kellay, Phys. Rev. Lett. 113, 218302 (2014).
[19] N. Huang and D. Bonn, J. Fluid Mech. 590, 497 (2007). [20] A. Fall, A. Lemaˆıtre, F. Bertrand, D. Bonn, and G. Ovarlez,
Phys. Rev. Lett. 105, 268303 (2010).
[21] E. Brown and H.M. Jaeger, Phys. Rev. Lett. 103, 086001 (2009). [22] P. J. Zimoch, G. H. McKinley, and A. E. Hosoi, Phys. Rev. Lett.
111, 036001 (2013).
[23] A. Fall, F. Bertrand, G. Ovarlez, and D. Bonn, Phys. Rev. Lett. 103, 178301 (2009).
[24] M. Robert de Saint Vincent, J. Petit, M. Aytouna, J. P. Delville, D. Bonn, and H. Kellay, J. Fluid Mech. 692, 499 (2012). [25] A. U. Chen, P. K. Notz, and O. A. Basaran, Phys. Rev. Lett. 88,
174501 (2002).
[26] A. Rothert, R. Richter, and I. Rehberg, Phys. Rev. Lett. 87, 084501 (2001).
[27] M. E. Cates, M. D. Haw, and C. B. Holmes, J. Phys.: Condens. Matter 17, S2517 (2005).
[28] Y. Hennequin, D. G. A. L. Aarts, J. H. van der Wiel, G. Wegdam, J. Eggers, H. N. W. Lekkerkerker, and D. Bonn, Phys. Rev. Lett. 97, 244502 (2006).
[29] J. Petit, D. Rivie`re, H. Kellay, and J. Delville, Proc. Natl. Acad. Sci. USA 109, 18327 (2012).
[30] N. Huang, G. Ovarlez, F. Bertrand, S. Rodts, P. Coussot, and D. Bonn, Phys. Rev. Lett. 94, 028301 (2005).
[31] R.A. Bagnold, Proc. R. Soc. London, Ser. A 225, 49 (1954). [32] D. R. Foss and J. F. Brady, J. Fluid Mech. 407, 167 (2000). [33] F. Boyer, E´ . Guazzelli, and O. Pouliquen, Phys. Rev. Lett. 107,
188301 (2011).
[34] Z. Pan, H. de Cagny, B. Weber and D. Bonn, Phys. Rev. E 92, 032202 (2015).
[35] E. Brown and H. M. Jaeger, J. Rheol. 56, 875 (2012). [36] B. J. Maranzano and N. J. Wagner, J. Rheol. 45, 1205 (2001). [37] A. Fall, F. Bertrand, G. Ovarlez, and D. Bonn, J. Rheol. 56, 575