Publisher’s version / Version de l'éditeur:
Vous avez des questions? Nous pouvons vous aider. Pour communiquer directement avec un auteur, consultez la première page de la revue dans laquelle son article a été publié afin de trouver ses coordonnées. Si vous n’arrivez pas à les repérer, communiquez avec nous à PublicationsArchive-ArchivesPublications@nrc-cnrc.gc.ca.
Questions? Contact the NRC Publications Archive team at
PublicationsArchive-ArchivesPublications@nrc-cnrc.gc.ca. If you wish to email the authors directly, please see the first page of the publication for their contact information.
https://publications-cnrc.canada.ca/fra/droits
L’accès à ce site Web et l’utilisation de son contenu sont assujettis aux conditions présentées dans le site
LISEZ CES CONDITIONS ATTENTIVEMENT AVANT D’UTILISER CE SITE WEB.
Internal Report (National Research Council of Canada. Division of Building
Research), 1963-04
READ THESE TERMS AND CONDITIONS CAREFULLY BEFORE USING THIS WEBSITE. https://nrc-publications.canada.ca/eng/copyright
NRC Publications Archive Record / Notice des Archives des publications du CNRC : https://nrc-publications.canada.ca/eng/view/object/?id=daf90b5c-84ef-4c5a-8dc1-14925181643c https://publications-cnrc.canada.ca/fra/voir/objet/?id=daf90b5c-84ef-4c5a-8dc1-14925181643c
Archives des publications du CNRC
For the publisher’s version, please access the DOI link below./ Pour consulter la version de l’éditeur, utilisez le lien DOI ci-dessous.
https://doi.org/10.4224/20358556
Access and use of this website and the material on it are subject to the Terms and Conditions set forth at
Basement fallout shelter climate studies January-February 1962
DIVISION OF BUILDING RESEARCH
ANALYZED
BASEMENT FALLOUT SHELTER CLIMATE STUDIES JANUARY - FEBRUARY 1962
by
A. D. Kent, N. B. Hutcheon, G. T. Tamura and G. O. Handegord
Internal Report No. 264 of the
Division of Building Research
OTTAWA April 1963
The first report of experimental studies of conditions within a standard Canadian basement fallout shelter in Ottawa covered work carried out during 1961 (l). The studies now reported. carried out during 1962. involved winter trials only. to provide the opportunity for further exploration in the test house and shelter of basement temperatur es and basement ventilation. the latter having been shown to be a limiting factor. Additional summer trials during 1962 are
to be covered in another report. As in the previous studies. ventilation rates were measured directly using tracer-gas techniques. It was also possible. with the co -op e r ation of house builder s in Saskatoon who very kindly provided two unoccupied houses. to measure basement temperatures following cessation of heating for the more severe conditions of the Pr airie winter.
Mr. Kent who was immediately in char ge of the trials is a Research Officer in the Building Services Section of DBR/NRC. Dr. Hutcheon is the Assistant Director of the Division and represents the National Research Council on the Committee on Research of the Emergency Measures Organization. Mr. Tamura. also a Research Officer with the Building Services Section was responsible. as in the
1961 trials. for the ventilation measurements. while Mr. Hand e gor d, Officer-in-Charge of the Prairie Regional Station of DBR in Saskatoon or ganized the basement temperature studies carried out there.
Ottawa April 1963
R. F. Legget Director
JANUAR Y - FEBRUARY 1962 by
A. D. Kent, N. B. Hutcheon. G. T. Tamura and G. O. Handegord
Previous studies (l) of the environmental conditions or indoor climate in a basement fallout shelter under a simulated emergency situation showed that the adequacy of ventilation of the shelter for both winter and summer occupancy depended upon the basement ventilation rate. Calculations showed that an air change rate of O. 25 in the basement with a volume of 5800 cu it would be insufficient to limit the carbon dioxide to O. 5 per cent in the basement if fuel were burned in the shelter at the rate of 1/2 lb/hr. Consequently, the concentration of CO in the shelter which relies on basement air for air supply would be
セカ・ョ
higher. The accepted maximum allowableconcentration for CO
2 of 5000 parts per million (ppm) (0. 5 per cent (2» would appear to be conservative in view of recent studies (3) which
show that 15,000 ppm (1. 5 per cent) can be tolerated for periods of prolonged exposure without affecting the basic performance and such physiological functions as change of weight. blood pressure, pulse rate and metabolism.
The basement in which the 1961 trials were run (Figures 1, 2 and 3) was considered relatively tight, having only two small windows on the east side. It was thought that a typical basement would have six windows. two in each of the three side walls, but none in the front wall. Allowing for the fact that the corner shelter location would in all probability obscure one window, there should therefore be thre e additional windows to the two already existing. The question arose also of the effect of opening the basement door allowing greater exchange of air with the rooms upstairs. The possible use of the chimney or an outside connection for venting the shelter was also considered. Because of these considerations. further study and further winter trials were undertaken and are now reported.
WINTER TRIALS 1962
For the 1962 winter trials. the basement ventilation was modified by the provision of simulated window leakage openings. Five small openings were drilled in the basement walls at window mean
elevation each containing a short length of 1 1/2-in. 1.D. copper pipe grouted into the hole and fitted with a fly screen and removable rubber stopper (Figure 4). The inside diameter of the pipe was calculated on the basis of 2 cfrn per linear foot at O. 3-in. water pressure difference to give the same opening as the cracks around a typical basement window with loose fit. The addition of the fly screen which was not allowed for in this calculation resulted in a reduction which may have been as high as 50 per cent. This, however, was not determined. Two of these simulated windows were located on the north wall, one on the south wall remote from the shelter and two on the east wall beside the existing windows (Figure 2). Arrangements were made to tape up the cracks of the existing windows when the simulated window openings were in use.
The winter trials consisted of two consecutive periods of 16 and 14 days. For the first trial, 16 January to 1 February, the basement door to the upstairs was open and the simulated windows were closed. For the second trial, 1 to 15 February, the basement door was closed and the simulated windows were open. After nine days of this l4-day trial the shelter heating was discontinued to achieve unheated house and basement temperatures which would be compared with corresponding temperatures of houses in other locations, notably Halifax and Saskatoon.
During both trials, except for the latter part of the second trial, the shelter (Figure 5) was heated by means of three kerosene-burning cookers (Figure 6) each regulated to give an output of 2000 Btu/hr. One cooker was assumed to represent the heat output of five occupants and to produce CO at a rate equivalent to about 3/4 the rate of five persons. During the heated shelter periods of both trials the door from the shelter to the basement remained closed. No attempt was made to simulate exactly the moisture production of the five occupants as had been done in the previous winter trials, although the kerosene heaters did produce water in an amount determined by the hydrogen content of the fuel.
INSTRUMENTATION
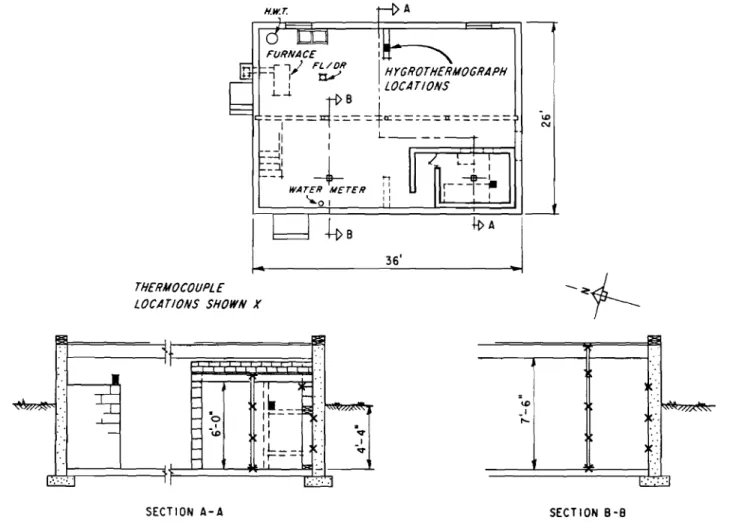
Continuous readings of air temperature and relative humidity were recorded by hygrothermographs located in the shelter and basement, and in the kitchen and living room upstairs. Air temperatures at the 26 - and 52 -In , levels above the floor in the shelter and at the 26-, 52 - and 78-jn , levels above the floor in the basement wer e recorded by thermocouples that were in the same arrangement as in the 1961
tests (Figure 3). Floor, ceiling and wall surface temperature measurements were also made as in the 1961 trials by means of thermocouples connected to a multi-point potentiometer recorder. An additional thermocouple
was located outside the north wall of the house to record the outside air temperature.
Ventilation rates of the basement and upstair s were measured by means of a katharometer using helium as a tracer gas. Carbon dioxide concentration was measured by means of an Orsat gas analyser with special pipette, samples being taken twice daily from the shelter and basement atmospheres. Carbon monoxide was checked daily in both the
shelter and basement by means of a small colorimetric type analyser using glass detector tubes.
TEMPERATURES
Air temperatures for the shelter and basement, as recorded by thermocouples and potentiometer recorder, are given in Figure 7; air temperatures for the shelter, basement, living room and kitchen, as recorded by hygrothermographs, are contained in Figure 8. Outside air temperatures based on the daily mean temperatures from midnight to midnight are given in both these diagrams for comparative purposes.
Surface temperatures for exterior shelter and basement walls are shown in Figure 9 and for floor and ceiling in both shelter and basement in Figure 10.
Comparison of the air te rnp e r atu r e curves as recorded by hygrothermograph and thermocouple shows a close a g r e ern ent between the shelter air temperatures as recorded by the thermocouple at the 52-in. elevation and the temperatures recorded by the shelter hygrothermograph which was located on the edge of the upper bunk adjacent to the 52-in. thermocouple. In the basement, the hygrothermograph was located at an
elevation of 5 it 8 in. above the floor but across the room from the
thermocouples; nevertheless, its air ternp e r atu r e readings corresponded closely with those of the 78-jn , elevation thermocouple.
Shelter air temperatures showed that a substantial gradient occurred from floor to ceiling of the shelter with the heating arrangement provided. Such a gradient is characteristic of small, high temperature heat sources such as stoves. The occupancy simulators used during the previous winter's trials did not produce such severe gradients. Between the 26- and 52-in. elevations, which corresponded roughly to the lower and upper bunk levels, there was a consistent difference of about 8 F deg regardless of the outside weather. Because of the heat losses through the structure, the floor and ceiling air temperatures were somewhat higher than those recorded for the corresponding floor and ceiling surface
temperatures. An estimate based on the latter would indicate a gradient of roughly 20 F deg in the floor to ceiling air temperatures in the shelter.
If the mean shelter air temper ature is taken as the mean between temperatures at the 26- and 52-in. elevations, it will be noted that the mean shelter temperature varied from about 78°F under mild winter conditions to approximately 67 ° F under _15° F outside temperatur e. Fluctuations in mean shelter temperatures from day to day were due in part to variations in the rate of fuel consumption of the heaters. Since these were refuelled twice daily it was difficult to obtain the identical flame height of all 6 wicks after each refuelling, although the average consumption over the test period was very close to the 46. 5 gm/hr required to give 2000 Btu/hr output of each heater. Variations in wick heights resulted in a day-to-day variation in the fuel output of each heater amounting to plus or minus 15 per cent of the mean.
Basement air temperatures showed little vertical gradient (Figure 7) and apparently little horizontal gradient judging by the close agr eement between the hygrothermograph ternp e r atur es on one side of the b a s ern ent space (Figure 8) and the thermocouple temperatures of the corresponding 78 -in. elevation (Figure 7) across the space. During the coldest period of the tests i , e. after 5 days of _5°F outside mean temperature and below, the mean basement air ternperature fell to 31°F and was falling at the rate of about 2°F per day. An extended cold spell of 7 or
e
days below _5°F would likely result in mean basement air temperatures of 28 to 30°F with corresponding shelter air meantemper atur es of about 65° F as suming a constant heater output of 4000 Btu/hr besides the body heat of five occupants. It should be noted, however,
that the cold period was relatively severe. The temperature for Ottawa representing a 10 per cent occurrence based on total hours in January on a long-time basis is _5° F, but the temperature during the trials remained consistently below this level for 5 days, or 16 per cent of the month.
Upstairs air temperatures in the kitchen and living room followed the same general pattern as the basement air temperatures but with slightly greater variations because of outside weather changes. Generally speaking, the upstairs air temperatures were 5 to 10 F deg below those of the basement during the period when the basement door was left open. With the basement door closed, upstairs temperatures dropped to lower levels than with the door open when cold weather periods occurred, the lowest upstairs temperature being 16°F in the kitchen after the 5-day period of severe weather at the end of January.
RE LAT IVE HUMIDIT Y
The record of daily relative humidities as obtained from hygrothermographs in the shelter, basement and upstairs, and based on the noon readings is given in Figure 11. No attempt was made to
reproduce completely the total moisture output of five persons by
occupancy simulators. The rate of moisture produced by five persons would be approximately 300 gm/hr, whereas the moisture output of one heater adjusted to give the equivalent heat output of five people is
roughly 54 gm/hr. The relative humidity values given in Figure 11 are therefore not representative of the values that would prevail under actual occupancy conditions. It is interesting to note the interchange in position of the upstairs humidity curves with the basement humidity
curve following the closing of the basement door. The shelter relative humidity remained between 22 and 28 per cent except when the shelter heat was turned off on 10 February when it rose over a 5-day period to 53 per cent, or within 5 per cent of the relative humidities of the basement and upstairs.
VENTILATION
The shelter and basement ventilation tests conducted during the winter of 1961 (4) indicated that the r ate of air flow into the heated shelter was much greater than the rate of air flow into the basement. With the air temperature difference between the shelter and the basement
air of 26°F, the shelter ventilation rate measured was 7.8 air changes/hr or an air flow of 52 C£m through the vent openings. The minimum basement ventilation rate recorded was 0.25 air change/hr or an air leakage flow of 24 cfm , It can be said that the amount of outdoor air brought into the shelter by natural ventilation is governed by the basement ventilation rate.
Two series of tests were carried out in the present trials to investigate further the ventilation characteristics of the b as ern ent , During the first series of tests, ventilation measurements were made to determine the effect of an open basement door (between basement and kitchen) on the basement ventilation rate. For the second series of tests, the two basement windows were sealed and replaced by five simulated windows to provide the ventilation openings of a typical basement. With this configuration and the basement door closed ventilation rates were measured in the basement. The ventilation tests conducted together with the Orsat gas analysis test performed were intended to provide a
basis for estimating the probable levels of CO concentration in the
. 2
VENTILATION TESTS AND RESULTS
During the ventilation tests, air temperatures of the basement, living room, and outdoors were recorded, and the wind speed and
direction were measured with an anemometer mounted 25 ft above the ground on a mast attached to the side of the house.
The fir st series of tests was carried out with the basement door open to permit exchange of the upstairs air with the basement air. Two katharometers were used to measure the helium decay rate
upstairs and in the basement; the upstairs katharometer was placed
inside the dining room close to the hallway and the basement katharometer was placed in a central location. The first two ventilation tests were conducted with the helium released in the ba sern ent , The helium concentration in the basement rose to its maximum concentration in 18 min. The upstairs helium concentration reached its peak in
approximately 1 hr after the helium was released and then approached the basement decay curve. The ventilation rates for upstairs and basement were calculated from the portion of the helium decay curve after the peak of the upstairs helium concentration. The next two measurements were obtained by releasing the helium inside the warm air supply duct of the heating system with the fan operating to obtain the same initial helium concentration upstairs and in the basement. After the helium concentration reached its peak level, the fan was turned off and the helium was allowed to decay with the natural ventilation. The results of this series of four tests are shown in Table I.
TABLE I
VENTILATION TESTS - FIRST SERIES
(Basement Door Open - Simulated Windows Closed)
Ventilation
Rate Wind Speed Air Temperatures
Air Change /Hr (mph) OF
Date Basement Upstairs Direction Outside Basement Living Room
24/1/62 0.21 0.21 8 SW 34 45 41
25/1/62 0.17 0.17 8W 37 48 45
26/1/62 0.29
O.
20 9 NE 11 45 38/
During each ventilation test, a smoke test was conducted to determine the direction of the air flow through the open basement door and through the chimney. As expected, due to the temperature
difference of the upstair s and basement air, the direction of flow was downward near the bottom of the doorway and upward near the top of the doorway. The smoke tests at the barometric damper indicated that during all four ventilation tests the air flowed from the basement to the chimney by way of the barometric damper.
The observed high rate of rise of helium concentration in the upstairs rooms when helium was introduced into the basement provided evidence but no opportunity for determining a substantial air exchange between basement and upstairs. The occurrence of this exchange complicates the interpretation of the results of Table I since the values given for air change are nominally related to the respective room
volumes and do not take into account the possible transfer of the helium tracer gas from one space to the other during the measurement period.
In an attempt to obtain some further evidence of this, two further ventilation tests were conducted. The basement windows and the barometric dampers were sealed, and to prevent the helium from entering the basement from upstairs two outside doors were left ajar 2 in. at the free end thus keeping the upstairs helium concentration at a negligible level. During the release of helium the basement door was kept closed and after the helium reached a maximum concentration the basement door was opened. With the upstair s door open the upstair s air temperature dropped only 2°F during the ventilation test. The
helium decay curves recorded in the basement indicated that the rates of exchange were 1. 4 and 1. 2 air ch an g e sj/hr based on the basement volume for temperature difference of 9 and 10° F respectively. Although the windows and the barometric damper were sealed, air leakage through the heating appliance and the basement wall probably contributed to the air exchange rate. The actual rate of air exchange is probably somewhat less than the values obtained.
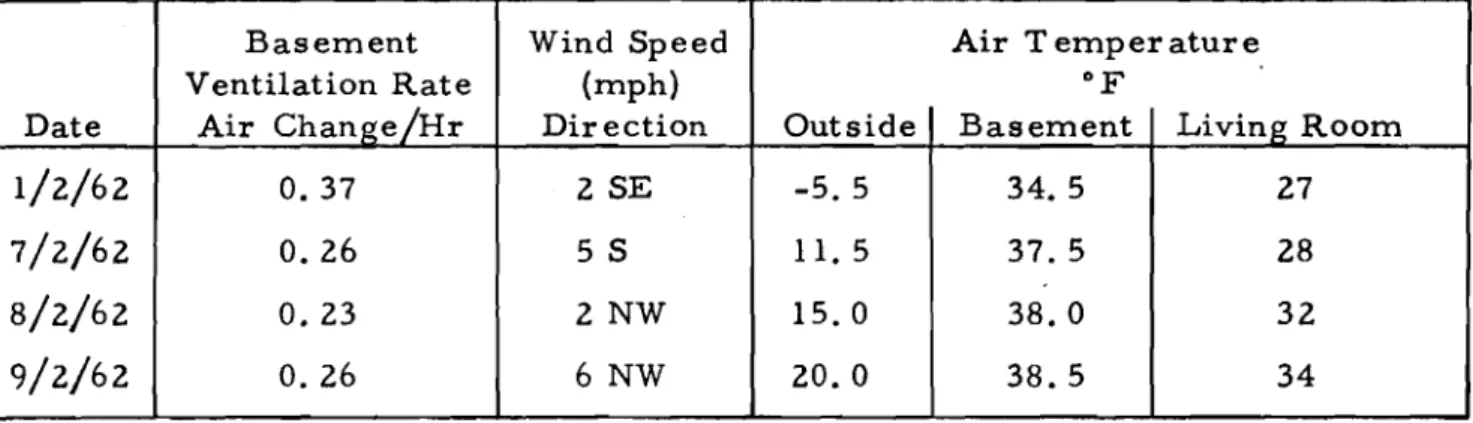
The second series of tests was conducted with the existing windows sealed and replaced by five simulated window openings. With the basement door closed and the plugs in the simulated windows removed four basement ventilation rates were obtained. The results of the tests are shown in Table I I. Smoke tests conducted during three of the four ventilation tests indicated that the outside air flowed into the basement through all simulated windows, and upstairs air flowed down into the basement through the I-in. gap below the basement door. The combined ventilation air passed through the barometric damper and up the chimney. Helium was released only in the basement. Measurements of helium
concentration upstairs indicated a relatively small air interchange between the basement and upstairs.
TABLE II
VENTILATION TESTS - SECOND SERIES (Basement Door Closed - Simulated Windows Open)
Basement Wind Speed Air Temperature
Ventilation Rate (mph)
OF
Date Air Chang:e/Hr Direction Outside Basement Living Room
1/2/62 0.37 2 SE -5.5 34.5 27
7/2/62 0.26 5 S 11. 5 37.5 28
8/2/62 0.23 2 NW 15.0 38.0 32
9/2/62 0.26 6 NW 20.0 38.5 34
DISCUSSION OF RESULTS OF VENTILATION TESTS
The first series of tests carried out to determine the effect of the open basement door on the basement ventilation rate indicated that because of the difference in the density of the basement and upstairs air substantial exchange of air takes place through the open basement door. Two tests conducted to determine this rate of exchange gave
1. 2 and 1.4 air chang e sj/hr based on the basement volume. If it can be assumed that due to this exchange rate the basement and upstairs air
are thoroughly mixed, then the ventilation rates measured in the basement and in the r oorn s upstairs can be regarded as the house ventilation rate. Assuming that upstairs and basement volumes are equal, the ventilation rates may be averaged to obtain an approximate house ventilation
rate. The ventilation rate based on the basement volume would then be twice this value (T able I I I).
TABLE III
HOUSE AND BASEMENT VENTILATION RATES
Measured
Ventilation Rate Avg Ventilation Rate Effective Ventilation Rate
Air Change/Hr Basis House Vol Basis Basement Vol
Date Basement Upstairs Air Change/Hr Air Change/Hr
24/1/62 0.21 0.21 O. 21 0.42
25/1/62 O. 17 0.17 O. 17 0.34
26/1/62 O. 29 0.20 0.25 0.50
29/1/62 O. 16 O. 18 0.17 0.34
The basement ventilation rates thus obtained axe compared with the basement ventilation rates measured during the 1961 winter tests as shown in Figure 12. The comparison shows a slightly higher ventilation rate with the basement door open, but because of the
limited number of test points, the amount of increased ventilation rate is difficult to ascertain. It would appear from the graph that the open basement door has little effect on the basement ventilation rate. During the test period, upstairs windows were heavily frosted which probably
sealed the cracks around the window: It is possible that because of this frost, air infiltration and exfiltration occurred mostly in the basement.
So far the discussion has been based on ventilation rates. Of greater interest, however, is the infiltration rate into the basement of air free of added CO , i ,e. outdoor air, to control the basement CO
2 level. It is evident
エセ。エ
the exchange of air between basement and upstairs complicates this determination. The conclusion reached, however, after a comparison of test results is that opening the basement door did not greatly increase the amount of outside air entering the basement. It is possible that the sealing of ground floor windows by condensation may have been a factor in producing this result since with basement door open. moisture from the basement could pass freely to the windows. No careful observations of window condensation were made during the first winter but it is believed that windows were relatively free of frost. An openingsuch as a broken or otherwise opened window, either in the basement or upstairs with the basement door open,would markedly raise the basement ventilation rate above the normal rate experienced under ordinary
The results of the tests conducted with the simulated windows are plotted and compared with the ventilation rates obtained during the
1961 winter tests (Figure 13). In both cases, the basement door was closed. This graph shows little change in the ventilation rates with
the simulated windows. As indicated by the smoke test, the air infiltrated through all simulated windows and through the I-in. gap below the
basement door. Basement air was lost through the barometric damper and up the chimney and probably through the cracks around the floor registers and duct work to the rooms upstairs. The basement
ventilation rate might have been increased by locking the barometric damper in the wide open position so that the chimney could have acted as a more positive vent for the basement air.
Assuming a constant minimum ventilation rate of 0.25 air change/hr the CO
2 concentration in the basement and in the shelter was calculated. The level of CO
2 concentration in the basement and in the shelter with constant CO production and a known ventilation rate may be computed from the fotlowing equation. (A uniform distribution of CO concentration in the basement and in the shelter is assumed. ) 2
where Basement
dc
tft
Shelter c = M - k +Pk V s s s M = rate of CO 2 production c=
volume of CO 2 . Vb = basement volume - 5800 ft3 V=
shelter volume _ 400 ft3 sk = air infiltration rate in the shelter s
セ = air infiltration rate in the basement
P
=
CO2 concentration in the basement, per cent.
At steady-state conditions the above expressions become:
Basement Shelter
=
Mセ
c V s M= -
+
P k sThe total rate of CO
2 production in the shelter from the five occupants and the two kerosene heaters (2000 Btu/hr each), taking 0.7 £t3/hr for each occupant and 2.75 ft 3/hr for each kerosene heater, is 9 ft 3/hr. The CO
2 levels in basement and in the shelter for the heated and the unheated shelter were calculated for various rates of basement ventilation and are shown in Figure 14. Taking the minimum rate of measured basement ventilation rate of 0.25 air change/hr, the CO
2 concentration in the basement of a house with a heated shelter is O.62 per cent. Assuming uniform distribution of CO
2 in the shelter and with a shelter ventilation rate of 7.8 air changes/hr as found in 1961, the CO
2 concentration in the shelter is 0.90 per cent. These figures apply to the case with 4000 Btu provided from open heaters. The extreme case with fuel being burned at l/Z Ib/hr would provide
about twice these CO concentrations. It can be expected that the COZ concentration in the lhelter air is higher at upper levels than at lower levels. By venting the combustion products from the kerosene heaters into the basement, the CO
2 concentration in the shelter can be reduced. The amount of reduction of the CO
2 concentration depends on the venting arrangement and is limited by the basement CO concentration. As shown in Figure 14, with a basement ventilation rate
01
o.
Z5 air change/hr, the COZ level inside the heated shelter, with two heaters pr ovidin g a total grossinput of 4000 Btu/hr, is above the accepted maximum allowable concentration of O. 5 per cent. The CO concentration is below the tolerable limit of
1. 5 per cent above which 1evel the basic performance and the physiological function of the occupants begin to be affected.
Measurements of COZ with the modified Orsat apparatus were inconsistent with these small concentrations of COZ. Efforts to
overcome these inconsistencies were unsuccessful and it was concluded that infra-red gas analysis equipment would be necessary for such measurements. The readings obtai.ne d.however , roughly substantiated the calculated values. .F'ur the r tests using more suitable gas analysis
equipment are indicated.
CARBON MONOXIDE CONCENTRATION
Daily readings of CO taken at mid-height in the shelter and in the basement showed no greater than 0.001 per cent CO based on readings of the colorimetric test equipment. An infra-red analyser for CO was operated briefly, taking readings of the shelter air through one of the upper vent openings. Readings of CO at this location and with this instrument varied between O.00Z3 and O.00Z7 per cent CO with corresponding colorimetric check readings yielding approximately
0.002 per cent. It was apparent that the ventilation rate in the shelter was adequate to keep the concentration of CO well below the maximum allowable concentration of 0.01 per cent.
ODOUR AND SOOT ING
When entering from outside there was considerable odour in the shelter and basement from the unvented kerosene heaters used in the tests. After a 5- to 10-min exposure to this atmosphere, however, the odour was found to be much less objectionable and after about 15 min it seemed hardly noticeable. No ill effects were experienced by the per sonnel conducting the tests even after 8 -hr exposures to the basement atmosphere.
There was some sooting of the shelter interior on the few occasions when the heater flames were adjusted too high. With wick type burner s it is evident that even a trace of smokiness in the flame will create soot deposits on the upper walls and ceiling of the shelter in a few hours. To minimize odour and sooting and possibly also the production of CO it is therefore essential that wick type burners be operated below the critical point where smoky flame tips occur.
UNHEATED HOUSE TEMPERATURES - OTTAWA
It was unfortunate that the weather turned mild when all heat was turned off in the shelter on 10 February, and therefore the unheated basement and house temperatures were not representative of severe weather conditions.
During the pr evious winter trials of 1961 (1) the living room and basement temperatures had fallen to approximately 20 and 30°F respectively during a 5-day period at about _7°F outside temperature, but on this occasion the heat input equivalent of five occupants was maintained in the shelter. It is expected that somewhat lower
temperatures will prevail under the same outside weather conditions with the heat entir el y shut off in both the house and shelter. Further tests in the Ottawa residence used for these studies are contemplated.
TEMPERATURE DECAY IN HOUSES - SASKATOON
Studies carried out in 1961 in Ottawa in connection with the environment in basement fallout shelters indicated that temperatures
below freezing might occur in the basements of houses in the 2 weeks following power shut-off. The temperatures experienced in the basement of the house under test suggested that alar ger output heating device than was used might be necessary when outside temperature conditions fall to lower values than those that were experienced during the test. In order to obtain additional field information in this regard,
arrangements were made to measure temperatures in Saskatoon houses during cold weather periods following shut-off of all electrical and gas services. The results of the tests conducted on two houses during January of 1962 are now reported.
Description of Houses
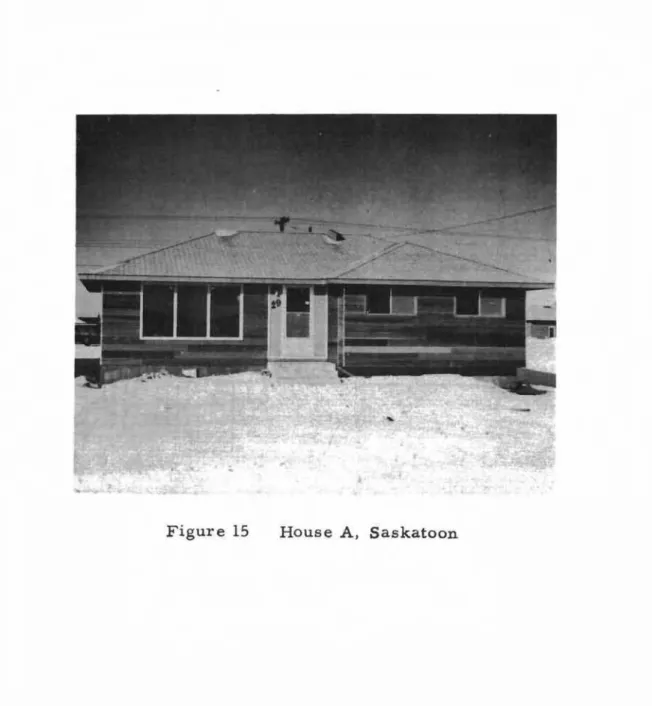
The houses studied were bungalows with a full basement, approximately 1000 sq ft in plan area, and typical of most new houses in the Prairie area. Both were located on Cantelon Crescent in the southeast section of Saskatoon, and were oriented in almost the same direction, south. Both were constructed according to National Housing Act standards.
House A is shown in the photograph of Figure 15 having a floor plan as shown in Figure 16. This house was complete at the time of the test except for interior door s and trim, finish flooring, exterior doors and paint. At the rear entrance there was only a finished storm door and at the front entrance only a poorly fitting, temporary plywood door. Windows were of a horizontal sliding type (Insul-Wray) in all rooms except the living and dining rooms, where sealed, double-glazed units were installed.
House B is shown in Figure 17; its floor plan is shown in Figure 18. It was completed except for the exterior stucco portion and exterior painting. Windows were of the horizontal sliding, sashless type (Pierson) except for the living room, which had a sealed, double-glazed unit. Both main and storm doors were installed at front and rear
entrances.
The air leakage characteristics of the two houses under normal heated conditions were determined using a katharometer technique with helium as a tracer gas. These tests indicated that the rate of air leakage of House A was approximately 0.6 air change/hr, and approximately O. 7 air change/hr for House B, during the same period.
Test Procedure and Results
Temperatures and humidities were recorded using a 7-day chart thermohygrograph at three locations in each house, at the 3-ft level on
the main floor, the 4-ft level in the basement, and at floor level in the corner of the basement which would be the likely location of a shelter. The plan locations of the three instruments in each house are shown in Figures 16 and 18. In House A, the recorder at basement floor level was only used during the last 2 days of test. Prior to the test,
arrangements were made by the contractors to drain all plumbing to avoid damage from freezing. Approximately two hours after installation of the recorders, all gas and electric services were discontinued and measurements were continued for approximately 6 days. The tests were terminated at this time and services reconnected because of the risk of the soil freezing beneath footings.
The temperature and humidity records obtained are shown in Figure 19. Corresponding outside temperature, wind velocity and total daily solar radiation data are also included in this Figure. In both cases, outside temperatures in the range of -10 to -30°F
were experienced, and basement temperatures fell well below the freezing point. At the end of the 6-day period, basement air
temperature at the 4-ft level was approximately 40 to 45 F deg above outside air temperature and about 10 deg above the night-time air temperatures of the living room. In general the shelter ar ea floor location showed air temperatures 2 to 5 F deg lower than those at the basement 4-ft elevation.
The significance of these results must be judged in relation to the severity of the weather experienced during the test period. The
10 per cent hourly occurring temperature in January for Saskatoon is -25°F. This temperature or lower occurred for 30 hr (4 per cent of hours in January) during the test period with mean temperatures
generally below _10°F for the latter part of the test period. The weather was therefore moderately severe. Further studies of the incidence of low temperature periods ar e being made.
CONCLUSIONS
1. In a basement fallout shelter of this type and size. occupied by five persons, the heat output of two kerosene cookers operating at approximately 2000 Btu/hr each would be adequate to maintain a mean shelter air temperature of about 70°F even during a 5-day period with outside air mean temperatures continuously below _5°F.
2. A drop in outside air mean temperature from 30°F to _14°F over an 8-day period will result in a drop in mean shelter
temperature of only about 12 F deg over the same period provided the occupied shelter is heated continuously by two heaters with approximately 2000 Btu/hr heater output each.
3. With the basement door open to the upstairs the
temperatures in the kitchen and living room were 5 to 7 F deg higher than when the basement door was closed under comparable outside weather conditions.
4. Two unvented kerosene cookers of the double flat wick type can be operated continuously within the occupied shelter during the winter without exceeding the limiting 1. 5 per cent CO
2 concentration in the shelter provided the basement ventilation rate is not less than 0.15 air change/hr, and the shelter ventilation rate not less than 7. 8 air changes/hr.
5. Opening the basement door to the upstairs resulted
in only a small increase in the basement ventilation rate. It is probable that a greater increase in basement ventilation rate can be obtained by locking the barometric damper in the open position thus utilizing fully the chimney as a vent shaft, or by opening a window. either upstairs with the basement door open, or in the basement itself.
6. Flat wick type kerosene burners can be operated in the shelter with no special venting arrangements without serious odours or sooting provided flames are adjusted below the critical point where smoky flame tips occur.
7. In winter climates similar to that of Saskatoon basement temperatures in unheated houses will fall well below the freezing point. At the end of a 6-day period with outside air temperatures from -10 to
_300
F, basement ternp er-atur e s at the 4-ft level would be expected to be 40 to 45 F deg above outside air temperature.
REFERENCES
1. Kent, A. D. and N. B. Hutcheon. Basement fallout shelter climate studies 1961. National Research Council, Division of Building Research, Internal Report No. 243, Ottawa, January 1962.
3. Schaefer, K. E. A concept of triple tolerance limits based on chronic CO
2 toxicity studies. Proceedings of the meeting on Environmental Engineering in Protective Shelters. National Academy of Sciences, National Research Council. 4. Tamura, G. T. Ventilation measurements in a basement fallout
shelter. National Research CounciI, Division of Building Research, Internal Report No. 246, Ottawa, March 1962.
<D N
l
セL, , " "-+
WATeR MeTeR '...01 IHYGROTHERMOGRAPH .L 'LOCATIONS __セ
__ t?_B_ - 'a:- ----n---1---9=-- -"f --- ---Ii _JI --IMセZjェ
I.
bed
4,
36'!P,
J
THERMOCOUPLE LOCATIONS SHOWN XMセヲMMM
セ セQ....
1 .: Jセ
" セMZ;'
;r:=-:
, ' :11_-
セG セ -' 0 It-- - J .' II <l> I' ',.
, ,.,.
I--<•
,L.'
Ir.,.
... ... j ..' -a ::s:: " ='"
.1 e-, .. .. ...
SECTION A-A SECTION B-B
FIGURE 3 LAYOUT OF BASEMENT
SHELTER HEAT OFF 4 6 8 10 12 14
I
FEBRUARY 1962 SHELTER AIR 52" ELEV 26" ELEVo
-10 - 20 L.--..L----L.---l..-l-...L-....L-...L-.l...-L...L--J...L-....l-...L-....L-.L...-...- - ' - - - ' - - - ' - . . . . l -...L...-.l...-...- - ' -... 16 18 20 22 24 26 28 30I
2 JANUAR)' 1962 90 80 70 l.L 60 0 セ I.&J a:: 50 ::::> l -e::( et: 40 I.&J a. ::!: I.&J 30 I-et:-
20 e::( 10FIGURE 7
AIR TEMPERATURES AS RECORDED BY THERMOCOUPLES
(BASEMENT FALLOUT SHELTER CLIMATE STUDIES
SHELTER HEAT OFF 4 6 8 10 12 14
I
FEBRUARY 1962 BASEMENT AI R OUTSIDE AIR セ ,\ "-Gセ/ -;
セカO'\
Lセ'- - - - -. ,-
/ / "
セ LLMセ セL IJ\
\ " ..' セセ P \ ''\><:.. , KITCHEN AIR セNN /1 GNNN[セ\
/.' ...-s.> "\
. : -10 - 20 L....JI...I---L--.I...-I--I-...l---l.-...l....-...l-...I...I---'"---'-.-I-...- ' - -...I...-.l...-...---'"---'----'-...- 1 -.... 16 IB 20 22 24 26 28 30I
2 JANUARY 1962 100 90 80 70 LL 60 0.
W 0: 50 =:> I-<f 0: 40 w a.. セ w 30 I-0:-
20 -er 10 0FIGURE 8
AIR TEMPERATURES AS RECORDED BY HYGROTHERMOGRAPHS
(BASEMENT FALLOUT SHELTER CLIMATE STUDIES
80 SHELTER WALL 70 LL. 0
-w a: 60 ::::> f-<{ a: w a. セ w 50 BASEMENT WALL f-w u « LL. a: ::::> 40 (J)..
... 30 16 18 20 22 24 26 28 30I
2 JANUARY 1962 SHELTER HEAT OFF 4 6 8 10 12 14I
FEBRUARY 1962FIGURE 9
WALL SURFACE TEMPERATURES (BASEMENT FALLOUT SHELTER
CLIMATE STUDIES - JAN-FEB 1962)
80 70 SHELTER CEILING SHELTER HEAT OFF ...
,
/ \ ".I' , _ _ -' - _ / .... ....,
...."
...セ BASEMENT FLOORI
,
,
"
,
-, ....... .... SHELTER FLOOR BASEMENT CEILING ...,
,
..."
,J,
....
-,
/"
, , - - - - _ / <» ",
30 l.L.. o.
\.LJ cr::: 60 :::> I-« cr::: \.LJ a.. :::i: \.LJ 50 I -\.LJ U « l.L.. cr::: セ 40 16 18 20 22 24 26 28 30I
2 JANUARY 1962 4 6 8 10 12 14I
FEBRUARY 1962FIGURE 10
FLOOR AND CEILING SURFACE TEMPERATURES (BASEMENT
FALLOUT SHELTER CLIMATE STUDIES - JAN-FEB 1962)
---SHELTER HEAT OFF 4 6 8 10 12 14
I
FEBRUARY 1962 20 セBBBBBBB⦅i⦅⦅⦅ャN⦅⦅lN⦅⦅⦅iN⦅NNNNNNjNNNNNNNNjNNN⦅NNャNNNNNNNNNlN⦅NNNlNNN⦅ ...____L.___'___'___'_...セ⦅G⦅⦅NNiNN⦅⦅NNNlNNN⦅ ...____L...___'"____'"_... 16 18 20 22 24 26 28 30I
2 JANUARY 1962 70 I -Z W U a:: 60 w "/ a... / , / " " セ / ,.,- _ / --" >- / I I - / I-
セ BASEMENT Cl 50 /-
( " セ "" ::J I ; ' ; ' :c I"
I j"I W > 'I I - 40 I <:{ I ...J W I a:: 30FIGURE II
RELATIVE HUMIDITIES AS RECORDED BY HYGROTHERMOGRAPHS
(BASEMENT FALLOUT SHELTER CLIMATE STUDIES
LEGEND WD-NW ·60
+
BASEMENT DOOR OPENa:: BASEMENT DOOR CLOSED
::I:
•
<, ORIGINAL BASEMENT WINDOWS
V'J
w aT BASEMENT AND OUTDOOR aT-34°F
<..:)
/ WD- NE
z AIR TEMPERATURE DIFFERENCE
<l: -50
+
::I: WD WIND DIRECTION
u a::
-<l:+
(aT-16 of w ·40 aT-43°F ,aT-10°F WD-W I - WD- SW <l: (WD-NE•
a:: z+
+
0-
,aT-11°F•
I - ·30 WD - W <l: \aT-285°F ....J-
セN WD- E I -Z aT-23°F w > WD-E I - -20 z w :E w V'J <l: co -10o
o
2 4 6 8 10 WIND SPEED, MPH 12 14 16FIGURE 12
BASEMENT VENTILATION RATE WITH BASEMENT DOOR OPEN
811 217"-0LEGEND
セTPf
a:: ·60 X SIMULATED WINDOWSWD-NW
::I:
•
BASEMENT DOOR CLOSED<,
o» ORIGINAL BASEMENT WINDOWS
w
セ dT BASEMENT AND OUTDOOR
z
セ ·50 AIR TEMPERATURE DIFFERENCE
u WD WIND DIRECTION a::
-<X w ·40 dT - 40 of dT-16°F I-.f
WD - SE IWD-W <X a::•
z dT-28'5 of 0 (WD-E セ ·30sr -
23 OF"•
-J WD-E ' " dT-18'5 of-
x,-
WD- NW l -•
X z 'dT - 26 OF w X--.... > I - ·20 l1T - 23 OF Wi> - S z WD-NW w セ w (/) <X co ·10o
o
2 4 6 8 10 WIND SPEED. MPH 12 14 16FIGURE 13
BASEMENT VENTILATION RATE WITH SIMULATED WINDOWS
8/1 :l870· 7---BASEMENT VOLUME - 5800 FT3 SHELTER VOLUME - 400 FT1
HEATED SHELTER - 7'8 AIR CHANGES I HR UNHEATED SHELTER - 4·1 AIR CHANGES/HR LEGEND
5 OCCUPANTS IN UNHEATED SHELTER 5 OCCUPANTS IN HEATED SHELTER
(WITH 4000 BTUI HR IN UNVENTED HEATERS)
\
\\
"
\
'-,!/i
Cl rC/? '\ 8 <, <, ,4SC41 _ -sセ」N <, c4'1' _エNャGヲGBセ
...\
\
\
\
\ \
\
\\
\
\
\\
\
\
\\
\
2·5o
'5 z o 2'0 l -ex a: l -Z l.LJ セ 1·5 o u N o U -;re 1'0 • I ·2 ·3 ·4 ·5 ·6BASEMENT VENTILATION RATE I AIR CHANGES/HR
·7 ·8
FIGURE 14
BASEMENT VENTILATION RATE VS CO 2 CONCENTRATION IN THE
BASEMENT AND IN THE SHELTER
2-30" X 30" -INSULWRAY- Z - 30"00" 3- 36 X60' THERIIOPANE GROUND FLOOR -J, セ -N "' Z ... KITCHEN Go BEOROOM 0 '"' ON
..
"' i= ' " , ... >< DINING ROOM ' " ,...
'0, ' 0 , - " , -... N N LIVING AREA RECORDER 3' LIVING ROOM BEDROOM BEDROOM 1'-0" X Z'-8" I'-O"XZ'-8" 11---11 セ II II "
UP l⦅セ '-,--.,
MMMMM⦅NセMMMMMMM-' - _ o j CHIMNEY
GBGGGGGセ
{セZ
r-'" セMセNLf---+e-+---
I I lセ⦅T lセ⦅セ セセbasement
RECORDER AT 4' HEIGHT セshelter CORNER RECORDER L. ON FLOOR セ BASEMENTJ.
N I FIGURE 16BEDROOM I "0 .' セ N ';' ' " , '"
...
.N' I N OINING ROOM LIVING ROOM KITCHEN HALL)
LIVING AREA RECORDER CAT 3' HEIGHT '
-= \/
BEDROOM 2 2-2'-6"X 2"6" PIERSONII
V
BEDROOM 3 2-2'-6"X2'-6" PIERSON '0 o"'"
N g'-O"X 4'-0" THERMOPANE GROUND FLOOR "-0" X2'-10" o I N '" oイセ
II
r--, I 1 0 1L_.J UP·
cr
·
· r--, r---, r - - '-
to
!-/'0
I - I o 1 -I I I,
L __.J L __.J L __.Jセbasement
RECORDER AT 4' HEIGHT CSHELTER CORNER _ RECORDER ON FLOOR BASEMENTJ.
N I FIGURE 18 HOUSE "B"BASEMENT (4' LEVEL) SHELTER AREA FLOOR
• • • • • • • • j • • • • • • • • •
161 151
LIVING AREA (3' LEVEL) SHELTER AREA FLOOR
114
I
142I
126I
119SOLAR RADIATION IN LANGLEYS
93 108 59 ;:::!: -・セ ::!:I- 60 : : : J -:r u0 w-l 40 > w - > 1- 0 20 <1: 2 -l _ セセ
a
65 HOUSE A BASEMENT (4' LEVEL) LIVING AREA (3' LEVEL) SHELTER AREA FLOORHOUSE B
BASEMENT (4' LEVEL) SHELTER AREA FLOOR LIVING AREA(3' LEVEL)
80 lJ... 60 0 W et:: 40 :::J I-<I: et:: 20 w a.. ::!: w 0 I-et:: :; -20 -40 II 12 13 14 15 16 17