HAL Id: hal-01389998
https://hal.inria.fr/hal-01389998
Submitted on 18 Nov 2016
HAL is a multi-disciplinary open access
archive for the deposit and dissemination of
sci-entific research documents, whether they are
pub-lished or not. The documents may come from
teaching and research institutions in France or
abroad, or from public or private research centers.
L’archive ouverte pluridisciplinaire HAL, est
destinée au dépôt et à la diffusion de documents
scientifiques de niveau recherche, publiés ou non,
émanant des établissements d’enseignement et de
recherche français ou étrangers, des laboratoires
publics ou privés.
An Exploratory Study of Word-Scale Graphics in
Data-Rich Text Documents
Pascal Goffin, Jeremy Boy, Wesley Willett, Petra Isenberg
To cite this version:
Pascal Goffin, Jeremy Boy, Wesley Willett, Petra Isenberg.
An Exploratory Study of
Word-Scale Graphics in Data-Rich Text Documents.
IEEE Transactions on Visualization and
Com-puter Graphics, Institute of Electrical and Electronics Engineers, 2017, 23 (10), pp.2275-2287.
�10.1109/TVCG.2016.2618797�. �hal-01389998�
An Exploratory Study of
Word-Scale Graphics in Data-Rich Text
Documents
Pascal Goffin, Jeremy Boy, Wesley Willett, and Petra Isenberg
Abstract—We contribute an investigation of the design and function of word-scale graphics and visualizations embedded in text
documents. Word-scale graphics include both data-driven representations such as word-scale visualizations and sparklines, and non-data-driven visual marks. Their design, function, and use has so far received little research attention. We present the results of an open ended exploratory study with 9 graphic designers. The study resulted in a rich collection of different types of graphics, data provenance, and relationships between text, graphics, and data. Based on this corpus, we present a systematic overview of word-scale graphic designs, and examine how designers used them. We also discuss the designers’ goals in creating their graphics, and
characterize how they used word-scale graphics to visualize data, add emphasis, and create alternative narratives. Building on these examples, we discuss implications for the design of authoring tools for word-scale graphics and visualizations, and explore how new authoring environments could make it easier for designers to integrate them into documents.
Index Terms—Word-scale visualization, word-scale graphic, text visualization, sparklines, authoring tool, information visualization.
F
1
I
NTRODUCTIONI
N this article, we explore a variety of applications forword-scalegraphics (e. g. , , , Ca) embedded in
text documents. We focus on how authors can use these graphics to emphasize elements in the text and to present data. Word-scale graphics can help support many forms of written discourse and can be used in a variety of different media. Some are data-driven; these have been referred to as sparklines [1], micro visualizations [2], or word-scale visualizations [3]. Others are not. As graphical supplements to written text, word-scale graphics can be used to emphasize specific elements of a document (like words or sentences), or to provide additional information. They can also enable visual comparison of data points, communicate complex relationships between elements of the text, or simply highlight values in the text to facilitate understanding.
In contrast to larger graphics and visualizations, word-scale graphics allow the reader to remain focused on the text, as they are set within the text, rather than alongside it. As such, word-scale graphics have the potential to deeply change the form and meaning of a written document, and designing and integrating them requires important editorial, rhetorical, and design decisions.
Previous examinations have focused mostly on contrasting data-driven word-scale graphics (or word-scale visualizations) with larger, more-fully featured data graphics [1], [2], [3], [4]. However, researchers have not explored the broader space of possible word-scale designs or potential uses for them. The rhetorical impact of word-scale graphics remains similarly unexplored, as is the process of authoring and integrating them with text. As a result, most guidelines on where and how to use word-scale graphics are
● P. Goffin is with Inria, Universit´e Paris Saclay. E-mail: pas-cal.goffin@inria.fr
● J. Boy is with New York University. E-mail: myjyby@gmail.com ● W. Willett is with University of Calgary. E-mail: wesley.willett@ucalgary.ca ● P. Isenberg is with Inria, Universit´e Paris Saclay. E-mail:
pe-tra.isenberg@inria.fr
Manuscript received September 27, 2016.
or 2% of Arctic Ocean 1.6-1.7 m 2011 1900 2000 0 0 P Two century Franz Ferdinand Gavrile Princip. fought United Kingdom Central Powers The War European Russia monarchy and the other nations ended responsibility 6.8% 13 of which gut flora and diet.
the human body is
genes
As of 2015, the Zürich City Council
50 countries
most populous
27 to 18 through
world’s population was 25%. [10]
including carbon, calcium and phosphorus.
between 5 and 5½
high 75% in a newbord infant to a lower 45% in
from 27 to 18 through
POPULATION DENSITY DENSITY
after Asia and AfricaE Af As
37,000,000,000,000
as 37.2 trillion.
by genes and
both in terms of weight
The vast majority of cells Europe
Europe is the world’s second smallest continent North America’s $27.1 trillion
Each system contributes
13 of which
controlled
Skeletal structure
s reduced from 27 to 18 through
were 22 regions in In 2016, the
16 million the European Union,
including carbon, calcium and phosphorus.
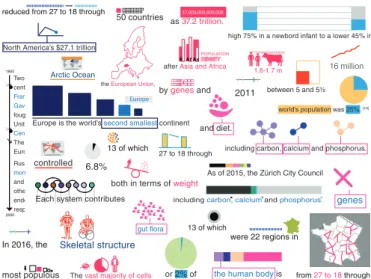
Fig. 1: Examples of word-scale graphics collected in our study.
based only on a very limited, curated, and strictly data-driven set of examples (such as Tufte’s [1]). We argue that these represent a mere fraction of the possibilities offered by word-scale graphics, and that many practical questions regarding their design and use remain unanswered.
To address this issue, we present the results of a study we conducted with nine graphic designers, in which we asked participants to annotate Wikipedia articles with word-scale graphics of their own design. We provide a rich categorization and analysis of the 200 resulting graphics1 (see Fig. 1 for a subset), and we characterize the goals and rationales that informed these designs. We also report a number of challenges participants faced when
1. All designs with their associated text can either be found in the supplemental material, or at http://aviz.fr/wsv/.
creating word-scale graphics. We then derive from our study three typical use-cases for word-scale graphics, which we propose as high-level inspiration for authors and designers. Finally, we discuss a set of implications for future word-scale graphics authoring tools.
2
R
ELATEDW
ORKResearch on the use, function, and design of word-scale graphics is still relatively rare. In this section, we review related work on small scale graphics, and we highlight existing use-cases.
2.1 Small Contextual Visualizations
Edward Tufte’s sparklines [1] are probably the best-known example of data-driven word-scale graphics. Tufte describes sparklines as small, intense, simple, word-sized graphics with typographic resolution. He provides several different designs, including line
charts depicting financial or health data. Small
“cell-sized” sparklines modeled after Tufte’s examples have been available in Microsoft Excel since 2010 [5].
Expanding on Tufte’s definition, we have previously proposed the term word-scale visualizations [3] to define a wider variety of small embedded data-driven graphics. Typically, word-scale visualizations are open to greater variations in size than sparklines, ranging from e. g. as small as a single letter to as large as a whole sentence or paragraph. In our previous work, we also introduced the notion of an entity—a specific word or word combination to which a word-scale visualization is associated—which we re-evaluate in this paper. We further discussed different placement options for word-scale visualizations within a text document [3] and how word-scale visualizations can be augmented with interaction [6].
Recently, Parnow and D¨ork introduced the term micro visual-ization[2], [7] to describe data-driven word-scale graphics that are small in physical space and represent few data dimensions or points. This definition reduces the concept of word-scale visualizations to those with few data dimensions or points. The authors further discuss micro visualizations in the context of typography and typographic data visualizations such as FatFonts [8]. Similar to our current and previous work [3], the authors describe characteristics of micro visualizations such as their placement in or next to text, and their connection to data.
While all three existing definitions vary slightly, the authors of the respective works all postulate that small data-driven graphics can “enhance” text content in particular through the addition of detail in context that could not otherwise be reported. Parnow and D¨ork even postulate that micro visualizations can enhance the com-prehension of text by making it more accessible, comprehensible, and memorable.
2.2 Word-Scale Visualization Designs
While evaluations on the benefits of word-scale visualizations are still relatively rare, researchers have previously proposed and tested some specific word-scale visualization designs. SportLines
[9] , for example, show phases of player actions across a
soccer field. Brandes et al. introduced the concept of Gestaltlines [10] which are sparkline-sized data-intensive graphics designed to convey a general gestalt or overall form. The authors tested one
Gestaltline design ( ) and found that untrained readers could
quickly detect holistic patterns, outliers, and breaks in the data.
Greenhill et al.’s Separation Plots [11] ( ) can help
readers assess the predictive power of models with binary outcomes.
A perfect model would correctly predict all actual outcomes of an event and produce a plot with all dark red stripes clustered to the right side (as in this example). Greenhill et al. discuss several examples and potential problems with the interpretation of their plots, but they did not conduct a user study.
While the first three discussed above are meant to be used within a text document, other designs have been proposed for non-continuous documents such as tag clouds or tables. For example, SparkClouds[12] (medicalmedical data ) convey temporal trends for words in a tag cloud by attaching small line charts to each word. In their original paper, Lee et al. compared SparkClouds to three other trend visualizations, and found that participants could read SparkClouds comparatively quickly across several tasks, and preferred them over other representations. Nguyen et al. [13] follow a similar approach, and propose several tag designs that use the background of a word to convey temporal information, while placing tags on a map to further convey geospatial relationships. Beck et al. [14] propose
word-sized eye tracking visualizations ( ) which are
meant to be used alongside think-aloud transcripts in a tabular view. The authors re-analyzed data from a previous small user study using the new graphics and show how their observations could be reported using word-sized eye tracking visualizations inline.
Finally, our work relates to the body of research on data glyphs which are data-driven visual marks that “make use of different visual channels to encode multiple data dimensions” [15]. While not always the case, glyphs are often scale and used in small-multiple display settings. Several overview papers and chapters have been published on data glyphs [15], [16], [17], [18], [19], [20] that focus on different characteristics of their design space. The work of Fuchs et al. [15] is informative for our investigation, as it summarizes user studies on data glyphs, and points out the many open questions regarding the performance of representations drawn at small sizes—that similarly apply to word-scale graphics.
2.3 Word-Scale Graphics
Almost all of the previous work, including our own, has focused on data-driven graphics. In fact, even the study reported here began with this assumption. However, small pictogrammatic, iconic, and symbolic graphics have been used alongside text for centuries.
Galilei’s drawings of Jupiter and its moons ( [21])
are one famous example. Emoticons (,/) are a more recent
example of iconic representations that are incredibly common in computer mediated communication. Dresner and Herring describe emoticons’ rich set of functions within written communication that goes well beyond the expression of emotion [22]. Children’s books are another place where iconic graphics are sometimes used to replace words in a sentence to help beginning readers as in “Benny’s Big Bubble” by J. O’Connor [23]. Designers have also used symbols or icons as word-scale graphics to tag words in text
to provide meta-information. Verjat [24], for example, uses a
human profile icon to make names stand out on his online CV. Given the frequent use of non-data-driven small graphics in text documents, we introduce the term word-scale graphics throughout this paper. The term refers to the broader category of graphics that includes both data-driven and non-data-driven graphics.
Previous work on word-scale graphics has focused mainly on the design of these graphics. However, there is little understanding related to how, when, and why such graphics can or should be used. Our main focus in this article is thus the authoring of word-scale graphics, and in a lesser state, their integration in
P Age Occupation
0 21-30 PhD student working on design and learning 1 21-30 Independent graphic and interaction designer 2 31-40 PhD student working on design fictions 3 21-30 (Data) graphic designer for an online news site 4 31-40 Designer and assistant professor in visualization 5 21-30 PhD student working in disability and media studies 6 21-30 Freelance graphic designer
7 21-30 Graphic designer and application/game developer 8 21-30 Teacher and practitioner in the applied arts
Fig. 2: Participant details
text documents. Our results not only expand upon these previous examples—illustrating a wide variety of new data-driven and non-data-driven word-scale graphic designs—they also reveal more concrete use-cases.
3
S
TUDY: D
ESIGNINGW
ORD-S
CALEG
RAPHICSTo explore this diversity of possible uses and designs of word-scale graphics, we conducted a qualitative study in which we asked nine professional graphic designers to graphically annotate existing documents. We chose Wikipedia articles as the documents to annotate, because they provide a realistic scenario and environment for the integration of word-scale graphics. We designed the study expressly to elicit new and interesting possible designs for word-scale graphics, and to explore how designers might use them to enhance existing documents and engage readers.
3.1 Participants
We recruited nine designers (4 male, 5 female) via word-of-mouth. All designers had formal training in visual communication and storytelling and were actively employed in a variety of related fields. In addition, we ensured that participants wereexpert users of Adobe Illustrator (mean = 8.5 years using Illustrator, SD = 2.60), with professional experience through their work or field
of study (mean = 6.6 years as a practitioner, SD = 3.97). The
expertise in Illustrator was necessary to allow flexible digital manipulation and generation of text and graphics. Fig. 2 gives details on the participants’ occupations and age ranges. All were graduates or did a post-master at a prominent French design school.
We compensated participants with a 20e Amazon gift certificate.
3.2 Task
We provided participants with a Wikipedia article in Adobe Illustrator format. Participants had to read the article carefully, and envision how small visualizations embedded in the text could provide a richer reading experience. We asked them to create small word-scale graphics, and embed them into the document using Illustrator. Participants repeated this task for three articles in total.
3.3 Dataset
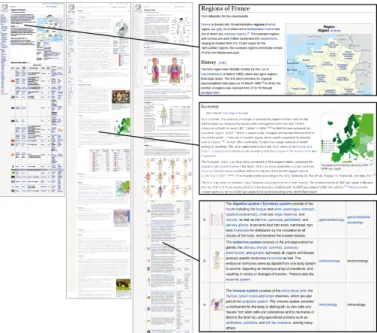
We selected subsets of three English language Wikipedia articles for participants to annotate. Fig. 3 shows a high-level overview of the curated articles—the full documents can be found in the supplemental material. We chose these articles for their high density of various data types and diversity of sub-topics. Taken together, the articles contained examples of the seven data types highlighted
Fig. 3: Thumbnails of the three Wikipedia articles. From left to right: “Regions of France”, “Europe”, and “Human Body”.
by Shneiderman [25], including 1D, 2D, 3D, multi-dimensional (MD), temporal, hierarchical (tree), and network data.
We used the shortest article on the “Regions of France” as the starting article. It consisted of three short paragraphs describing the administrative regions of France and the history of their creation. At the bottom of the article, a large table provided basic information about the regions, including flags, capitals, and current presidents. To the right, an infobox included a schematic map of France and additional facts, such as the populations of the largest and smallest regions. This article had only a limited set of data types: 1D, 2D, temporal, and MD.
The second text was an article on “Europe”. It contained five general paragraphs about the continent, followed by separate sec-tions on Europe’s history, economy, languages, climate, biodiversity, and the creation of the European Union. Each of these sections included one image or data table. At the beginning of the article, an infobox provided data on various indicators (area, population, etc.) and a map. In total, the “Europe” article contained 1D, 2D, MD, temporal, hierarchical, and network data.
The third article, the “Human Body”, contained three introduc-tory paragraphs followed by sections about the body’s structure, its physical composition, and its anatomical systems. The article also included a large table at the bottom, which provided more detailed information about individual anatomical systems. Each section had at least one associated image. Unlike the other articles, this article contained 3D data (including diagrams of the human body). It also contained 1D, MD, hierarchical, network data.
For each article we created an Adobe Illustrator file. To improve performance and make it easier for participants to manipulate the document, we grouped the characters in each line of text together as a single rasterized object. As a result, the smallest movable units in each document were lines of text, rather than words or characters. This allowed designers to concentrate on designing the graphics rather than manipulating and rearranging the text.
Instead of the “Human Body” article, our very first participant (P0) used a Wikipedia article on the city of “Zurich” which contained no 3D or network data. Despite this change, we chose to
include P0’s data in our analysis as it did not significantly differ in quality or creativity from the other data we collected.
3.4 Study Procedure
One experimenter was present throughout each design session. The study started with a questionnaire, in which we asked about participants’ age and experience. Next, the experimenter gave a short presentation on word-scale visualizations, showed past examples of word-scale visualizations, and explained the study procedure. After this presentation, participants started the study with the article “Regions of France” (“Zurich” for P0). For 15 minutes, we allowed participants to familiarize themselves with the text of the article, generate initial ideas, and start to instantiate them with Illustrator. In order to reduce the overall study time, we allowed participants to approximate the actual data, rather than trying to retrieve and reproduce exact values in their designs.
After a short break, participants then started with one of the two larger remaining Wikipedia articles. We counter-balanced the order of the larger articles between participantsto mitigate fatigue effects. We gave participants as much time as they wanted to familiarize themselves with each larger article. For the next 20 minutes, participants created and integrated their graphics into the article using Illustrator. We instructed participants to insert graphics into the interline space of the main text, but not inside of tables, images, captions, infoboxes, or the navigation bar. After 20 minutes of design work, we gave participants the option to spend 5– 10 additional minutes finishing their designs. All participants asked for at least 5 more minutes. We then allowed participants another short break before moving on to the second article, following the same procedure.
At the end of the study we debriefed each participant, and asked them to explain each of their designs, describing their intended message and where the data originated. We also discussed the rationale behind our study, and asked for any additional thoughts on the subject. Finally, we asked participants to describe how future authoring tools might make it easier for them to create and integrate graphics and text. On average, participants took roughly 2.5 hours to complete the entire study.
3.5 Set-Up and Materials
We conducted the study in a small office with tables and chairs for up to three people. We provided blank sheets of paper for note-taking or quick idea sketches. Each participant brought their own laptop with Adobe Illustrator already installed. We asked them to do the study on their own laptop so that they would have access to their own customized Illustrator configuration. We provided participants with a USB flash drive with the three curated Wikipedia articles, as well as a PDF copy of the slides we used to explain the study and task. All participants were conversant in English, and used English when including text in their word-scale graphics, but completed the interviews and demographic questionnaire in French.
3.6 Analysis Procedure
During our analysis, we first extracted all word-scale graphics produced by our participants. For each graphic, we took a snapshot containing the entire illustration, along with any words or sentences associated with it. Two of the authors then printed and clustered these snapshots using an open-coding approach, then refined the clusters through several rounds of discussion with all four authors. This process helped us identify a number of dimensions along which to compare and categorize word-scale graphics.
Participant P0 P1 P2 P3 P4 P5 P6 P7 P8
# Visualizations 23 10 13 44 16 22 19 30 23
Fig. 4: Number of word-scale graphics per participant
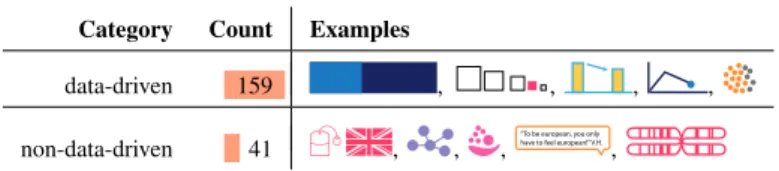
Category Count Examples
data-driven 159 , , , ,
non-data-driven 41 , , ,
“To be european, you only have to feel european!” V.H.
,
Fig. 5: Examples of data-driven and non-data-driven graphics.
4
R
ESULTSWe collected exactly 200 different word-scale graphics—a mean of 22 (SD = 10) per participant (see Fig. 4). In order to better understand the broader space of possible word-scale designs or potential uses for them, we coded all graphics according to: 1) whether or not they encoded data, 2) what types of visual representation they used, 3) how they were connected to the text, 4) how they supported comparison and provided context, 5) what interaction they suggested, and 6) the designer’s intent. Our main focus was to describe the diversity of designs, with a particular attention to the designers’ editorial and rhetorical choices.
4.1 Data vs. Non-Data-Driven Encodings
We first examined whether the graphics in our collection rep-resented quantitative data or more conceptual ideas. We coded graphics that used one or more visual variables (position, length, hue, value, . . . ) to encode data as data-driven. We refer to the 79.5% (159/200) of word-scale graphics that were data-driven as word-scale visualizations. The remaining 20.5% generally represented broad concepts, ideas, or messages not backed by abstract, quantitative data (see Fig. 5).
4.1.1 Data Provenance
Having determined which word-scale graphics were data-driven, we examined the provenance of the data they used. We found that data could come from one or multiple sources. Word-scale visualizations with just one data source took their data either from the associated sentence (49.7%; 79/159), or from somewhere else in the article (1.9%; 3/159). Graphics with multiple sources either included data from the associated sentence + elsewhere in the article (11.3%; 18/159), or from the associated sentence + outside the article (37.1%; 59/159). While in theory word-scale visualizations can also visualize data exclusively from outside the article, we found no examples of this in our collection.
4.1.2 Types of Data
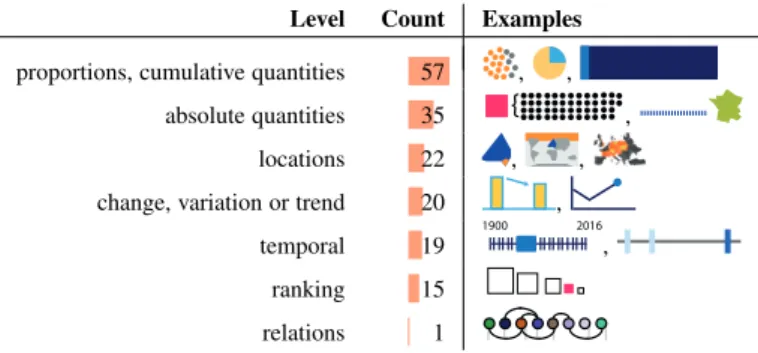
We then coded the types of data used in our word-scale visualiza-tions. While we designed the three Wikipedia articles to contain all of Shneiderman’s data types [25], our coding deviated from his set to make more fine-grained distinctions. From Shneiderman’s set we kept locations, temporal data and relations, but added proportions & cumulative quantities, absolute quantities, rankings, and change, variation, or trends(see Fig. 6).
Proportions, cumulative quantities: , , .
Level Count Examples proportions, cumulative quantities 57 , ,
absolute quantities 35 ,
locations 22 , ,
change, variation or trend 20 ,
temporal 19
1900 2016 ,
ranking 15
relations 1
Fig. 6: Levels of types of data, their counts and examples.
Level Count Examples quantitative abstract visualizations 141 ,
geographic and schematic maps 16 ,
icons & symbols 36 , ,
illustrations 7 ,
Fig. 7: Levels of types of graphic, their counts, and examples
absolute quantities in relation to other quantities. We classified 57/159(35.8%) graphics in this category.
Absolute quantities: , .
The 35 (22.0%) designs in this category represented single quantitative data values, often using graphics made up of countable units [26]—such as the black dots for countries, and blue bars for regionsin the examples above.
Location data: , , .
Location context or highlights were the basis of 22 (13.8%)
graphics—many of which were small maps.
Change, variation or trend: , .
The 20 (12.6%) graphics in this category showed data values changing according to another data dimension such as time.
Temporal data: 1900 2016, -800 0 2000 .
The designers included 19 (11.9%) graphics depicting temporal data; mostly in the form of timelines, and often highlighting a specific time point or period.
Ranking: , .
Rankings were present in 15 (9.4%) designs. These showed
ordered sets, in which typically a focus object was highlighted.
Relational data: .
A single design (0.1%) included relational data depicting connections between different systems in the human body.
4.2 Design of Word-Scale Representations
We coded the types of visual representations used in our word-scale graphics, and noted whether or not designers followed any specific process in making their designs.
4.2.1 Types of Visual Representation
We found examples of quantitative abstract visualizations, geo-graphic or schematic maps, icons and symbols, and illustrations (see Fig. 7).
Quantitative abstract visualizations: , .
The 70.5% (141/200) of word-scale graphics in this category
France is divided into 18 administrative regions (French: région, [ʁe.ʒjɔ̃]), 13 of which are in Metropolitan France and five of which are overseas regions.[1] The mainland regions
and Corsica are each further subdivided into departments, ranging in number from 2 to 13 per region for the
Fig. 8: Example of an implementation of a reusable graphical system. The square stands for a region unit and the circle for a department. A bar chart and a trend visualization are assembled from these units.
used visual variable(s) like length, position, or color to encode quantities—which were typically numbers drawn from the text.
Geographic and schematic maps: , .
8% (16/200) of the word-scale graphics were geographic and/or schematic maps. We coded these separately from quantitative abstract visualizations, as it was often unclear whether they actually encoded quantitative data (beyond the geo-coordinates
of regional boundaries). For example, N is a
schematic representation of the topological surroundings of the city of Zurich—from left to right: a mountain, a lake, and a forest.
Icons and symbols: , , .
Of the word-scale graphics, 18% (36/200) did not encode any quantitative data at all. Instead, they replaced a single concept or word in the text. Some icons and symbols directly resembled the
object they referred to (such as a standing for cranial bones),
while others described an entity—these needed to be learned to
be understood (for example, standing for France).
Icons and symbols were also sometimes used as a part of quantitative abstract visualizations. Here, they had a secondary function to help relate the shown quantities toknown ones [27],
or to give contextual cues. For example in the standard
heights of men and woman are related to a “known” height of a cow (according to designer who created the graphic). In a second
example , the graphic shows a ranking with a human
figure on the left signaling that the graphic shows population data. Illustrations: , <(portrait de mitterrand)
PS .
This group of 7 (3.5%) word-scale graphics included more complex diagrams and sketches. Often, these illustrations tried to convey a message. For example, the following small graphic , shows two human skeletons with one sitting in a wheelchair. The designer wanted to convey the message that people with disabilities are often not considered in articles on the human body.
4.2.2 Reusable Graphical Systems
Several designers used a coherent visual theme for their word-scale graphics. They largely remained consistent in terms of coloring schemes and connection between entity and graphic (see Sect. 4.3.2). One designer (P0) went further, proposing a visual language based on the assembly of small data-driven units (see Fig. 8). This system consisted in introducing tokens (token grammar), and assembling them (assembly model) to express various quantities—similarly to the construction of unit-based visualizations discussed by Huron et al. [28].
4.3 Connections Between Text and Graphics
In our previous work [3], we defined the notion of an entity — a single word or a word sequence associated with a word-scale
Level Count Examples font color,
existing link
51 the United Kingdom,is a continent that
frame 36 including carbon, calcium and phosphorus.
underlining 11 Arctic Ocean
background
color 7 about 11% of the world’s population.
Fig. 9: Types of explanatory structures for word-scale graphics.
graphic. However, this definition did not specify in detail how entities and their corresponding graphics can be connected. As part of our study, we wanted to analyze these text-to-graphic connections in more detail and build a better understanding of how designers chose and communicated these relationships.
4.3.1 Size of the Associated Text
Designers often associated graphics with one- or multi-word entities. In the study results, we identified 139 entities, with lengths ranging from a single number or word up to the size of a sentence, paragraph, or document subsection (mean = 4.0 words per entity, SD = 4.9). One-word (39%; 54/139) and two-word (25.9%; 36/139) entities were the most common. However, the relationships between entities and graphics was not always one-to-one. Although 42.5% (85/200) of graphics were connected to a single entity, 9.5% (19/200) were connected to multiple distinct entities at different locations. We also found a number of word-scale graphics (48%; 96/200) that were not clearly associated with any specific subset of the text.
4.3.2 Type of Connection
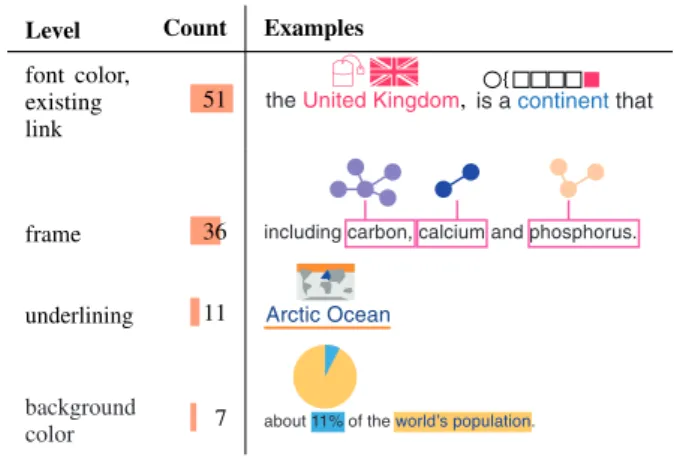
The designers in our study linked 52% (104/200) of the graphics they created to one or more entities using a variety of different graphical techniques (see Fig. 9):
Font / hyperlink color: In 49% (51/104) of the cases, a font color associated with a word served as the graphical connection between word-scale graphic and text. In 19% (20/104) of the cases, the designer altered the color of the text to create the mapping—often using color present in the graphic itself. In 30% (31/104) of the cases, designers used the existing highlighted Wikipedia links in the article as entities, sometimes even reusing the link color (dark blue) in the graphic to emphasize the connection.
Frame: The second most common technique (35%; 36/104) used a frame around associated words, and sometimes added a reference link between frame and graphic.
Underlining: In 11% (11/104) of the cases, designers used a line drawn under an associated word to connect text to graphic. Background color: In 7% (7/104) of the cases, designers created
a visual connection by changing the background color of the text. Another 48% (96/200) of our word-scale graphics were not linked to text by graphical techniques, but rather using spatial proximity. In most cases, designers either left- or center-aligned
EEEEEEEEEEEEEEEEEEE
The European Union, a political entity composed of 28 European states, comprises the
largest single economic area in the world. 18 EU countries share the euro as a common currency. Five European countries rank in the top ten of the world’s largest national
economies in GDP (PPP).
Fig. 10: The word-scale graphic has been positioned to the left of the paragraph, showing the proportion of countries using the Euro (18) versus the number of countries actually in Europe (28)
Main article: Economy of Europe
As a continent the economy of Europe is currently the largest on Earth and it is the Fig. 11: The word-scale graphic has been added to the title of the
paragraph. It is a horizontal bar chart comparing the assets under management in Europe and the North America
the word-scale graphics with a related word or phrase. In some cases, designers associated graphics with whole paragraphs or subsections. For example, in Fig. 10, P4 visually associated the word-scale graphic with a complete paragraph by placing the chart immediately to the left of the entire text block. Similarly, in Fig. 11, the same designer placed a word-scale graphic next to a section heading, effectively associating the graphic with the entire subsequent section. Two designers (P4, P8) added few (P4), or almost all (P8) of their designs below the entity. Several of these designs showed long vertical bars (for example in a stacked bar chart) that served as an underline in terms of its connection to the associated entity. In total, 14.5% (29/200) of the designs were positioned below the entity instead of above, but used the same general connection types as discussed above.
4.3.3 Legends and Captions
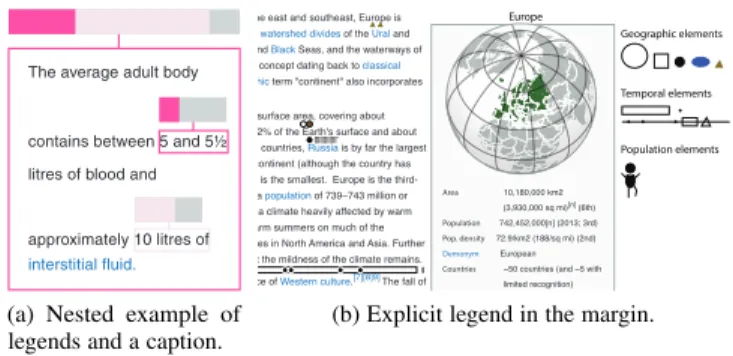
The design of small-scale visualizations allows little space to add captions or labels to explain a visualization. Interestingly, the designers in our study addressed this challenge in a variety of ways, summarized in Fig. 12.
The top graphic in Fig. 12, for example, shows how word-scale
graphics themselves can serve as part of a legend to a larger
graphic. Here, small icons added to the individual element names (carbon, calcium, phosphorus) label the elements of the stacked bar chart above. In cases such as this one, the larger graphic was
Type of Legend or
Caption Examples
Word-scale graphics
as legends including carbon, calcium and phosphorus.
Entities as legends including carbon, calcium and phosphorus
Entities as captions the human body is
Fig. 12: Several ways in which graphics and entities serve as legends or captions.
The average adult body
contains between 5 and 5½ litres of blood and
approximately 10 litres of
interstitial fluid.
(a) Nested example of legends and a caption.
Geographic elements
Temporal elements
Population elements
Europe ( i/ˈjʊərəp/ or /ˈjɜːrəp/[4]) is a continent that comprises the westernmost part of Eurasia. Europe is bordered by the Arctic Ocean to the north, the Atlantic Ocean to the west, and the Mediterranean Sea to the south. To the east and southeast, Europe is generally considered as separated from Asia by the watershed divides of the Ural and Caucasus Mountains, the Ural River, the Caspian and Black Seas, and the waterways of the Turkish Straits.[5] Yet the borders of Europe—a concept dating back to classical
antiquity—are arbitrary; as the primarily physiographic term "continent" also incorporates cultural and political elements.
Europe is the world's second-smallest continent by surface area, covering about 10,180,000 square kilometres (3,930,000 sq mi) or 2% of the Earth's surface and about 6.8% of its land area. Of Europe's approximately 50 countries, Russia is by far the largest by both area and population, taking up 40% of the continent (although the country has territory in both Europe and Asia) while Vatican City is the smallest. Europe is the third- most populous continent after Asia and Africa, with a population of 739–743 million or about 11% of the world's population.[5] Europe has a climate heavily affected by warm Atlantic currents tempering winters and enabling warm summers on much of the continent, even on latitudes that have severe climates in North America and Asia. Further from the Atlantic, seasonal differences increase, but the mildness of the climate remains. Europe, in particular ancient Greece, is the birthplace of Western culture.[7][8]9]The fall of
the Western Roman Empire, during the migration period, marked the end of ancient
history and the beginning of an era known as the "middle ages". The Renaissance humanism, exploration, art, and science led the "old continent", and eventually the rest of the world, to the modern era. From this period onwards, Europe played a predominant role in global affairs. Between the 16th and 20th centuries, European nations controlled at
Area 10,180,000 km2 (3,930,000 sq mi)[n] (6th)
Population 742,452,000[n] (2013; 3rd)
Pop. density 72.9/km2 (188/sq mi) (2nd) Demonym European
Countries ~50 countries (and ~5 with limited recognition)
Dependencies 4 dependencies
Languages ~225 languages[1]
Time zones UTC−1 to UTC+5
Largest cities Urban areas in Europe[2] Istanbul
(transcontinen-2008 Jun 12 03:54:25OMC - Martin Weinelt
km
Jun 12 04:45:24OMC - Martin Weinelt km
Europe
(b) Explicit legend in the margin.
Fig. 13: A nested legend and caption explains the top bar chart in (a). The right image (b) shows an example of an explicit legend created and placed in the margin by a designer.
typically connected to multiple entities, which in turn had small associated iconic representations placed in close proximity to them. For example, the designer who introduced a token-based grammar for the design of her graphics (Sect. 4.2.2) used this mechanism to introduce the tokens of her grammar, placing individual instances of each token near the first occurrance of the corresponding term. The second example in Fig. 12 shows the same text illustrated by another designer. The designer colored the element names to serve as the legend to the associated pie chart. In general, graphics with associated entities as legends included multi-entity associations, in which the entities were colored according to the elements of the graphic they were associated with.
These first two techniques use entity text to label parts of word-scale graphics. The last example on the bottom, instead, uses an entity as a captionto describe the overall content of the graphic, without giving any details about the individual stacked bars.
While Fig. 12 summarizes three common usesoflegends and
captions, designers also explored a range of other variations. In a few cases, designers even created compound captions and legends like the one shown in Fig. 13a. Here, the designer introduced a multi-line entity with nested caption and legend elements that help readers interpret the larger bar chart.
Finally, one designer also created an explicit legend in the margin explaining the types of graphics introduced in her article, including representations showing geographic, temporal, and population data.
4.4 Supporting Comparison and Providing Context
Designers also used a variety of strategies to support comparison between word-scale graphics in the document:
Shared reference structure: Multiple designers used shared ref-erence structures, including refref-erence lines and grids which spanned multiple graphics. In one example (Fig. 14), P1 added a grid connecting two word-scale graphics on the same line such that the viewers could more easily compare them. In cases where graphics were further apart in the document, some designers created duplicate reference structures to preserve comparability. In Fig. 15, for example, P3 repeated the same reference grid and icons in two word-scale graphics, highlighting small differences between heights more clearly.
Traces: Another static method we saw (P1, P4, P7) for comparing word-scale graphics used a graphical overlay or trace of one graphic in another (Fig. 16).
can vary from a high 75% in a newborn infant to a lower 45% in an obese person. Fig. 14: Connecting multiple graphics with a support grid.
various hormones. The average height of an adult male human (in developed countries) is about 1.7—1.8 m (5’7’’ to
5’11’’) and the adul female is about 1.6—1.7 m (5’2’’ to 5’7’’). Height is largely determined by genes and diet. Body reference grid
reference icon
Fig. 15: Repeated grid and icons support comparison.
Sequencing: Several designers (P3, P5, P7) created sequences of word-scale graphics in which each graphic built upon the previous ones. For example, in Fig. 17, P7 placed a small timeline over each date in the text. Each successive timeline also included desaturated versions of all of the previous dates, helping to place the current date in context with the earlier ones. Other examples of sequencing included sets of maps which built upon one another, each containing elements of the previous one.
4.5 Interaction
We did not ask the designers to consider interaction when creating their word-scale graphics. However, during the post-study debrief several participants proposed ways of augmenting their designs with interaction:
Connecting word-scale graphics: P6 suggested adding interac-tive brushing and linking to the graphics in Fig. 18—allowing readers to interactively explore the relationship between hormonal changes and the development of fat and muscle tissue.
trace of
The average adult body
contains between 5 and 5 1/2 litres of blood and ...
approximately 10 litres of interstitial fluid.
trace of
Fig. 16: Overlaying a trace of one graphic over another.
The term region was officially created by the Law of
Decentralisation (2 March 1982), which also gave regions
their legal status. The first direct elections for regional representatives took place on 16 March 1986. In 2016, the number of regions was reduced from 27 to 18 through
[2]
shape (and female body shape) is influenced by the distribution of muscle and fat tissue and is also effected by various hormones.
react to the mouse cursor
Fig. 18: Three connected word-scale graphics. Moving the cursor in one graphic results in highlighted values in the others (we added the red dots and the cursor to explain the interaction)
6.8% of its land area. Of Europe’s approximately 50 countries, Russia is by far the largest by both area and population, taking up 40% of the continent (although the country has territory in both Europe and Asia), while Vatican City is the smallest. Europe is the
third-Russie
Fig. 19:Using interaction to overlay the word-scale graphic for one country on top of the graphic for another. (Sizes are approximate— as estimated by the participant. We added the cursor and line for illustration.)
Comparing word-scale graphics: P3 proposed several tech-niques for bringing multiple word-scale graphics together to facilitate comparison. By dragging one word-scale graphic onto another (as in Fig. 19) a reader could overlay the two graphics on top of one other. Similarly, dragging one graphic next to another could facilitate side-by-side comparison. Both approaches would allow for dynamic comparison without the use of static support structures like those seen in the preceding section.
Revealing word-scale graphics: P2 suggested using interaction to show word-scale graphics on demand—displaying graphics only in the paragraph that a reader is currently attending to. All word-scale graphics outside of the paragraph could either be hidden, desaturated, or scaled down to reduce visual clutter. Data interactions: Interaction could also be used to trigger
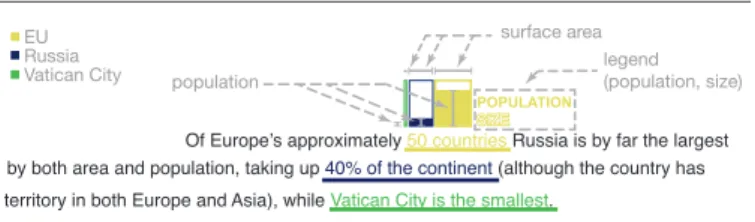
filtering or highlighting on the graphics themselves. For example, P2 proposed using interaction with labels on the right side of the word-scale graphic in Fig. 20 to transition between alternative views. In this case, hovering over the labels for “population” and “size” would toggle which of the two data sets the chart displayed.
4.6 Designer’s Goals
During their debrief sessions, designers described a diverse range of goals that guided the ways they designed and integrated word-scale graphics with the documents.
Facilitating understanding: The main goal all nine designers cited was facilitating understanding. Concretely, they mentioned
by both area and population, taking up 40% of the continent (although the country has Of Europe’s approximately 50 countries Russia is by far the largest territory in both Europe and Asia), while Vatican City is the smallest.
POPULATION SIZE SIZE legend (population, size) surface area population EU Russia Vatican City
Fig. 20: Word-scale graphic showing the contrast between popula-tion and surface area for the EU, Russia, and Vatican City.
using graphics to illustrate concepts (3 out of 9 designers), make quantities explicit (6 out of 9 designers), provide scales (3 out of 9 designers), or put information into context (4 out of 9 designers). One designer also suggested using word-scale graphics to provide more detailed information about the entity as a way to facilitate understanding.
Summarizing the content: Six designers expressed the use of word-scale graphics to help summarizing the content of a sentence. Designers discussed using word-scale graphics to provide a preview of the content or to expose the most important information from the text, providing readers with a clearer take-home message. Emphasis: Two designers mentioned using word-scale graphics to emphasize and draw attention to content they felt was par-ticularly important. We were surprised that only two designers mentioned this explicitly, as the presence of word-scale graphics in text already provides a type of intrinsic emphasis effect [29] where the process of mapping content to a graphic increases
its visual prominence. In addition, many ofthetext-to-graphic
connections (font color, frames, underlining, background color) give further extrinsic emphasis [29] to the associated entities. Providing alternative representations: Two designers also
ex-plicitly stated that they used word-scale graphics to provide alternative representations as a supplement to the written text. They emphasized that introducing a redundant encoding of the information in the text could help make the text both more
understandable and morememorable [30]. For example one of
the designer suggested to add a visual representation of a cell—as
known from Biology text books—to the entity “cell ” in
order to make it more memorable.
Providing contrasting viewpoints: Interestingly, two designers also described creating graphics to express a contrasting viewpoint that differed from what was written in the text. Here, designers mentioned wanting to encourage readers to think more deeply about the text and consider alternative interpretations of it. For example, one designer proposed to add a map of the world showing where Europe was perpetrating slavery in the 16th century to provide a contrasting viewpoint on how Europe “controlled” the world at that time. Especially, pointing out that
the word choice “controlled ” seems too neutral.
5
D
ISCUSSION: U
SINGW
ORD-S
CALEG
RAPHICSHaving developed a fine grained understanding of the different design dimensions of word-scale graphics, we here propose a higher-level definition of use-cases for word-scale graphics. We intend these to serve as inspiration and starting points for authors and designers who wish to integrate word-scale graphics into text documents. We believe this higher-level approach is generally more accessible for generating new designs and applications, in contrast to the low-level characteristics from Sect. 4, which are more suitable for describing existing examples. Furthermore, we reflect upon the related work in light of our study results, and propose an extension to the notion of associated entity. Moreover, we discuss challenges that arose during the study.
5.1 Applications of Word-Scale Graphics
We characterize three different ways in which designers can apply word-scale graphics to alter the rhetorical structure of a document. Specifically, word-scale graphics can support the content, extend the content, or go beyond the content.
5.1.1 Supporting the Content From an editorial perspective, one of the simplest ways of applying a word-scale graphic is using it to support its associated entities. In
these cases, word-scale graphics display data (left image) that
comes directly from the entity text itself (shown above using a green arrow), or use non-data-driven symbolic representations (right image)that visually emphasize or reiterate the content of the text. Thus, when creating word-scale graphics that support the content, editorial choices are relatively restricted. The editor or designer needs to choose which entities to visualize or illustrate, how to design them, and how to place and connect them to the associated text. However, they do not need to locate or prepare additional data. For example, an editor could choose a number in the text as an entity and represent that value using a chart. Alternatively, an author could add a symbolic representation such as a flag to represent the name of a country already included in the text. Although they restate the existing content, these graphics can still provide useful emphasis—facilitating better understanding of
numbers orconcepts [30], providing summaries, or highlighting
alternative versions of the entities (see Sect. 4.6).
5.1.2 Extending the Content
Word-scale graphics can also be used to provide contextual data that extends the ideas put forward by their associated entities. These
word-scale graphics extend the content with compatible information
(shown aboveusingbluearrows), and do so without purposefully
changing the message of the sentence, or proposing novel interpre-tations. Yet, the creation of word-scale graphics that extend content is somewhat more complicated than for the previous group—it involves finding data from elsewhere in the text or from outside the document. It can also involve searching for or creating non-data-driven graphics that provide additional information. For example, an author could extend a timeline connected to the date of a WWII battle by adding outside data such as the start and end dates of the war. Graphics that extend the content can help provide context or comparisons for data already contained in the text, or provide additional material about specific entities.
5.1.3 Going Beyond the Content
The previous two applications of word-scale graphics generally com-plement and reinforce the content of the original document. However,
authors and editors can also use word-scale graphics that go beyond the content, including contrasting ideas and messages (shown aboveusingredarrows) which may significantly broaden, annotate, or even subvert the original meaning. As a simple example, an editor can choose to add illustrations or symbolic representations that express an opinion, make a statement, or show emotion. For
example, by adding a “thumbs up” icon next to an entity
expressing an action, the editor can express agreement. Similarly, by including a word-scale graphic showing external data that contradicts the existing narrative, an editor or designer can suggest alternative, contrasting viewpoint (see Sect. 4.6). While these contrasting viewpoints may originate with the original author, they can also be added in response to the article at a later point.
5.2 Defining “Word-Scale”
As we alluded to in Sect. 2, prior work has offered several competing terms and definitions for describing small graphics and visualizations embedded in text. Here, we revisit these descriptions in light of our study results.
Tufte’s definition of sparklines refers to them as “datawords” and describes them as “word-sized” [1]. While many of Tufte’s examples—such as his baseball win/loss charts—are much longer than typical words, most are still essentially word-height. In our study and elsewhere, we have observed many word-scale graphics that go well beyond this size limit. As such, our initial definition of word-scale visualizations [3]—which allows graphics “as small as a single letter to as large as a whole sentence or paragraph”—better captures the variety of graphics we saw in the study.
Parnow and D¨ork’s work on micro visualizations [2], [7] provides another definition for small embedded visualizations. Rather than focusing explicitly on size, their definition instead stresses simplicity—emphasizing that such visualizations contain few data dimensions or points. While we found a number of simple data-driven graphics that do fit this definition, we also found more data-intense graphics that would not be covered. As such, our definition of word-scale visualizations better captures the graphics we saw, as it does not explicitly restrict the number of data dimension or data points.
However, while our definition of word-scale visualizations seemed to be a good term to capture the data-driven graphics we saw in the study, it does not encompass the full range of non-data-driven graphics designers produced. Yet, our study clearly suggests that non-data-driven graphics at these scales can express a variety of design intents, and may be just as useful a communication tool as their data-driven counterparts. Our higher-level designation “word-scale graphics” captures both data-driven and non-data-driven variants, and serves as a unifying term for characterizing a wide range of small graphics that can be embedded in text.
5.3 What is an Entity?
In our previous work, we had assumed that each visualization would explicitly be associated or linked with a single entity (see [3]), i. e. a single word or a sequence of words in the text. In this previous work, we had discussed how proximity—or placement of a word-scale visualization in close context to an entity—would establish this connection. However, participants did not always follow this association we had envisioned, which led us to re-evaluate our initial definition. For example, in addition to using proximity to establish the connection between a word-scale graphic and the text, they also linked multiple disconnected pieces of text to one scale graphic (see Sect. 4.3). Designers also created word-scale graphics without any explicit or implicit entity. In some cases, designers added word-scale graphics to the beginning of a paragraph, or after a title. They also added word-scale graphics vertically along a paragraph—effectively associating the graphics with the entire block of text.
A particularly interesting finding of our study showed that entities also served a function that went beyond the mere provision of metadata we had envisioned. Instead, they served a reference function, and were used as parts of legends.
As a result, we propose an updated definition of what an associated entity is. An entity is still a concrete piece of text that can have associated metadata, however, it also serves as a way to link the word-scale graphic to the text, and can be part of the
word-scale graphic’s legend, or of its caption. Word-scale graphics can have one entity, multiple entities, or no entities associated to them. If there is an entity, it is marked using for example font color or a frame. In cases where the word-scale graphic has no marked entities, it means the graphic is associated with the sentence or the paragraph, depending on its positioning.
Finally, it may be productive to more deeply consider the relationship between entities and word-scale graphics using the semiotic concepts of referent, signifier, and signified [31], [32], [33]. These semantic connections are particularly interesting, as entities and word-scale graphics sometimes represent the same concept, but may also introduce indirection or serve as an alternative representation of an underlying idea.
5.4 Challenges when Creating Word-Scale Graphics
One of the main challenges our participants had was to find suitable pieces of text they could complement with word-scale graphics. The process of deciding what should and could be represented usually happened at the very beginning of the process of integrating word-scale graphics. The designers also expressed concerns that the associated entities in the text had to be below a certain length to be representable or connectable to a word-scale graphic. We, therefore, updated our definition of an entity. A word-scale graphic can have one or multiple entities, or none, and proximity can be a way to link graphic and text. We argue that this updated definition provides more freedom to support the linking of word-scale graphics to the text. Entities can also serve multiple purposes—including acting as a label or caption for the graphic—a fact that was not recognized in previous work. Moreover, this definition explicitly acknowledges that word-scale graphics do not necessarily need an entity if it is clear what the word-scale graphic represents, and the connection to the text is clear.
In addition, and linked to this thematic of defining associated text, our participants had difficulties finding suitable places to position their word-scale graphics. In our instructions, we restricted the positioning of word-scale graphics to the interline space. However, designers still hesitated at times, and sought alternative placement options—for example at the end of a title or along a paragraph (see Sect. 4.3). One participant also told us that she would have liked to rewrite the sentences to make it easier for her to integrate word-scale graphics. She found the sentences were too convoluted, which led her to find it difficult to find suitable positions for her word-scale graphics. Moreover, some of the information or data that the designers wanted to integrate into the word-scale graphics was spread over multiple lines. This made it more difficult to find good places to position graphics. Sometimes, designers also started to create a graphic first, and then had a difficult time finding suitable text to associate with the word-scale graphic. As Sect. 4.3 and Sect. 4.4 show, there are multiple ways to link entities to a word-scale graphic. Future authoring tools for word-scale graphics should take these possibilities into account and support different placement options and linking possibilities.
6
I
MPLICATIONS FORA
UTHORINGT
OOLSUnlike our study participants, it is clear that not all editors or authors are also competent designers or visualization specialists with the expertise to create word-scale graphics. Currently, the amount of time necessary to manually create and integrate word-scale graphics into a document is high—with individual graphics taking significantly more time to author than raw text.
However, simple authoring tools could make the process of creating and integrating word-scale graphics considerably easier by streamlining or even automating portions of the creation and placement process.
Based on observations from our study, as well as our own experience in designing word-scale graphics, we identify four major decision points at which new tools could support the process of creating and integrating a graphic. In order to add a word-scale graphic to a document, designers or authors must specify the design of the graphic, as well as any entities to which it corresponds, the data (if any) it displays, and its placement relative to the text. Our study suggests a number of important takeaways for the design of each of these operations:
Designing the Word-Scale Graphic: An authoring tool needs to offer some mechanism for selecting existing word-scale graphic designs, or for creating new ones. As part of this process, an author may need to make an explicit choice between driven and non-driven graphics—since data-driven graphics may require additional design choices. In our study, a large portion of the designs used familiar chart types, and nearly a third (31%) of the visualizations were unit-based. This suggests that support for generating simple, scalable visualization designs based on basic geometric shapes could support a large number of the data-driven design alternatives that we observed.
In contrast, non-data-driven designs in our study were quite diverse. Allowing authors to insert appropriately-sized icons, images, and cliparts from existing libraries may cover a considerable number of cases. However, more fully-fledged image editing tools would be necessary to create many of the designs we observed.
Selecting an Entity: While a word-scale graphic does not always need to be associated with text, authors in our study chose to connect the majority of their graphics to one or more entities. This suggests that it can be useful for tools to provide a mechanism for associating a word-scale graphic with one or more blocks of text. These associations can make it easier to position the graphic, and can also provide context for interpreting it.
Selecting Data: Our study also suggests that, in many cases, the data needed to populate a design is actually contained in the associated entity (see Sect. 4.1.1). This means that data selection and entity selection can often be treated as a single operation. However, the ability to link data from outside an entity or from outside a document can support a richer and more nuanced use of word-scale graphics (see Sect. 5.1). For non-data-driven word-scale graphics the data selection component can be bypassed.
Placing the Word-Scale Graphic: While selecting an entity specifies a relationship between that text and the associated graphic, it does not necessarily determine the graphic’s placement relative to the text. In previous work [3] we discussed options for placing word-scale graphics in text documents, and explored the trade-offs associated with placing graphics immediately above an entity, in-line with the entity, or overlapping the graphic and text. Authoring systems could build on this work, showing possible placement options for each graphic and analyzing how they will impact the visibility of the graphic and the flow of the text.
More generally, tools for authoring word-scale graphics in text could take different forms depending on the design expertise and investment of the authors. For writers with little interest in customizing designs, mechanisms for including simple word-scale graphics could be integrated into existing text entry interfaces. For example, an interface could allow authors to create word-scale graphics using markup embedded directly in the document text (akin to entering equations in LATEX), or via in-editor search interfaces, like those used to select and insert emoji in most modern operating systems. Such tools could make a number of simplifying assumptions, including supporting a limited set of chart types, and reduced control over their placement. Libraries like Peity [34], which generates simple word-scale SVG charts based on markup included in HTML documents represent a first step towards this sort of minimalist authoring.
Alternatively, the process of adding very basic word-scale graphics to documents could potentially be automated entirely. For example, a system could generate and place graphics automatically next to known entities like dates or stock symbols. In this case, decisions about the design, data, and placement might be made in advance by a developer, then applied to new pages with little or no user interaction.
However, more expressive, unique, customized, or interactive designs like those described by designers in our study likely call for interfaces that provide greater control. These might include the ability to create new visual forms using image editing or coding tools, as well as greater control over the relationship between the text and graphics.
7
C
ONCLUSION, L
IMITATIONS, & F
UTUREW
ORKWe presented the results of an exploratory study on the use of word-scale graphics in text documents. The study resulted in a rich collection of different types of graphic designsand also helped us to identify specific design challenges unique to word-scale graphics. Unlike larger visualizations, designers creating word-scale graphics must consider the immediate connections between visualizations and text, and also find alternatives to common visual elements like axes, legends, and captions that work given reduced space. Designing interactions also presents a challenge, since graphics may be dispersed, small, and only loosely associated with one another. At the same time, our results alsoillustrate a variety of ways in which word-scale graphics can enrich text documents and also suggest implications for the design of future authoring tools.
Our overall goal was to improve our understanding of how, when, and why one might use word-scale graphics in text docu-ments. Yet, the results of our study and our discussion need to be interpreted in light of several specific study design decisions. In
this paper,we focused on the design of word-scale graphics and
not on their placement. To give participants enough study time to focus on design, we only allowed them to place graphics between lines of text. This made placement easier, since designers did not have to shift individual words or reflow text and could instead focus on creating interesting new designs. To increase opportunities for creative designs, we allowed participants to freely adjust the amount of inter-line space, allowing them to explore graphics with a greater variety of different heights, widths, and positions relative to the text.
Participants were not able to edit the text itself, and thus did not have full control over the phrasing, language, or organization of the content they were building on.In the post-session interview,
participants had a chance to express their ideas and concerns about the placement of their word-scale graphics. Only one of our participants mentioned that she felt her design had been restricted by the fixed text—noting that she would have liked to rewrite sentences to better fit her word-scale graphics and use graphics in-line as a legend. Thus, while 8/9 participants did not report design restrictions due to the fixed placement, it is likely thatour results do not show the full spectrum of creativity that the participants could have applied to word-scale graphic placement.
Two further factors influencing the reported designs are the choice of text and the restricted study time. Wikipedia articles are usually much more descriptive and data-driven than articles, novels, poems, or other forms of text.Participants also did not have time to make multiple iterations over their designs, as we asked them to maximize the diversity of their designs rather than produce a few refined ones. Therefore, the designs should be seen as initial ideas, which would require iteration and further development before their effectiveness could be tested.
Overall, we believe this work serves as a strong starting point for considering how word-scale graphics might complement a variety of types of text documents. Building on the work presented here, we plan to study several aspects of word-scale graphic integration more closely. In particular, we plan to focus on interfaces that will make it easier to design and integrate word-scale graphics into documents, both during and after authoring the text. Ultimately, we hope that these kinds of tools can help lower the threshold for authoring and including word-scale graphics— making integrating text and other word-scale representations as fluid as writing text is today.
A
CKNOWLEDGMENTSThis work is sponsored by the French Research Organization, project grant ANR-11-JS02-003 and supported by the Collabora-tive European Digital Archive Infrastructure project CENDARI (cendari.eu).
R
EFERENCES[1] E. R. Tufte, Beautiful Evidence. Cheshire, CT: Graphics Press, 2006, vol. 1.
[2] J. Parnow and M. D¨ork, “Micro visualizations: Data-driven typography and graphical text enhancement,” in Posters of the Conference on Information Visualization (InfoVis). IEEE, 2015.
[3] P. Goffin, W. Willett, J.-D. Fekete, and P. Isenberg, “Exploring the placement and design of word-scale visualizations,” IEEE Transactions on Visualization and Computer Graphics, vol. 20, no. 12, pp. 2291–2300, 2014.
[4] B. Victor, “Explorable explanation,” Last read: June 2015, http:// worrydream.com/ExplorableExplanations/.
[5] Microsoft Corporation, “Use sparklines to show data trends,” Last read: April 2016, https://support.office.com/en-us/article/ Use-sparklines-to-show-data-trends-1474e169-008c-4783-926b-5c60e620f5ca. [6] P. Goffin, W. Willett, J.-D. Fekete, and P. Isenberg, “Design considerations
for enhancing word-scale visualizations with interaction,” in Posters of the IEEE Conference on Information Visualization (InfoVis). IEEE, 2015. [7] J. Parnow, “Micro visualizations: How can micro visualisations enhance
text comprehension, memorability, and exploitation?” Design Master Thesis, Potsdam University of Applied Sciences, Potsdam, Germany, June 2015, http://www.microvis.info.
[8] M. Nacenta, U. Hinrichs, and S. Carpendale, “Fatfonts: Combining the symbolic and visual aspects of numbers,” in Proceedings of Advanced Visual Interfaces (AVI). ACM, 2012, pp. 407–414. [Online]. Available: http://doi.acm.org/10.1145/2254556.2254636
[9] C. Perin, R. Vuillemot, and J.-D. Fekete, “SoccerStories: A kick-off for visual soccer analysis,” IEEE Transactions on Visualization and Computer Graphics, vol. 19, no. 12, pp. 2506–2515, 2013.