HAL Id: hal-01493184
https://hal.sorbonne-universite.fr/hal-01493184
Submitted on 23 Mar 2017HAL is a multi-disciplinary open access archive for the deposit and dissemination of sci-entific research documents, whether they are pub-lished or not. The documents may come from teaching and research institutions in France or abroad, or from public or private research centers.
L’archive ouverte pluridisciplinaire HAL, est destinée au dépôt et à la diffusion de documents scientifiques de niveau recherche, publiés ou non, émanant des établissements d’enseignement et de recherche français ou étrangers, des laboratoires publics ou privés.
B- and T-cell subpopulations in patients with severe
idiopathic membranous nephropathy may predict an
early response to rituximab
Michelle Rosenzwajg, Eva Languille, Hanna Debiec, Joana Hygino, Karine
Dahan, Tabassome Simon, David Klatzmann, Pierre Ronco
To cite this version:
Michelle Rosenzwajg, Eva Languille, Hanna Debiec, Joana Hygino, Karine Dahan, et al.. B-and T-cell subpopulations in patients with severe idiopathic membranous nephropathy may pre-dict an early response to rituximab. Kidney International, Nature Publishing Group, 2017, �10.1016/j.kint.2017.01.012�. �hal-01493184�
1
B- and T-cell subpopulations in patients with severe idiopathic
membranous nephropathy
may predict an early response to rituximab
Running title: Treg and rituximab in membranous nephropathy
Michelle Rosenzwajg, M.D., Ph.D.1,2,3, Eva Languille, M.D.2, 4 &, Hanna Debiec, Ph.D.2,4, &,
Joana Hygino, M.D.1, Karine Dahan, M.D.5, Tabassome Simon, M.D., Ph.D.6, David
Klatzmann, M.D., Ph.D. 1,2,3#, Pierre Ronco, M.D., Ph.D. 2, 4, 5, #
1. AP-HP, Hôpital Pitié-Salpêtrière, Biotherapy (CIC-BTi) and Inflammation-Immunopathology-Biotherapy Department (I2B), F-75651, Paris, France
2. Sorbonne Universités, UPMC Univ Paris 06, F-75005, Paris, France 3. INSERM, UMR_S 959, F-75005, Paris, France
4. INSERM, UMR_S 1155, F-75020, Paris, France
5. AP-HP, Hôpital Tenon, Department of Nephrology and Dialysis, Paris, France
6. AP-HP, Hôpital Saint-Antoine, Department of Clinical Pharmacology and Unité de Recherche Clinique, Paris, France
&Equal contribution
# Co-senior authors Correspondence:
Pierre Ronco, Department of Nephrology and Dialysis, Tenon hospital; 4 rue de la Chine, F-75020, Paris, France. fax number : +33 1 56 01 65 12 ; E-mail: pierre.ronco@upmc.fr
Sources of support:
The sponsor of the GEMRITUX study (NCT01508468) was Assistance Publique-Hôpitaux de Paris (Département de la Recherche Clinique et du Développement, Clinical Research and Development Department). The GEMRITUX study received legal, monitoring and administrative management support from the Assistance Publique-Hôpitaux de Paris).
2
This work was supported by grants to PR from the European Research Council ERC-2012-ADG_20120314 (Grant Agreement 322947) and from the 7th Framework Programme of the European Community Contract 2012-305608 (European Consortium for High-Throughput Research in Rare Kidney Diseases).
Abstract word count: 217 Text word count: 3340
3
Abstract
Primary membranous nephropathy (PMN) is characterized by antibodies to the podocyte but little is known about B- and T-cell populations and their response to rituximab is controversial. We compared 33 lymphocyte subpopulations and 27 cytokines/chemokines in 25 patients with severe PMN and 27 age-matched healthy controls. At baseline, patients had (i) increased percentage of naive B-cells (p=0.03) with decreased switched (p=0.03) and non-switched (p=0.005) memory B-cells; (ii) decreased percentage of NK cells (p=0.04), with an increase of the CD56brightCD16-/lo NK subset (p=0.002); (iii) decreased percentage of
regulatory T cells (p<0.0001), together with an increased plasma concentration of TNF-alpha, IL-5 and IL-2RA. We then investigated patients at 8 days, 3 and 6 months after treatment with rituximab added to supportive therapy (n=16) or supportive therapy alone (n=9) compared to baseline. After rituximab, B-cell recovery was still incomplete at 6 months, with persistent alterations of B-cell subsets, increase of Treg (p<0.05) and NK cell (p=0.05), and decrease of CD56brightCD16-/lo NK subset (p<0.05) and TNF-alpha levels
(p<0.01). The patients who clinically responded to rituximab had a lower percentage of Treg at baseline (p=0.01 vs non responders) and an increased percentage at day 8 (p=0.01). Treg remained unchanged in non responders and in patients treated with supportive therapy alone. Evaluation of Treg might be useful for predicting early response to rituximab.
Key words: membranous nephropathy, memory B-cells, regulatory T-cells, NK cells, TNF-alpha, rituximab
4
INTRODUCTION
Membranous nephropathy (MN) is a major cause of nephrotic syndrome in the adult. It is characterized by the accumulation of immune deposits leading to complement activation on the outer aspect of the glomerular capillary wall. About a third of the patients will undergo spontaneous remission whereas another third will reach end-stage renal failure, and the remaining third will keep various degrees of proteinuria and develop progressive renal failure. Considerable advances have occurred in the understanding of the pathophysiology of primary MN (PMN) with the identification of three major antigens including neutral endopeptidase in the neonatal disease1, and the phospholipase A2 receptor (PLA2R)2 and thrombospondin
domain 7A (THSD7A)3, in the adult disease. All three antigens are expressed on the podocyte
where they serve as targets for circulating antibodies. Anti-PLA2R and anti-THSD7A antibodies are detected in about 70 to 80 % and <5 % of adult patients with PMN, respectively4. Anti-PLA2R antibodies have been paradigm shifting in diagnosis and patients
‘care because of their specificity for MN and their correlation with disease activity4. Although
correlations have been found between anti-PLA2R antibody titers and outcome, we still cannot explain why patients will undergo spontaneous remission while others will not respond to immunosuppressive agents and develop a severe form of the disease.
At variance with antibodies, circulating lymphocyte populations have been poorly investigated in PMN. Old studies have shown an increase of the CD4+ /CD8+ subset ratio in
some patients with MN, with or without nephrotic syndrome5–12. In the subset of patients with
MN and nephrotic syndrome, some patients had a marked increase in the CD4+ /CD8+ ratio
due to a reduction in the CD8 cell subset compared to healthy subjects while others showed a ratio in the normal range6 It was suggested that a high CD4+/CD8+ ratio might predict clinical
response to immunosuppressive treatment9 although this was not confirmed by later studies in
patients treated with rituximab13. The imbalance between the CD4+ and CD8+ subsets was
associated with decreased suppressor T-cell function, which seems secondary to the nephrotic state14, and with predominance of the Th2 immune response. Implication of Th2 in
pathogenesis of PMN is attested by predominance of IgG4 subclass among circulating and deposited anti-PLA2R and anti-THDSD7A antibodies, increased number of interleukin (IL)-10 or IL-4- secreting T-cells, and increased production of IgG4 by B-cells upon stimulation with Th2 cytokines2,3,11,15,16.
Surprisingly, there are relatively few data on regulatory T-cells (Treg) in PMN although those cells are known to play a key role in auto-immune diseases17–19, at least in part by inhibiting
5
the activation of helper T-cells induced by antigen-presenting cells, and consequently B-cell activation and production of autoantibodies. Patients with a mutation in FOXP3, a transcription factor which programs the development and function of CD4+CD25+ regulatory
T-cells, occasionally develop MN20,21. Compared with healthy controls, the number of
peripheral blood CD4+CD25+Foxp3+ regulatory T-cells was reduced in patients with PMN,
while the amount of peripheral blood B-lymphocytes was higher, although no correlation was found with proteinuria12,22. At variance with these data, Fervenza et al, found that none of the
Treg subsets showed quantitative differences, the only persistent change in lymphocyte subsets being a relative increase in natural killer cells13.
We performed a detailed analysis of B- and T-cell populations in PMN for several reasons. First, we wanted to take advantage of the progress achieved in the characterization of lymphocyte subpopulations in an attempt to solve out the discrepancies previously observed12,13. Second, our randomized controlled trial of rituximab plus supportive therapy
versus supportive therapy alone made it possible to investigate whether dynamic changes in specific lymphocyte populations might predict response to rituximab in patients with severe PMN23. Third, we hypothesized that this study could provide a rational for using novel
6 RESULTS
Patients
The study enrolled 25 patients including 5 females and 20 males with a median age of 57 years (26-74). The male preponderance in the PMN population reflects the higher frequency of PMN in this gender (Table 1). Sixteen patients were enrolled in the NIAT-rituximab group, 9 in the NIAT only group. The imbalance between numbers in each group is related to the randomization process that regulated treatment assignment at the level of the country, which resulted in more patients being enrolled in the NIAT-rituximab group in the Paris area. No difference at baseline was observed between groups regarding age, gender, serum creatinine, serum albumin, proteinuria, and PLA2R-Ab titer (Table 1 and Supplementary Table 1). Among the 16 patients of the NIAT-rituximab group, 9 achieved the primary end point (partial or complete remission) at 6 months, 2 patients of the NIAT group entered spontaneous remission (Table 2).
Anti-PLA2R and anti-THSD7A antibodies at baseline
PLA2R-Abs were detected in 18 of the 25 (72%) patients, including 10 in the NIAT-rituximab group and 8 in the NIAT group (Table 2). Among the 7 PLA2R-Ab-negative patients, 3 had PLA2R-Ag detected in immune deposits; hence the rate of PLA2R-related MN was 84%. Among the 4 remaining patients, one had anti-THSD7A antibody measured by immunofluorescence assay while 3 patients most likely had PMN related to other, as yet unknown antigen(s).
B-, T-, and NK-cell subsets at baseline
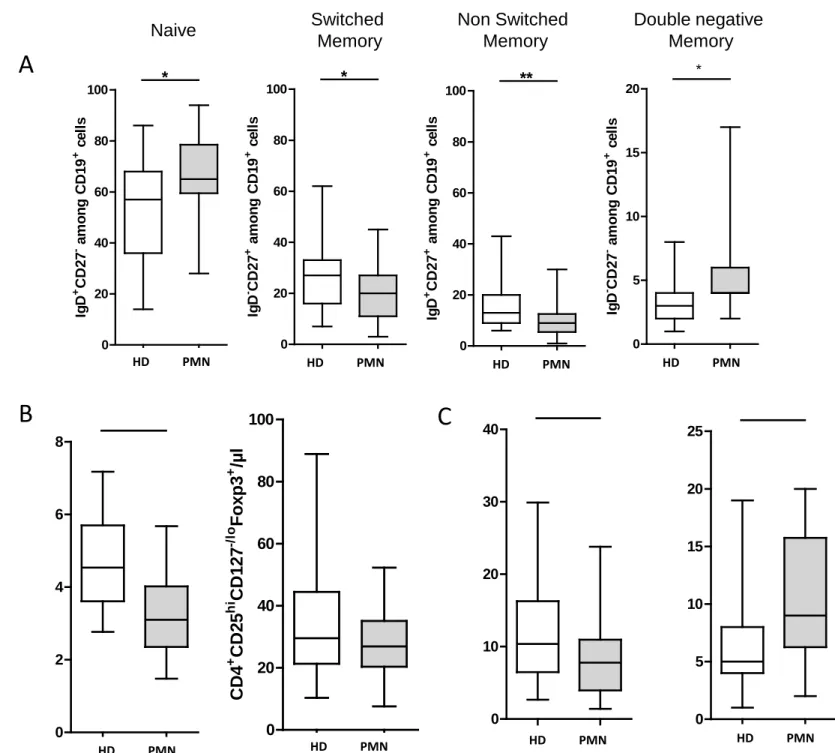
While absolute and relative numbers of B cells were comparable in PMN patients and healthy donors, analysis of the B cell subsets shown by CD27 and IgD expression revealed that patients had lower percentages of switched (IgD-CD27+) and non-switched (IgD+CD27+)
memory B cells (20 ± 2% vs 27 ± 2% p=0.03 and 10 ± 1% vs 16 ± 2% p=0.005 respectively) associated with a higher percentage of naive (IgD+CD27-) B cells (65 ± 3% vs 54 ± 4%
p=0.03). Double negative (IgD-CD27-)25, 26 B cells were also expanded in patients (5.3±0.6 vs
3.6±0.3, p=0.009) (Figure 1A). The percentage of plasmablasts and CD21- B cells was
unchanged compared to healthy donors (Supplementary Table 2).
Among T cell subsets, a decreased frequency of Treg among CD4+ T cells was observed in
PMN patients compared to healthy donors (3.2 ± 0.2% vs 4.7 ± 0.2 p<0.0001), (Figure 1B and supplementary Table 2) while Treg absolute numbers were comparable in both groups (Figure
7
1B). Markers associated with Treg differentiation, activation or function such as CD45RA, Helios, HLA-DR, CTLA-4, GITR or LAP expression were comparable in patients and healthy donors (Supplementary Figure 1 and supplementary Table 2). No correlation was found between Treg% or absolute number, and proteinuria, serum albumin or anti-PLA2R levels at baseline (data not shown). Effector memory CD4+ and CD8+ T cells were increased in patients
compared to healthy donors (10 ± 1% vs 6 ± 1% p= 0.03 for CD4+T cells and 26 ± 4% vs 18 ± 1% p= 0.02 for CD8+ T cells), (Supplementary Table 2).
A decreased percentage of NK cells was detected in PMN patients compared to healthy donors (8 ± 1% vs 12 ±1% p=0.04) associated with an increased percentage of CD56brightCD16-/lo NK cells (10 ± 1% vs 6 ± 1% p=0.002), (Figure 1C and supplementary
Table 2).
Immunological and clinical outcome in patients treated with NIAT-rituximab
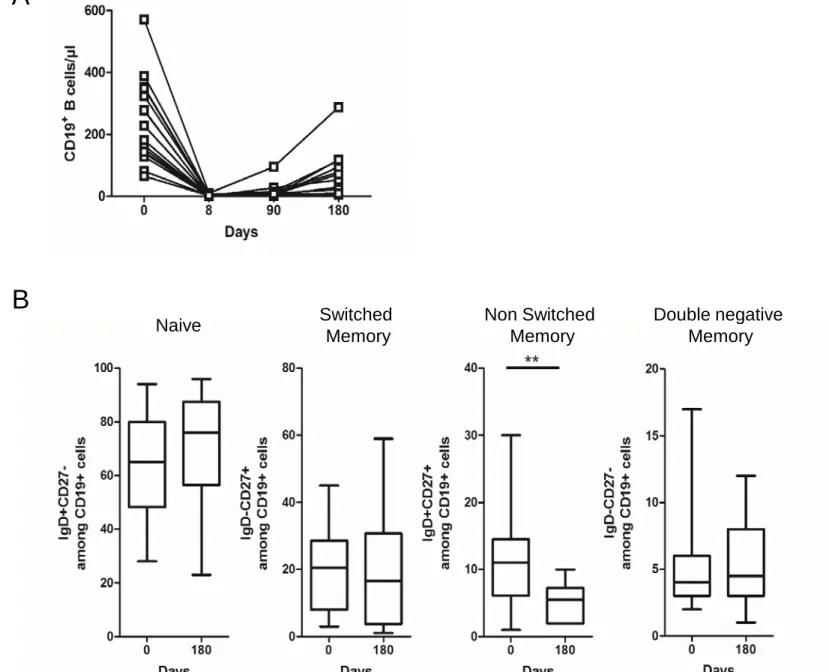
B-cell depletion was achieved at day 8 in all treated patients (2.2 ±0.7 CD19+ cells/mm3
vs239 ±34 at day 0, p<0.0005), persisted at day 90 in all patients except one (14±7 CD19+
cells/mm3, p<0.0001), and CD19 count did not return to baseline level by 6 months (67±20 CD19+ cells/mm3, p<0.001), (Figure 2A). These changes were mostly associated with lack of
reconstitution of non-switched memory B-cells that remained very low at day 180 (5±1 % at day 180 vs12±2 % among CD19+ cells at baseline, p=0.008), (Figure 2B).
In the NIAT-rituximab group, 8 of the 9 patients who reached the primary end point (clinical remission) at 6 months had no detectable PLA2R-Ab at 3 months: among them, 3 patients were initially PLA2R-Ab positive and achieved antibody depletion, one patient had a 28-fold lower level of PLA2R-Ab, 4 patients had PLA2R-related MN without detectable antibody at baseline and therefore had probably entered immunological remission, one patient had THSD7A-related MN (Table 2). Conversely, 3 patients without PLA2R-Ab at month 3 had not achieved clinical remission at month 6, which is in accordance with previous observations showing that immunological remission may precede by several months clinical remission2,27.
In the NIAT group, spontaneous remission occurred in 2 patients with low anti-PLA2R-Ab levels at baseline and absence of detectable antibody at 6 months.
Treg percentage among CD4+ cells and Treg absolute numbers were weakly increased as
early as day 8 (reaching statistical significance for Treg percentage), and the average increase reached 22±10% and 36±15%, respectively, at 6 months from baseline (Figure 3A).
8
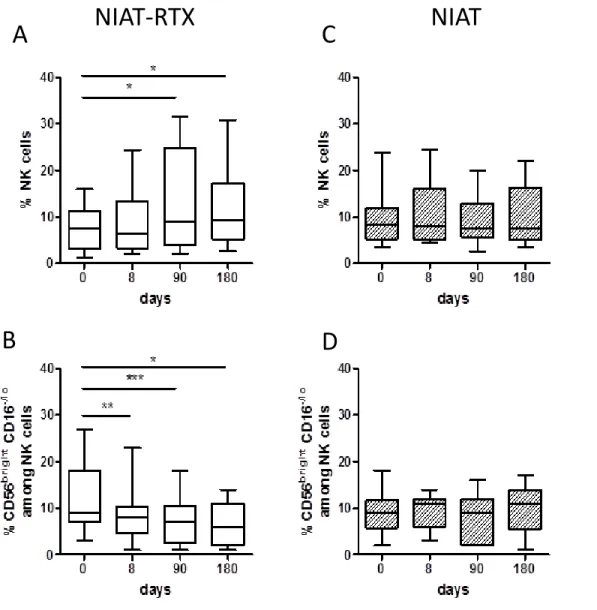
A progressive increase of NK-cell percentage was observed (from 8±1% at baseline up to12±2% at day 180, p=0.04), (Figure 4A) contrasting with a decrease of
CD56brightCD16-/lo NK cell percentage (from 12±2% at baseline down to 7±1% at day 180,
p=0.03), (Figure 4B). No change was observed in patients treated with NIAT only (Figures 4C and 4D).
Treg cell dynamics might predict early clinical response
Because Treg response to rituximab was heterogeneous, we investigated whether it could be correlated with a different clinical response at 6 months. Responder patients were characterized by a lower percentage of Treg at baseline (responders, 2.4±0.2 vs non-responders, 3.9±0.4, p=0.01), (Figure 3C) whereas all other cell subsets or markers explored in this study were at similar level across patient groups. A significant increase of Treg percentage among CD4+ cells was observed at day 8 (3.01±0.19 vs baseline, 2.57±0.17, p=
0.0015), day 90 (2.78±0.26, p=0.0078) and day 180 (3.46±0.38, p=0.046) in responder patients treated with rituximab, whereas Treg remained unchanged in non-responder patients as well as in patients who were treated with NIAT alone (Figure 3B). Changes in Treg absolute numbers in responder patients showed parallel evolution although significance was reached at month 6 only. There was a slight but significant increase of GITR at month 6 while the other Treg markers were not affected (not shown).
We analyzed correlations between changes in Treg % or absolute numbers, and changes in proteinuria, serum albumin, anti-PLA2R-Ab, NK and CD19 levels at month 6. We found that B (CD19+) cell depletion was correlated (spearman test, p=0.04) with an increase in Treg absolute numbers in responder patients whereas no correlation was observed in non- responders (Figure 5). There was no correlation between Treg levels and absence of PLA2R-Ab or antibody depletion at month 3.
Cytokine profile in PMN patients and outcome with NIAT-rituximab
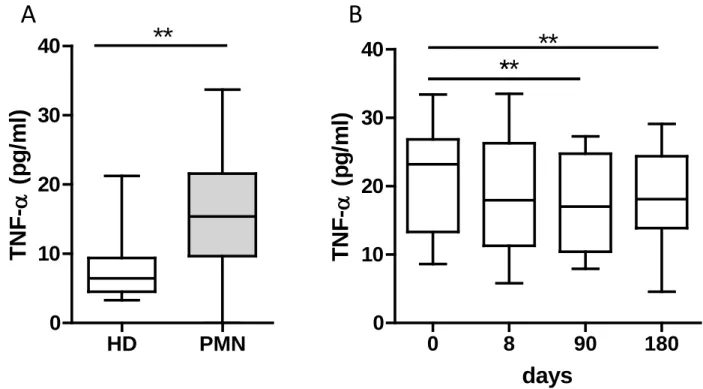
A panel of 27 cytokines and chemokines was assayed to investigate the Th1/Th2/Th17 balance in PMN patients and healthy donors. A significant increase of 5, TNF- and IL-2RA associated with a decrease of IL-17, IL-1, IL-7, and GM-CSF was observed in patients compared to healthy controls (Figure 6A and supplementary figures 2 and 3). Among these cytokines, we observed a significant decrease of TNF- level under treatment from month 3 (Figure 6B), but no difference was observed between responder and non-responder patients
9
(not shown). The other cytokines including IL-35 were unchanged or could not be assessed at all time points.
10 DISCUSSION
Studies on B- and T-cell populations in patients with PMN are scarce and their results often controversial. A decrease of Treg was reported in 2 studies from China12 and Italy22 whereas a
study from the Mayo Clinic found that none of the Treg subsets showed quantitative differences13. Roccatello et al 22 showed that in patients treated with rituximab, there was an
increase in Treg at month 12, but there was no information on early time points before month 6. The present study features 4 important novelties. First, this is the first such study using detailed CD marker phenotyping of T- and B-cell subsets in the era of autoantibody classification (anti-PLA2R, anti-THSD7A) of PMN cases. Second, it presents a full profile of 26 cytokines in patients with severe PMN at baseline and after rituximab treatment, the major change being an increased level of TNF-alpha followed by a decrease of this cytokine under B-cell depletion. Third, this is the first study performed in a randomized controlled trial which allowed comparison of lymphocyte population outcome in patients treated with rituximab or with supportive therapy. Fourth, it first provides evidence that an early increase in Treg % and absolute values within the first 6 months after rituximab is observed in responder patients only and consequently may be an early predictor of response to rituximab.
Total B-cell numbers and percentages in PMN patients were similar to those of healthy controls. However, the frequency of naive cells was increased while that of switched and non-switched memory cells was decreased. These data are consistent with previous reports in other autoimmune diseases like SLE and Sjogren’s syndrome28, 29. They indicate that the
B-cell compartment undergoes alterations that are apparent in the distribution of the B-B-cell subsets present in the circulation, which suggests that B-cell tolerance checkpoints are impaired in these autoimmune diseases29.The lower rate of circulating memory B cells could
be explained by over-expression of chemokines that guide them into tissues as suggested by immunochemistry studies showing B-cell infiltration in kidneys12,29-31, and/or by an increased
differentiation of self-reactive B cells into autoantibody producing plasmablasts under the control of T follicular helper (Tfh) cells29,32. Exploration of Tfh cells in PMN would be
important in future studies.
We observed an increased level of TNF- in PMN patients followed by a decrease of this cytokine under B-cell depletion. The role of TNF- in the pathogenesis of PMN is supported by evidence of high plasma and urinary TNF- levels in patients with PMN33–35, which was
shown to be associated with a polymorphism in the TNF- gene in PMN patients36. An
11
Matsumoto et al37 but activated B-cells could also contribute by a greater propensity to
produce pro-inflammatory cytokines, particularly TNF-. Given that the B cells reemerging after B-cell depletion are dominated by naive B cells38,39, it is tempting to speculate that the
cytokine normalization is related to B cell depletion as it was suggested in rheumatoid arthritis26.
We also found changes in the NK subsets, with decreased percentage of NK cells associated with an increase frequency of CD56brightCD16-/lo NK, the later subset being considered as
more immature and less cytotoxic than CD56+CD16+ NK cells. A reduction in the number of
circulating NK cells has been shown in several autoimmune disease like multiple sclerosis, SLE, psoriasis and Graves’ disease 40,41.This quantitative defect, usually paralleled by a
decrease in NK cell cytotoxicity, gave rise to the hypothesis that circulating NK cells are involved in the control of the autoimmune reaction, as has been shown for regulatory T cells41.
Treg cells play a fundamental role in the development and maintenance of immunological tolerance, and in most autoimmune diseases, there is an imbalance between harmful self-specific effector T cells (Teffs) that attack normal tissues, and Tregs that normally control them42,43.Our data show a significant decrease in Treg percentages in PMN patients compared
to healthy controls. This is in agreement with previous studies 12,22 and in disagreement with
another one13 in which, however, Treg cells were not analyzed by the expression of the Foxp3
“gold standard marker”. Expression of molecules associated with Treg function,i.e GITR, CTLA-4, HLA-DR or LAP, was not affected and we did not observe an imbalance between resting and activated Tregs among total Tregs.
One of the most striking data provided by this study was the kinetics and possible predictive value of Treg cells in patients treated with rituximab. Treg percentage among CD4+ T-cells
was significantly lower in PMN patients responding to rituximab, and strikingly increased as early as 8 days whereas Treg percentage did not change in the non responders, in whom it remained within the normal range (no significant difference with healthy donors).This is remarkably similar to what we previously observed during the treatment with rituximab of patients with mixed cryoglobulinemia vasculitis44. Rituximab was also shown to induce Treg
in several other autoimmune disorders such primary thrombocytopenic purpura, lupus nephritis, and rheumatoid arthritis45-47 as well as in allogenic stem cell transplantation48. and
this appeared to highly correlate with clinical responses44,47.These observations are important
12
allogenic settings are linked to an increase in Treg. The precise mechanism for this phenomenon is unclear but might be a consequence of B-cell deprivation as suggested by our own results showing that B (CD19+) depletion was correlated with an increase in Treg
absolute numbers in responder patients only. B cells provide signals to T cells through antigen presentation and cytokine production. At least 2 cytokines could be involved. It has been shown that B cells expressing interferon-gamma suppress Treg-cell differentiation and promote autoimmune experimental nephritis, and that interferon-gamma specifically derived from B cells contributes to the pathogenesis of autoimmunity49. Another potential candidate is
interleukin-35 since IL-35 producing B cells are key players in the negative regulation of immunity50. Roccatello et al22 indeed showed that IL-35 levels were increased compared to
baseline values at 6 months after rituximab and that IL-35 did not increase in the patients who did not respond to rituximab. However, we could not confirm these data in the present study. We could not find a difference between patients and healthy donors at baseline, among patients during follow-up, and between responders and non-responders. An alternative mechanism could be the direct depletion of CD20dimTcells, contributing to decreased T-cell
activation51 or decreased effector T-cell generation which, as a consequence would result in
rising Treg percentages among CD4 T cells.
This manuscript puts the focus on B-cells, the main target of rituximab, and Treg cells for their implication in autoimmunity. Further studies should investigate at least 2 important aspects of B- and T-cell pathobiology in patients with PMN, respectively. The first one relates to PLA2R-specific B-cells, particularly memory B-cells. It is well established that switched memory B-cells play a key role in auto-immunity. Upon encounter with the target antigen, B cells differentiate into short- or long-lived, antibody secreting CD20-negative plasma cells and into CD20-positive memory B cells which can differentiate into antibody-secreting cells upon re-exposure to the priming antigen. Since the cell subset responsible for autoantibody production in PMN has not been clearly defined, a role for PLA2R-specific memory B-cells must be considered and their outcome under rituximab treatment may provide important information on these cells as a biomarker of disease activity and a predictor of relapse. A second important issue relates to T cells, including i) identification and functional studies of PLA2R-specific, effector and regulatory T-cells and ii) analysis of the T-cell repertoire. Recent studies on allelotypes associated with MN provide some clues to the nature of PLA2R-specific T-cell epitopes52 which make the basis for future functional studies.
13
This study has several limitations. First, it enrolled a relatively small number of patients due to constraints in the recruitment of patients who had to be sampled in the area of Paris to be analyzed in a short time period after sampling. Thus they represent only a third of the patients enrolled in the GEMRITUX trial. Second, the follow-up was limited to 6 months, before occurrence of full B cell reconstitution, because we wanted to give the referring physicians a chance to switch treatment in patients who had not achieved clinical remission at this timepoint, particularly in those from the NIAT group. However, we think that our study lays the ground for further studies which should enroll a greater number of patients over a period of 12 months, and include additional cell populations such as Tfh cells and relevant cytokines/chemokines.
Altogether, our results suggest that an increase of Treg percentage might be a marker of early response to rituximab, possibly prior to PLA2R-Ab decrease. They require confirmation in a prospective study. They should lead to investigate whether an increase of Treg cells is associated with spontaneous remissions of PMN. Finally, they raise the possibility that immuno-intervention aimed at increasing Treg count and functions such as low-dose IL-224
14
METHODS
Study population
This study presents the results of an ancillary study to the GEMRITUX (Evaluate Rituximab Treatment for Primary Membranous Nephropathy) randomized controlled trial (NCT01508468)23. Eligibility criteria, study treatments and monitoring, and definition of
clinical and immunological remission, are given in the Supplementary appendix and detailed elsewhere23. The GEMRITUX study was approved by an institutional review board in Paris,
France (Comité de Protection des Personnes Ile-de-France XI).
Here, we aimed to characterize lymphocyte populations and cytokines/chemokines in twenty-five consecutive patients out of the 80 patients of the GEMRITUX trial; these patients were enrolled in the study because they lived in the Paris area which made it possible to perform the flow cytometry analysis within 24h after blood collection. Controls were 27 healthy donors (HD) matched for age, including blood donors and volunteers from UMR_S1155 (Hôpital Tenon, Paris, France) who consented to the study.
We then investigated the dynamic changes of lymphocyte subpopulations and cytokines/chemokines in the 25 PMN patients at baseline and 8 days, 3 and 6 months after treatment with rituximab added to supportive therapy (n=16) or with supportive therapy alone (n=9).
Anti-PLA2R and anti-THSD7A antibody measurements
Anti-PLA2R antibodies (total IgG) were assessed using the quantitative ELISA test commercialized by EuroImmune AG (Lübeck, Germany) as previously described27. In brief,
sera diluted to 1:100 were incubated with PLA2R already coated microplates and detected by incubation with antihuman IgG HRP conjugate. The final concentrations for each sample were calculated from the calibration curve extinction values plotted against the concentration for each calibrator. ELISA cut-off values were established according to manufacturers’ protocol and the results were considered as negative for<14 RU/ml and positive for ≥ 14 RU/ml. In our laboratory, the calculated intra and inter-assay variations are <4% and <9%, respectively.
Anti-THSD7A antibodies were assessed using an immunofluorescence assay on HEK293 THSD7A-transfected cells kindly provided by Wolfgang Schlumberger (EuroImmune AG). Negativity of THSD7A was defined as absence of detectable antibodies at serum dilution of 1/10. Antibody positivity was defined as positive staining at serum dilutions of 1/10 or higher.
15
In THSD7A-positive patients, quantitative measurements were performed using different serum dilutions (1/10, 1/100, and 1/1000).
Detection of PLA2R and THSD7A antigen in kidney biopsies
Detection was performed as previously described53. Briefly PLA2R and THSD7A were
assessed in glomerular deposits by confocal microscopy with rabbit affinity purified specific anti-PLA2R antibodies or anti-THSD7A antibodies (Atlas Antibodies), followed by goat Alexa 488 conjugated anti-rabbit Fab IgG (Molecular Probes).
Flow cytometry analysis and cytokine/chemokine measurements
Blood (20ml) was sampled according to the planned protocol in lithium heparin tubes. Plasma samples were collected, aliquoted and stored at −80°C until analyzed. Flow cytometry analysis was performed according to previously published methods54 and is described in
supplementary appendix.Plasma samples were collected, aliquoted and stored at −80°C until analyzed. Quantitative determination of 26 cytokines/chemokines (GM-CSF, IFN-α2, IFN-γ, IL-1RA, IL1a, IL1β, IL-2, IL-4, IL-5, IL-6, IL-7, IL-9, IL-10, IL-12p40, IL-12p70 , IL-13, IL-15, IL-17a, IL-35, CXCL-10, CCL-2, CCL-3, CCL-4, CCL-2, TNF-α and IL-2RA) was performed using Human Milliplex HCYTOMAG-60 kits (Millipore) in accordance with the manufacturer protocols54 .
Statistical analysis
Data are presented as mean ± SEM or average (range). Normal distribution of each set of variables was analyzed by D'Agostino & Pearson omnibus normality test. Student’s t-test for normally distributed data and non-parametric Mann–Whitney were used to compare variables as appropriate. Paired data before and after rituximab treatment were compared using Student’s t-test for normally distributed data and paired Wilcoxon signed-rank test for non-parametric. Correlation tests were performed using Spearman nonparametric test. A p value < 0.05 was considered significant. Statistical analyses were performed using GraphPad Prism version 5.0 (GraphPad Software, San Diego, CA, USA).
DISCLOSURES
The GEMRITUX data analysis committee did not include representatives from Hoffmann-La Roche, which provided rituximab for the study. Hoffmann-La Roche was not involved in or
16
consulted about the GEMRITUX study design, did not review the manuscript, and did not have access to the data or provide any other support for the study.
REFERENCES
1. Debiec H, Guigonis V, Mougenot B, et al. Antenatal membranous glomerulonephritis due to anti-neutral endopeptidase antibodies. N. Engl. J. Med. 2002;346: 2053–2060.
2. Beck LH, Fervenza FC, Beck DM, et al. Rituximab-induced depletion of anti-PLA2R autoantibodies predicts response in membranous nephropathy. J. Am. Soc. Nephrol. 2011;22: 1543–1550.
3. Tomas NM, Beck LH, Meyer-Schwesinger C, et al. Thrombospondin type-1 domain-containing 7A in idiopathic membranous nephropathy. N. Engl. J. Med. 2014;371: 2277– 2287.
4. Ronco P, Debiec H. Pathophysiological advances in membranous nephropathy: time for a shift in patient’s care. Lancet Lond. Engl. 2015;385: 1983–1992.
5. Chatenoud L, Bach MA. Abnormalities of T-cell subsets in glomerulonephritis and systemic lupus erythematosus. Kidney Int. 1981;20: 267–274.
6. Cagnoli L, Tabacchi P, Pasquali S, et al. T cell subset alterations in idiopathic glomerulonephritis. Clin. Exp. Immunol. 1982;50: 70–76.
7. Bannister KM, Drew PA, Clarkson AR, Woodroffe AJ. Immunoregulation in glomerulonephritis, Henoch--Schonlein purpura and lupus nephritis. Clin. Exp. Immunol. 1983;53: 384–390.
8. Rothschild E, Chatenoud L. T cell subset modulation of immunoglobulin production in IgA nephropathy and membranous glomerulonephritis. Kidney Int. 1984;25: 557–564.
9. Zucchelli P, Ponticelli C, Cagnoli L, et al. Prognostic value of T lymphocyte subset ratio in idiopathic membranous nephropathy. Am. J. Nephrol. 1988;8: 15–20.
10. Ozaki T, Tomino Y, Nakayama S, Koide H. Two-color analysis of lymphocyte subpopulations in patients with nephrotic syndrome due to membranous nephropathy. Clin. Nephrol. 1992;38: 75–80.
11. Kuroki A, Iyoda M, Shibata T, Sugisaki T. Th2 cytokines increase and stimulate B cells to produce IgG4 in idiopathic membranous nephropathy. Kidney Int. 2005;68: 302–310.
12. Wang B, Zuo K, Wu Y, et al. Correlation between B lymphocyte abnormality and disease activity in patients with idiopathic membranous nephropathy. J. Int. Med. Res. 2011;39: 86– 95.
13. Fervenza FC, Abraham RS, Erickson SB, et al. Rituximab therapy in idiopathic membranous nephropathy: a 2-year study. Clin. J. Am. Soc. Nephrol. 2010;5: 2188–2198
14. Taube D, Brown Z, Williams DG. Impaired lymphocyte and suppressor cell function in minimal change nephropathy, membranous nephropathy and focal glomerulosclerosis. Clin.
17 15. Hirayama K, Ebihara I, Yamamoto S, et al. Predominance of Type-2 Immune Response in
idiopathic Membranous Nephropathy. Nephron 2002;91: 255–261.
16. Masutani K, Taniguchi M, Nakashima H, et al. Up-regulated interleukin-4 production by peripheral T-helper cells in idiopathic membranous nephropathy. Nephrol. Dial. Transplant.
Off. Publ. Eur. Dial. Transpl. Assoc. - Eur. Ren. Assoc. 2004;19: 580–586.
17. Wing K, Sakaguchi S. Regulatory T cells exert checks and balances on self tolerance and autoimmunity. Nat Immunol 2010;11: 7–13.
18. Long SA, Buckner JH. CD4+FOXP3+ T regulatory cells in human autoimmunity: more than a numbers game. J Immunol 2011;187: 2061–6.
19. Grant CR, Liberal R, Mieli-Vergani G, et al. Regulatory T-cells in autoimmune diseases: challenges, controversies and--yet--unanswered questions. Autoimmun. Rev. 2015;14: 105– 116.
20. Bacchetta R, Passerini L, Gambineri E, et al. Defective regulatory and effector T cell functions in patients with FOXP3 mutations. J. Clin. Invest. 2006;116: 1713–1722.
21. Ronco P, Debiec H. Pathophysiological lessons from rare associations of immunological disorders. Pediatr. Nephrol. Berl. Ger. 2009;24: 3–8.
22. Roccatello D, Sciascia S, Di Simone D, et al. New insights into immune mechanisms underlying response to RTX in patients with membranous nephropathy. A prospective study and a review of the literature. Autoimmun. Rev. 2016
23. Dahan K, Debiec H, Plaisier E, et al. Rituximab for severe membranous nephropathy. A 6-month trial with extended follow-up. J. Am. Soc. Nephrol. In press, 2016, doi . 10.1681/ASN.2016040449
24. Klatzmann D, Abbas AK. The promise of low-dose interleukin-2 therapy for autoimmune and inflammatory diseases. Nat. Rev. Immunol. 2015;15: 283–294.
25. Anolik JH, Barnard J, Cappione A, et al. Rituximab improves peripheral B cell abnormalities in human systemic lupus erythematosus. Arthritis Rheum. 2004;50: 3580–3590.
26. Adlowitz DG, Barnard J, Biear JN, et al. Expansion of Activated Peripheral Blood Memory B Cells in Rheumatoid Arthritis, Impact of B Cell Depletion Therapy, and Biomarkers of Response. PLoS ONE [Internet] 10. 2015 Available from. http.//www.ncbi.nlm.nih.gov/pmc/articles/PMC4457888/ [cited 2016 Feb 19]
27. Ruggenenti P, Debiec H, Ruggiero B, et al. Anti-Phospholipase A2 Receptor Antibody Titer Predicts Post-Rituximab Outcome of Membranous Nephropathy. J. Am. Soc. Nephrol. 2015;26:2545-2558.
28. Rodríguez-Bayona B, Ramos-Amaya A, Pérez-Venegas JJ, et al. Decreased frequency and activated phenotype of blood CD27 IgD IgM B lymphocytes is a permanent abnormality in systemic lupus erythematosus patients. Arthritis Res. Ther. 2010;12: R108.
29. Szabó K, Papp G, Szántó A, et al. A comprehensive investigation on the distribution of circulating follicular T helper cells and B cell subsets in primary Sjögren’s syndrome and systemic lupus erythematosus. Clin. Exp. Immunol. 2016;183: 76–89.
30. Hansen A, Reiter K, Ziprian T, et al. Dysregulation of chemokine receptor expression and function by B cells of patients with primary Sjögren’s syndrome. Arthritis Rheum. 2005;52: 2109–2119.
18 31. Cohen CD, Calvaresi N, Armelloni S, et al. CD20-positive infiltrates in human membranous
glomerulonephritis. J. Nephrol. 2005;18: 328–333.
32. Zhang X, Lindwall E, Gauthier C, et al. Circulating CXCR5+CD4+helper T cells in systemic lupus erythematosus patients share phenotypic properties with germinal center follicular helper T cells and promote antibody production. Lupus 2015;24: 909–917.
33. Suranyi MG, Guasch A, Hall BM, Myers BD. Elevated levels of tumor necrosis factor-alpha in the nephrotic syndrome in humans. Am. J. Kidney Dis. Off. J. Natl. Kidney Found. 1993;21: 251–259.
34. Bustos C, González E, Muley R, et al. Increase of tumour necrosis factor alpha synthesis and gene expression in peripheral blood mononuclear cells of children with idiopathic nephrotic syndrome. Eur. J. Clin. Invest. 1994;24: 799–805.
35. Ihm CG, Park JK, Hong SP, et al. Circulating factors in sera or peripheral blood mononuclear cells in patients with membranous nephropathy or diabetic nephropathy. J. Korean Med. Sci. 1997;12: 539–544.
36. Thibaudin D, Thibaudin L, Berthoux P, et al. TNFA2 and d2 alleles of the tumor necrosis factor alpha gene polymorphism are associated with onset/occurrence of idiopathic membranous nephropathy. Kidney Int. 2007;71: 431–437.
37. Matsumoto K. Increased release of tumor necrosis factor-alpha by monocytes from patients with glomerulonephritis. Clin. Nephrol. 1993;40: 148–154.
38. Roll P, Dörner T, Tony H-P. Anti-CD20 therapy in patients with rheumatoid arthritis. predictors of response and B cell subset regeneration after repeated treatment. Arthritis
Rheum. 2008;58: 1566–1575.
39. Duddy M, Niino M, Adatia F, et al. Distinct Effector Cytokine Profiles of Memory and Naive Human B Cell Subsets and Implication in Multiple Sclerosis. J. Immunol. 2007;178: 6092– 6099.
40. Tian Z, Gershwin ME, Zhang C. Regulatory NK cells in autoimmune disease. J. Autoimmun. 2012;39: 206–215.
41. Schleinitz N, Vély F, Harlé J-R, Vivier E. Natural killer cells in human autoimmune diseases.
Immunology 2010;131: 451–458.
42. Gratz IK, Campbell DJ. Organ-specific and memory treg cells. specificity, development, function, and maintenance. Front. Immunol. 2014;5: 333.
43. Sakaguchi S, Miyara M, Costantino CM, Hafler DA. FOXP3+ regulatory T cells in the human immune system. Nat Rev Immunol 2010;10: 490–500.
44. Saadoun D, Rosenzwajg M, Landau D, et al. Restoration of peripheral immune homeostasis after rituximab in mixed cryoglobulinemia vasculitis. Blood 2008;111: 5334–41.
45. Stasi R, Cooper N, Del Poeta G, et al. Analysis of regulatory T-cell changes in patients with idiopathic thrombocytopenic purpura receiving B cell-depleting therapy with rituximab. Blood 2008;112: 1147–1150.
46. Godeau B, Porcher R, Fain O, et al. Rituximab efficacy and safety in adult splenectomy candidates with chronic immune thrombocytopenic purpura. results of a prospective multicenter phase 2 study. Blood 2008;112: 999–1004.
19 47. Sfikakis PP, Souliotis VL, Fragiadaki KG, et al. Increased expression of the FoxP3 functional marker of regulatory T cells following B cell depletion with rituximab in patients with lupus nephritis. Clin. Immunol. Orlando Fla 2007;123: 66–73.
48. Ratanatharathorn V, Pavletic S, Uberti JP. Clinical applications of rituximab in allogeneic stem cell transplantation: anti-tumor and immunomodulatory effects. Cancer Treat Rev. 2009;35:653-661.
49. Olalekan SA, Cao Y, Hamel KM, Finnegan A. B cells expressing IFN-γ suppress Treg-cell differentiation and promote autoimmune experimental arthritis. Eur J Immunol 2015;45:988-998.
50. Shen P, Roch T, Lampropoulou V, et al. IL-35-producing B cells are critical regulators of immunity during autoimmune and infectious diseases. Nature 2014;507:366-370.
51. Avivi I, Stroopinsky D, Katz T. Anti-CD20 monoclonal antibodies. beyond B-cells. Blood
Rev. 2013;27: 217–223.
52. Zhao C et al: Risk MHC class II alleles and amino acid residues in idiopathic membranous nephropathy, J Am Soc Nephrol 2016; in press
53. Svobodova B, Honsova E, Ronco P, et al. Kidney biopsy is a sensitive tool for retrospective diagnosis of PLA2R-related membranous nephropathy. Nephrol. Dial. Transplant. Off. Publ.
Eur. Dial. Transpl. Assoc. - Eur. Ren. Assoc. 2013;28: 1839–1844.
54. Rosenzwajg M, Churlaud G, Mallone R, et al. Low-dose interleukin-2 fosters a dose-dependent regulatory T cell tuned milieu in T1D patients. J. Autoimmun. 2015;58: 48–58.
ACKNOWLEDGMENTS
We thank Alexandra Rousseau (Department of Clinical Pharmacology and Unité de Recherche Clinique (URCEST), AP-HP, Hôpital Saint Antoine, 75012 Paris, France) for precious help during the preparation of this manuscript, Emmanuel Roux for monitoring and handling the biobank at Tenon hospital, Paris (Prof. Isabelle Brocheriou); and the GEMRITUX investigators in Paris who contributed samples and cases. We are extremely grateful to Michèle Barbie, Cornelia Degbe and Nathalie Fery for their technical support.
20
Figures legends
Figure 1. Comparison of B-cell subsets, Treg and NK cells in PMN patients and healthy donors. Multicolor flow cytometry analysis of circulating B, T and NK subpopulations in
PMN patients (n=25) and in healthy donors (n=27). (A) Subsets of gated CD19+ (total) B cells were identified on the basis of the expression of surface markers as follows. naïve (IgD+CD27-), switched memory (IgD-CD27+), non-switched memory (IgD+CD27+), double
negative memory (IgD-CD27-) and expressed as percentage of total B cells; (B) Treg cells
were gated in CD4+ T cells, identified as CD25hiCD127lo/-Foxp3+cells, and expressed as
percentage of total CD4+T cells (left) and counted cells/µl (right); (C) NK cells were
identified as CD3-CD56+ cells gated in lymphocytes and expressed as percentage of
lymphocytes; CD56brightCD16-/lo cells were gated in NK cells and expressed as percentage of
total NK cells. Each box plot represents the median and the 25th and 75th centiles. Error bars
represent the smallest and the largest values. Differences with healthy donors were compared using Student’s t-test when distribution was normal or with non-parametric unpaired Mann-Whitney U test. *p<0.05; **p<0.01; ***p<0.001.
Figure 2. Changes in B cells in PMN patients treated with NIAT-rituximab. Multicolor
flow cytometry analysis of circulating B cells presented for each PMN patient from NIAT-rituximab administration to the end of the follow-up. (A) Kinetics of absolute number of B cells over time from baseline (day 0, n=16), to day 8 (n=16), day 90 (n=14), and day 180 (n=14). (B) Outcome of B cell subsets after NIAT-rituximab compared to baseline (day 0 vs day 180). Levels of B cell subpopulations at day 180 were compared to baseline level using a Wilcoxon signed–rank test *p<0.05; **p<0.01; ***p<0.001.
Figure 3. Changes in Treg cells in PMN patients treated with NIAT-rituximab or NIAT only. Treg analysis was performed by flow cytometry. Tregs were gated in CD4+ T cells and
were identified as CD25hiCD127lo/-Foxp3+cells. A) Data represent changes in
CD25highCD127-Foxp3+ among CD4+ T cells (percentages and absolute numbers/µl) in all
patients over time from NIAT-rituximab administration (day 0; n=16), to day 8 (n=15), day 90 (n=14) and day 180 (n=14). Data are normalized by baseline values for each patient at the different time points and are represented as fold change. B) Kinetics of Treg (percentages and absolute numbers/µ) in responders (n=8), non-responders (n=8) and patients treated with NIAT alone (n=9). C) Comparison of Treg levels at baseline in responder (n=8) and non-responders (n=8) with healthy donors (n=27). Paired data at baseline and during follow-up
21
were compared using Student’s t-test for normally distributed data and paired Wilcoxon signed-rank test for non-parametric distribution *p<0.05; **p<0.01; ***p<0.001.
Figure 4. Changes in NK cells in PMN patients treated with NIAT-rituximab or NIAT.
NK cells analysis was performed by flow cytometry. NK cells were identified as CD3-CD56+
cells gated in lymphocytes and expressed as percentage of lymphocytes, CD56brightCD16-/lo
cells were gated in NK cells and expressed as percentage of total NK cells. A) Data represent changes in NK-cell percentages over time from NIAT-rituximab administration (day 0; n=16) to day 8 (n=16), day 90 (n=14) and day 180 (n=14). B) Data represent changes in CD56brightCD16-/lo-cell percentages over the time from NIAT-rituximab administration (day 0;
n=15) to day 8 (n=14), day 90 (n=13) and day 180 (n=13). C) and D) show absence of changes for NK and CD56brightCD16-/lo cells in patients treated with NIAT only. Paired data at
baseline and during follow-up were compared using Student’s t-test for normally distributed data and paired Wilcoxon signed-rank test for non-parametric distribution *p<0.05; **p<0.01; ***p<0.001.
Figure 5. Correlation between Treg changes and B-cell depletion in responder and non-responder patients. Linear regression representation comparing B cells depletion and Treg
increase at day 180. Data are expressed as difference between baseline and day 180 values for responder (n=7) and non-responder patients (n=7).
Figure 6. Plasma level of TNF- in PMN patients treated with NIAT-rituximab. A)
Quantitative measurement of TNF- in the plasma of patients (n=11) and healthy donors (n=9); B) TNF- levels in patients over time from NIAT-rituximab administration (day 0; n=8), to day 8 (n=7), day 90 (n=6) and day 180 (n=7). Differences with healthy donors were compared using non-parametric unpaired Mann-Whitney U test. Paired data at baseline and during follow-up were compared using Student’s t-test *p<0.05; **p<0.01; ***p<0.001
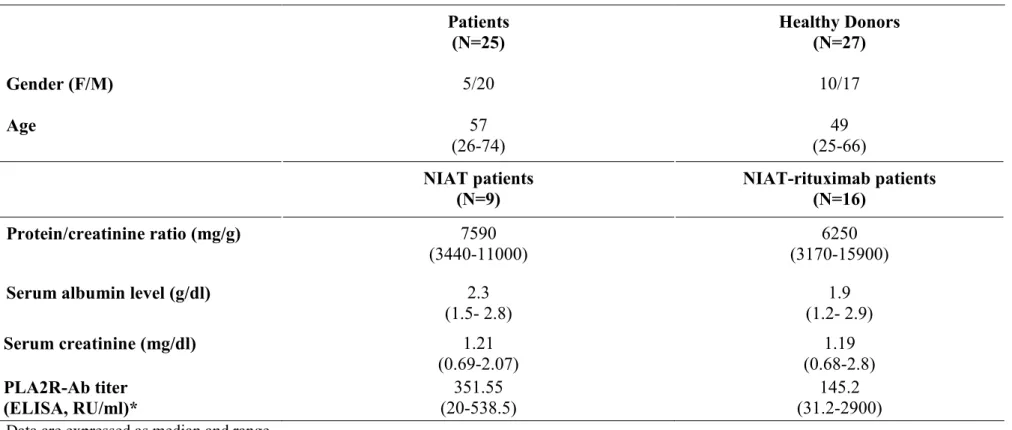
Table 1: Demographic, clinical and biologic characteristics of the study populations Gender (F/M) Age Patients (N=25) 5/20 57 (26-74) Healthy Donors (N=27) 10/17 49 (25-66) NIAT patients (N=9) NIAT-rituximab patients (N=16) Protein/creatinine ratio (mg/g) 7590 (3440-11000) 6250 (3170-15900)
Serum albumin level (g/dl) 2.3
(1.5- 2.8) (1.2- 2.9) 1.9 Serum creatinine (mg/dl) 1.21 (0.69-2.07) 1.19 (0.68-2.8) PLA2R-Ab titer (ELISA, RU/ml)* 351.55 (20-538.5) 145.2 (31.2-2900)
Data are expressed as median and range.
Table 2. Immunopathological data and outcome Patient Number PLA2R-Ab PLA2R-Ag Biopsy PLA2R-related MN Rituximab Clinical remission Immunological remission D0 D8 M3 M6
1 67.1 NA 0 32.87 Positive YES YES NO PR
2 0 0 0 0 Negative NO YES NO
-3 2900 2486 1750 1870 Positive YES YES NO NO
4 1580 1450 120.5 160.6 Positive YES YES NO PR
5 36.1 7.5 0 0 Positive YES YES NO CR
6 216.3 126.1 0 0 Positive YES YES YES CR
7 1379 1624 49.1 30.1 Positive YES YES YES PR
8 74.1 NA 0 22.9 Positive YES YES YES PR
9 1660 1550 137.8 NA Positive YES YES NO undetermined
10 16.9 6.9 0 0 Positive YES YES NO CR
11 31.2 50.7 0 0 Positive YES YES YES CR
12 0 0 0 0 Negative NO YES NO
-13 0 0 0 0 Positive YES YES YES
-14 0 0 0 0 Positive YES YES YES
-15 0 0 0 0 Positive YES YES YES
-16# 0 0 0 0 Negative NO YES YES CR
17 538.5 456.6 995.5 961.1 Positive YES NO NO NO
18 384.3 206.1 88.8 51.8 Positive YES NO NO PR
19 369.5 345.5 100.5 699.7 Positive YES NO NO NO
20 333.6 276.3 84.5 NA Positive YES NO NO undetermined
21 0 0 0 0 Negative NO NO NO
-22 31.2 24.6 16.5 15.1 Positive YES NO NO PR
23 440.9 NA 278.4 68.5 Positive YES NO NO PR
24 24.2 NA 0 0 Positive YES NO Yes CR
25 20.5 18.2 28.7 0 Positive YES NO Yes CR
# Patient 16 had anti-THSD7A antibodies
THSD7A-Ab titer was measured using immunofluorescence test. Titers were 1:100 at D0 and D8. Antibodies were then undetectable at M3 and M6. THSD7A antigen was detected in the subepithelial immune deposits.
Figure 1: Comparison of B-cell subsets, Treg and NK cells in PMN patients and healthy donors
A
B
C
HD IMN 0 2 4 6 8 HD IMN 0 10 20 30 40 HD IMN 0 5 10 15 20 25 HD IMN 0 20 40 60 80 100 CD4 + CD2 5 hi C D 127 -/lo Fox p3 + /µl HD IMN 0 20 40 60 80 100 * IgD + CD2 7 - a m ong C D 1 9 + c e lls HD IMN 0 20 40 60 80 100 * IgD - CD2 7 + a m ong C D 1 9 + c e lls HD IMN 0 20 40 60 80 100 ** IgD + CD2 7 + a m ong C D 1 9 + c e lls HD IMN 0 5 10 15 20 * IgD - CD2 7 - a m ong C D 1 9 + c e lls Naive Switched Memory Non Switched Memory Double negative Memory HD PMN HD PMN HD PMN HD PMN HD PMN HD PMN HD PMN HD PMNFigure 2: Outcome of B cells in PMN patients treated with NIAT-rituximab
A
B
Naive Switched Memory Non Switched Memory Double negative MemoryA
Figure 3: Changes in Treg cells in PMN patients treated with NIAT-rituximab or NIAT only
C
B
NIAT-RTX
A
B
NIAT-RTX
NIAT
Figure 4: Changes in NK cells in IMN patients treated with NIAT-Rituximab or NIAT only
C
Responders
Non Responders
R2=0.29, p=0.21
R2=0.68, p=0.02
Figure 5: Correlation between Treg changes and B-cell depletion in responder and non-responder patients
-300 -200 -100 0 -20 -10 0 10 20 Delta CD19/mm3 D e lt a T re g /m m 3
Figure 6: Plasma level of TNF-α in PMN patients treated with NIAT-rituximab