HAL Id: inserm-00175886
https://www.hal.inserm.fr/inserm-00175886
Submitted on 1 Oct 2007HAL is a multi-disciplinary open access
archive for the deposit and dissemination of sci-entific research documents, whether they are pub-lished or not. The documents may come from teaching and research institutions in France or abroad, or from public or private research centers.
L’archive ouverte pluridisciplinaire HAL, est destinée au dépôt et à la diffusion de documents scientifiques de niveau recherche, publiés ou non, émanant des établissements d’enseignement et de recherche français ou étrangers, des laboratoires publics ou privés.
Study of association between common variation in the
insulin-like growth factor 2 gene and indices of obesity
and body size in middle-aged men and women.
Barbara Heude, Ken Ong, Robert Luben, Nicholas Wareham, Manjinder
Sandhu
To cite this version:
Barbara Heude, Ken Ong, Robert Luben, Nicholas Wareham, Manjinder Sandhu. Study of association between common variation in the insulin-like growth factor 2 gene and indices of obesity and body size in middle-aged men and women.: IGF2 gene and anthropometry in adults. Journal of Clinical Endocrinology and Metabolism, Endocrine Society, 2007, 92 (7), pp.2734-8. �10.1210/jc.2006-1948�. �inserm-00175886�
Study of association between common variation in the IGF2 gene and indices of obesity and body size in middle-age men and women.
Barbara Heude (1,2), Ken K Ong (1,3), Robert Luben (4), Nicholas J Wareham (1), Manjinder S Sandhu (1,4).
1. MRC Epidemiology Unit, Strangeways Research Laboratory, Cambridge, UK 2. INSERM U780-IFR69, Faculté de Médecine Paris Sud, Villejuif, France 3. Department of Paediatrics, University of Cambridge, UK
4. Department of Public Health & Primary Care, Institute of Public Health, University of Cambridge, UK
B.H., K.K.O., R.L., N.J.W., M.S.S. have nothing to declare.
Running title: IGF2 gene and anthropometry in adults
Key words: Insulin-Like Growth Factor 2, Gene, Obesity, Body-Mass Index, Height Word count: 2267
Address correspondence and reprint request to:
Barbara Heude INSERM U780
16 Avenue Paul Vaillant Couturier 94807 Villejuif cedex
FRANCE
Tel: 00 33 1 45 59 51 11 Fax: 00 33 1 47 26 94 54 heude@vjf.inserm.fr
HAL author manuscript inserm-00175886, version 1
HAL author manuscript
Abstract
Context: The Insulin-like Growth Factor 2 gene (IGF2) plays a key role in growth and is a candidate for association with obesity. Previous studies have reported that polymorphisms in IGF2 are associated with body weight and body mass index (BMI), but the results have been inconsistent. The primary aim of this study was to confirm the association with BMI, and secondarily to study the associations with other indices of body size. Methods: In a sample of 2797 women and 2203 men aged 39-79 participating in the Norfolk arm of the European Prospective Investigation of Cancer (EPIC), we genotyped three SNPs in the IGF2 gene that were previously associated with BMI (6815 A/T, 1156 T/C (G/A), 820 G/A (ApaI)). Results: No significant associations were observed between these SNPs and BMI. However, all three SNPs were significantly associated with height (p=0.03 to 0.001). In a backwards elimination regression analysis, two SNPs 1156 T/C (G/A) and 820 G/A remained independently associated with height (p=0.003 and p=0.038 respectively). Haplotype analysis of these two SNPs showed that carriers of the GA haplotype were shorter than carriers of each of the other three haplotypes (p<0.001 for all comparisons). Conclusion: We did not confirm the previously reported associations between IGF2 polymorphisms and BMI. However our results suggest that common variation in the IGF2 gene may be associated with adult height. IGF2 could be considered as a candidate gene for future research on mechanisms for the association between height and chronic diseases such as cancer, diabetes and coronary heart disease.
The Insulin-like growth factor 2 gene (IGF2) is exclusively paternally expressed, and maternally imprinted, and plays a key role in fetal growth and development (1, 2). Mice with null mutations in the Igf2 gene exhibit decreased fetal growth (3). In humans IGF2 under-expression caused by methylation defects results in the low birth weight Silver-Russell syndrome (4), and conversely, loss-of-imprinting leading to
IGF2 over-expression results in the Beckwith-Wiedemann somatic overgrowth
syndrome (5).
In postnatal life, Igf2 expression in mice is repressed in all tissues except the brain, and deregulation of Igf2 expression results in postnatal overgrowth (6). In pigs a quantitative trait locus for muscle growth and leanness has been identified in the
IGF2 region (7). In humans, IGF2 is biallelically expressed in the liver in postnatal
life, and the syndromes of IGF2 under- and over-expression exhibit postnatal growth failure and growth acceleration respectively (4, 5).
Common allelic variants in IGF2 have been associated with body weight and BMI in large population-based studies. In a study of 2,500 UK middle-aged men, the IGF2 ApaI (820 G/A) minor allele homozygotes had higher serum IGF-II concentrations and lower BMI and body weight than wild-type homozygotes (8). A subsequent study in the same population investigated 11 other polymorphic markers in IGF2, and found that two further IGF2 SNPs were independently associated with BMI (9): minor allele homozygotes at 6815 A/T also had lower BMI, while minor allele homozygotes at 1156 T/C had higher BMI than wild-type homozygotes (9). By contrast, a separate study of 500 healthy men and women found that ApaI 820 G/A minor allele homozygotes had higher fat mass than wild-type homozygotes (10).
Given these inconsistent results, we selected the three IGF2 SNPs previously reported to be independently associated with BMI (9) and aimed to confirm this
association in a UK population of 5000 middle-age men and women. Our secondary aim was to investigate the associations with body fat and also height, as some studies had identified associations with height but these were not highlighted in those reports (8, 10, 18-20).
Research design and methods
Population
We analysed data from the Norfolk arm of the European Prospective Investigation of Cancer (EPIC) prospective cohort study. This study has been described elsewhere (11, 12), but, in brief, is a prospective population study of 25,639 men and women aged between 39 and 79 years, resident in Norfolk, UK. Participants were recruited from age-sex registers of general practices in Norfolk as part of the 10-country collaborative EPIC study designed to investigate dietary and other determinants of cancer. Additional data were obtained in EPIC-Norfolk to enable the assessment of determinants of other diseases. The sub-cohort used for this study is a random sample of 5000 of the participants who were free of disease at baseline (cancer, coronary heart disease and diabetes), who had completed arrayed DNA samples, complete food frequency questionnaires, and HbA1C and BMI measured at two clinical assessments separated by an average of 3 years (13) (see Table 1 for clinical characteristics). All participants gave informed consent.
Measurements
All participants completed a detailed health and lifestyle questionnaire, which includeda question on birth weight. Anthropometric measurements were taken with participants dressed in light clothing and no shoes. Standing height was measured to the nearest 0.1 cm using a stadiometer, and weight was measured to the nearest 100 g using Salter scales (Salter Brecknell Weighing Products, Fairmont, Minnesota). BMI was calculated as weight (kg)/height (m)2. At follow-up only, sitting height was additionally measured, and leg length was calculated as the difference between overall height and sitting height, plus the height of the measuring stool used for the sitting
height measurements. Trunk length was calculated as the difference between leg lengthand total height. Also at follow-up, a Tanita TBF-531 bioimpedance analyzer was used to determine percent body fat, to the nearest 0.5%.
SNPs choice
In the Northwick Park Heart Study II (NPHSII), the authors conducted a systematic search for variants across the exons, the intron/exon boundaries and intron three of the IGF2 gene, and identified 12 different markers (9). Four SNPs were associated with BMI, of which two were in strong linkage disequilibrium (LD) (pairwise coefficient = 0.87). We therefore selected three SNPs which were not in LD (see supplementary material): 6815 A/T (rs3842759) at nucleotide position 6815 in the GenBank sequence L15440, 1156 T/C (G/A) at nucleotide position 1156 in the GenBank sequence Y13633 and 820 G/A (ApaI, rs680) at nucleotide position 820 in the GenBank sequence X07868. 6815 A/T and 1156 T/C (G/A) are on intronic regions whereas 820 G/A (ApaI) is on exon 9.
Genotyping
All SNPs were genotyped using Custom TaqMan® assays (Applied Biosystems, Warrington, UK) on an ABI PRISM® 7900HT Sequence Detection System (Applied Biosystems, Warrington, UK). Details for all genotyping primers, probes and PCR conditions are available upon request from the corresponding author. The three SNPs had a genotyping call rate above 93% and all of the duplicate controls used in the study set were fully concordant.
Statistical analysis
Each SNP was tested for Hardy–Weinberg equilibrium using the appropriate χ2 test. We used linear regression to test the association between each genotype
(independent variable) and each anthropometric outcome (dependent variable) adjusting for age and sex. We tested the association under an additive (co-dominant) model by entering each genotype as a quantitative variable (wild/wild; wild/variant; variant/variant). Recessive models were also tested (i.e. variant/variant vs carrier of the wild allele). All analyses were performed with SAS version 8.2 (SAS Institute Inc, Cary, NC).
Haplotype analysis was undertaken using the SNPs which remained independently associated with height after a backwards elimination regression analysis. Because phase was unknown, assignment of haplotype probabilities was performed using the SNPHAP program (14, 15). We then used the qhapipf program in STATA to test whether the haplotypes explained more of the variance in height than the genotypes considered independently (16). Finally, tests for main haplotype effects were performed using a linear model, adjusted for age and gender, weighted by haplotype probability, and clustered by the individual identification to obtain robust standard errors (STATA regression command xi:regres).
Results
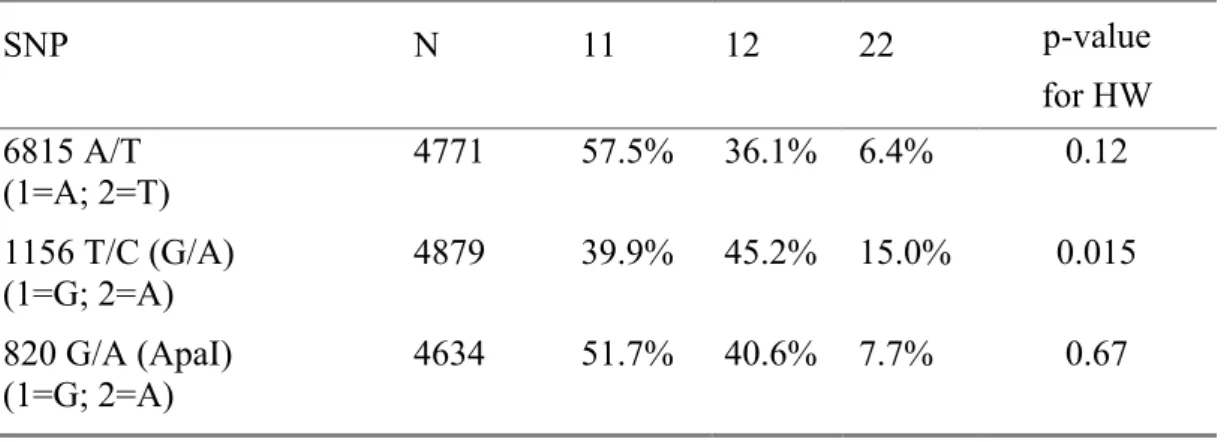
Genotype frequencies for the three SNPs are provided in Table 2. The two SNPs 6815 A/T and 820 G/A ApaI were in Hardy-Weinberg (H-W) equilibrium (p=0.12 and p=0.67 respectively). However, the frequencies for 1156 T/C (G/A) differed slightly from the expected Hardy-Weinberg proportions (p=0.015). The 1156 T/C (G/A) genotypes were confirmed on re-genotyping of the whole cohort. The genotype frequencies were similar in women (40%, 45% and 15% for the GG, GA and AA respectively) and in men (38%, 46% and 15%); however, the deviation was significant only in women (p=0.017 vs p=0.32 in men) and is likely explained by random sampling.
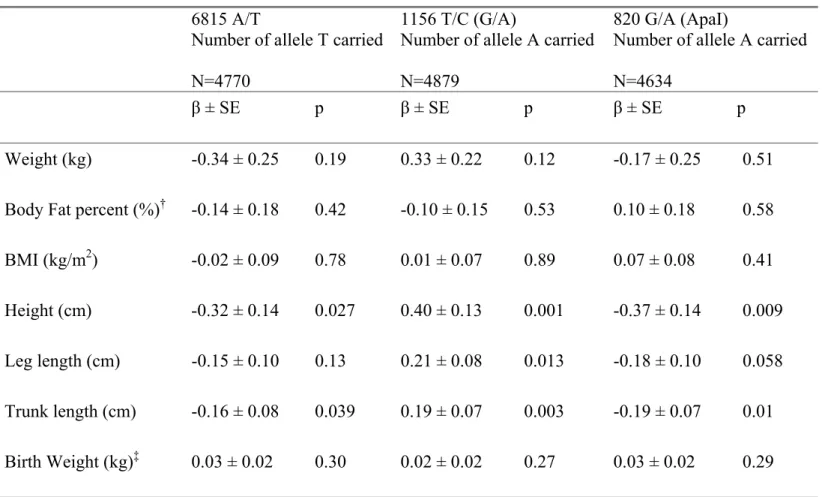
Table 3 presents the regression coefficients for each anthropometric outcome with genotype considered as a quantitative trait (co-dominant model). The three SNPs were not associated with any of the obesity indices, but all three SNPs were associated with height. The minor alleles of 6815 A/T and 820 G/A were additively associated with shorter height (-0.32 cm per T allele carried, p=0.027 and -0.37 cm per A allele carried, p=0.009 respectively), while the minor allele of 1156 T/C (G/A) was associated with taller height (+0.40 cm per A allele carried p=0.001). The effect sizes were very similar with trunk length and leg length for all SNPs. Birth weight and body fat percent were only available for 2235 and 3750 individuals respectively and no significant association was observed with genotype for either of these outcomes.
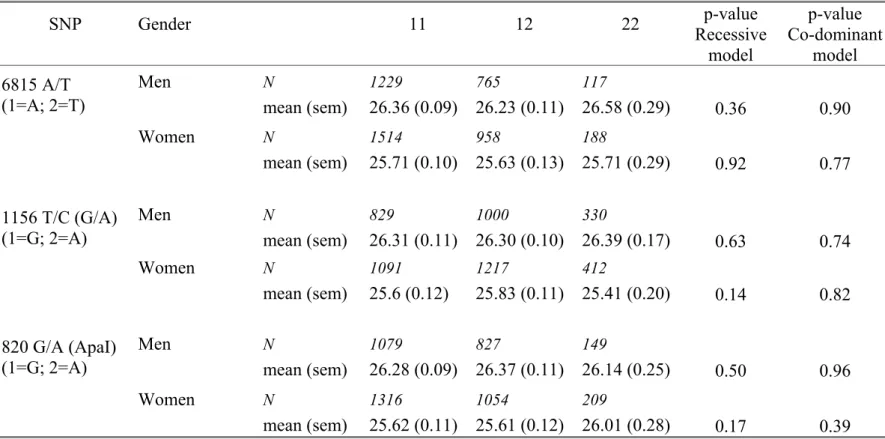
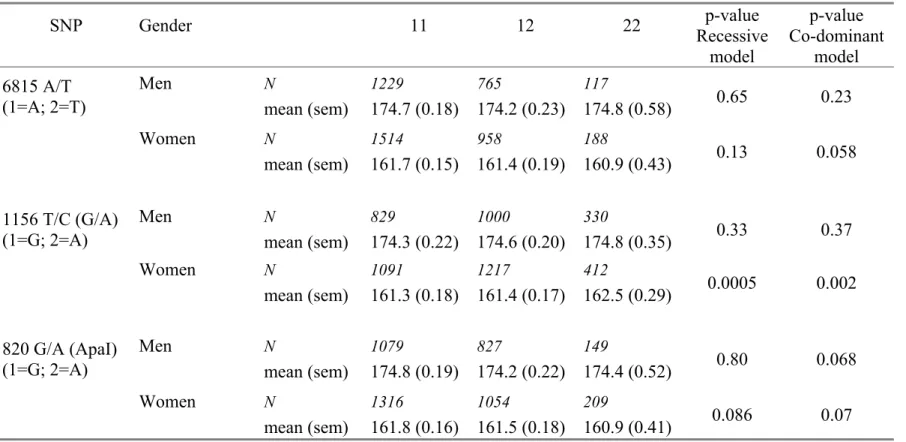
Adjusted means for BMI and height by genotype are displayed separately in men and women in Table 4 and Table 5 respectively. No association with BMI was disclosed. The pattern of association with height was similar in men and women for
the 1156 T/C (G/A) and the 820 G/A SNPs, but was stronger in women than in men for 1156 T/C (G/A) (p=0.002 vs p=0.37 under the co-dominant model).
In a backwards elimination multiple regression analysis, 1156 T/C (G/A) and 820
G/A (ApaI) remained independently and significantly associated with height (p=0.003
and p=0.037 respectively).
The frequencies for the haplotypes corresponding to those two SNPs, and the age and sex adjusted mean height according to the haplotypes are presented in Figure 1. The overall association between haplotypes and height was highly significant (p=0.0002). The haplotypes explained more of the variability in height than when the SNPs were considered independently (p=0.0391). Mean height of individuals with the haplotype GA (frequency of 18.6%) was significantly lower than that of any other haplotype (p<0.001 with AG, AA and GG). Among the remaining haplotypes, only a weak difference was observed between AG and GG (p=0.075).
Discussion
This study of around 5,000 middle age women and men from a population-based cohort provides no evidence for an association between IGF2 common polymorphisms and indices of obesity. However, all three SNPs were associated with height, and similar trends were seen in men and women separately. Our results suggest a role of the IGF2 gene in adult height, which may be consistent with the action of IGF-II protein as a growth factor.
It was previously reported in the NPHSII Study of men only, that the three IGF2 polymorphisms we selected were independently associated with BMI (8, 9, 17). However, our study in a larger number of individuals including both men and women, did not support that observation. Another study in a Caucasian population showed that the IGF2 ApaI polymorphism was related to fat mass, but the association was in the opposite direction to that in the NPHSII (10). Furthermore O’Dell et al. did not find an association between the ApaI polymorphism and body weight in their sample of young adults from NPHSII (8), in contrast to their older population. They concluded that the effect on BMI might occur only later in life, possibly as a consequence of interaction with environmental factors related to age (8). Since these factors are likely to vary between populations, gene-environmental interactions could explain the discrepancies observed between the studies. However, in our population with a wide age range of men and women (39 to 79 years), we did not observe any significant interaction between the effects of age and genotypes. Therefore, the associations identified in the original study between the 3 SNPs and BMI could be false-positives;
however, discrepant findings between studies could also arise from differences in subject ascertainment or population structure.
However, consistent with our current findings those previous studies also found associations between IGF2 polymorphisms and adult height, although these findings were not highlighted in those reports. First, in the NPHSII population a trend for an association between the 820 G/A (ApaI) and height was found. Consistent with our findings GG homozygotes tended to be taller than AA (8): the size of the effect (0.7 cm difference; p=0.10) was comparable to our study but the sample size of that study was smaller (8). In the same population a further IGF2 SNP at 1252 T/C AluI, which is in positive LD with 820 G/A (ApaI), was significantly associated with height (p=0.0019) (18), as were two IGF2, INS and TH gene region haplotypes (19). Furthermore, in a Hertfordshire UK population 820 G/A (ApaI) GG homozygotes tended to be both heavier and taller than AA homozygotes (20). Finally, in the Baltimore Longitudinal Study of Aging, women with the 820 G/A (ApaI) A/A genotype were shorter than G/G carriers (p<0.05), and a similar trend was observed in men (10).
In the present study, participants were exclusively European, living in the same geographical area in the east of England. Although this is an ethnically homogeneous population, we cannot completely exclude the existence of underlying genetic heterogeneity.
The mechanisms by which the IGF2 gene could be associated with adult height remain to be elucidated. IGFs are peptides that regulate growth, differentiation and regeneration of cells (21). In particular, placental-specific IGF-II is a major modulator
of placental and fetal growth (22, 23). Common variants in the IGF2 gene have been associated with the Beckwith-Wiedemann fetal overgrowth syndrome, and such children are noted to be tall (24, 25). However, if the effect observed here originated in fetal life, one would expect an association with birth weight that we did not find. The absence of this association could be explained by a lack of power in our study, as the information on birth weight was missing for more than half of the population. Furthermore, a standardized measure of birth length would have been a much better outcome to test this hypothesis than reported birth weight. Alternatively, IGF2 may impact postnatal growth in infancy, childhood or adolescence. Children with constitutionally tall stature had significantly higher growth velocity and higher IGF-II levels than children with normal height (26). That study suggested that IGF-II might be responsible for overgrowth of children with constitutionally tall stature, having an increase in activity on target tissues, particularly at the level of cartilaginous and bone tissue (26).
In conclusion, we did not confirm previous results of the association between
IGF2 polymorphisms and obesity indexes in adults in our study. Others SNPs in the
IGF2 region could be involved and our limited choice of SNPs does not allow us to
exclude a possible role of common IGF2 variation in body weight regulation in adults. However, our results suggest that common IGF2 SNPs may regulate adult height. More studies are needed, especially in populations of healthy infants, children and adolescents, to investigate the timing of this IGF2 effect on postnatal growth velocity and height. IGF2 should be considered as a candidate gene to explain the associations between adult height and chronic diseases such as cancer, diabetes and coronary heart disease (27-29).
Acknowledgements
We thank the Danone Institute for funding B Heude on this work. The EPIC-Norfolk cohort is supported by grant funding from the Cancer Research Campaign, the Medical Research Council, the Stroke Association, the British Heart Foundation, the Department of health, the Commission of the European Union’s Europe against Cancer Programme, and the Department for Environment, Food, and Rural Affairs.
References
1. O'Dell SD, Day IN 1998 Insulin-like growth factor II (IGF-II). Int J Biochem Cell Biol 30:767-771
2. Reik W, Walter J 2001 Genomic imprinting: parental influence on the genome. Nat Rev Genet 2:21-32
3. DeChiara TM, Efstratiadis A, Robertson EJ 1990 A growth-deficiency phenotype in heterozygous mice carrying an insulin-like growth factor II gene disrupted by targeting. Nature 345:78-80
4. Gicquel C, Rossignol S, Cabrol S, Houang M, Steunou V, Barbu V, Danton F, Thibaud N, Merrer ML, Burglen L, Bertrand AM, Netchine I, Bouc YL 2005 Epimutation of the telomeric imprinting center region on chromosome 11p15 in Silver-Russell syndrome. Nat Genet 37:1003-1007 5. Engel JR, Smallwood A, Harper A, Higgins MJ, Oshimura M, Reik W,
Schofield PN, Maher ER 2000 Epigenotype-phenotype correlations in Beckwith-Wiedemann syndrome. J Med Genet 37:921-926
6. Jones BK, Levorse J, Tilghman SM 2001 Deletion of a nuclease-sensitive region between the Igf2 and H19 genes leads to Igf2 misregulation and increased adiposity. Hum Mol Genet 10:807-814
7. Nezer C, Moreau L, Brouwers B, Coppieters W, Detilleux J, Hanset R, Karim L, Kvasz A, Leroy P, Georges M 1999 An imprinted QTL with major effect on muscle mass and fat deposition maps to the IGF2 locus in pigs. Nat Genet 21:155-156
8. O'Dell SD, Miller GJ, Cooper JA, Hindmarsh PC, Pringle PJ, Ford H, Humphries SE, Day IN 1997 Apal polymorphism in insulin-like growth
factor II (IGF2) gene and weight in middle-aged males. Int J Obes Relat Metab Disord 21:822-825
9. Gaunt TR, Cooper JA, Miller GJ, Day IN, O'Dell SD 2001 Positive associations between single nucleotide polymorphisms in the IGF2 gene region and body mass index in adult males. Hum Mol Genet 10:1491-1501 10. Roth SM, Schrager MA, Metter EJ, Riechman SE, Fleg JL, Hurley BF,
Ferrell RE 2002 IGF2 genotype and obesity in men and women across the adult age span. Int J Obes Relat Metab Disord 26:585-587
11. Riboli E, Kaaks R 1997 The EPIC Project: rationale and study design.
European Prospective Investigation into Cancer and Nutrition. Int J Epidemiol 26 Suppl 1:S6-14
12. Day N, Oakes S, Luben R, Khaw KT, Bingham S, Welch A, Wareham N 1999 EPIC-Norfolk: study design and characteristics of the cohort. European Prospective Investigation of Cancer. Br J Cancer 80 Suppl 1:95-103
13. Sandhu MS, Heude B, Young EH, Luben R, Luan JA, Khaw KT, Todd J, Wareham NJ 2005 INS VNTR genotype and indices of growth and obesity: population based studies of 7,999 middle-aged men and women. In press 14. Clayton D SNPHAP: a program for estimating frequencies of large
haplotypes of SNPs (Version 1.0). In: http://www-gene.cimr.cam.ac.uk/clayton/software/ ed.
15. Adkins RM 2004 Comparison of the accuracy of methods of computational haplotype inference using a large empirical dataset. BMC Genet 5:22
16. Mander A 2003 QHAPIPF: Stata module to perform Analysis of quantitative traits using regression and log-linear modelling when PHASE is unknown. In: Boston College Department of Economics
17. O'Dell SD, Bujac SR, Miller GJ, Day IN 1999 Associations of IGF2 ApaI RFLP and INS VNTR class I allele size with obesity. Eur J Hum Genet 7:821-827
18. Gu D, O'Dell SD, Chen XH, Miller GJ, Day IN 2002 Evidence of multiple causal sites affecting weight in the IGF2-INS-TH region of human
chromosome 11. Hum Genet 110:173-181
19. Rodriguez S, Gaunt TR, O'Dell SD, Chen XH, Gu D, Hawe E, Miller GJ, Humphries SE, Day IN 2004 Haplotypic analyses of the IGF2-INS-TH gene cluster in relation to cardiovascular risk traits. Hum Mol Genet 13:715-725 20. Sayer AA, Syddall H, O'Dell SD, Chen XH, Briggs PJ, Briggs R, Day IN,
Cooper C 2002 Polymorphism of the IGF2 gene, birth weight and grip strength in adult men. Age Ageing 31:468-470
21. Regnault TR, de Vrijer B, Anthony RV 2002 The IGF-II-deficient placenta: aspects of its function. Trends Endocrinol Metab 13:410-412
22. Constancia M, Hemberger M, Hughes J, Dean W, Ferguson-Smith A, Fundele R, Stewart F, Kelsey G, Fowden A, Sibley C, Reik W 2002 Placental-specific IGF-II is a major modulator of placental and fetal growth. Nature 417:945-948
23. Hill DJ, Petrik J, Arany E 1998 Growth factors and the regulation of fetal growth. Diabetes Care 21 Suppl 2:B60-69
24. Murrell A, Heeson S, Cooper WN, Douglas E, Apostolidou S, Moore GE, Maher ER, Reik W 2004 An association between variants in the IGF2 gene and Beckwith-Wiedemann syndrome: interaction between genotype and epigenotype. Hum Mol Genet 13:247-255
25. Weksberg R, Smith AC, Squire J, Sadowski P 2003 Beckwith-Wiedemann syndrome demonstrates a role for epigenetic control of normal development. Hum Mol Genet 12 Spec No 1:R61-68
26. Garrone S, Radetti G, Sidoti M, Bozzola M, Minuto F, Barreca A 2002 Increased insulin-like growth factor (IGF)-II and IGF/IGF-binding protein ratio in prepubertal constitutionally tall children. J Clin Endocrinol Metab 87:5455-5460
27. Gunnell D, Okasha M, Smith GD, Oliver SE, Sandhu J, Holly JM 2001 Height, leg length, and cancer risk: a systematic review. Epidemiol Rev 23:313-342
28. Lawlor DA, Ebrahim S, Davey Smith G 2002 The association between components of adult height and Type II diabetes and insulin resistance: British Women's Heart and Health Study. Diabetologia 45:1097-1106
29. Lawlor DA, Taylor M, Davey Smith G, Gunnell D, Ebrahim S 2004 Associations of components of adult height with coronary heart disease in postmenopausal women: the British women's heart and health study. Heart 90:745-749
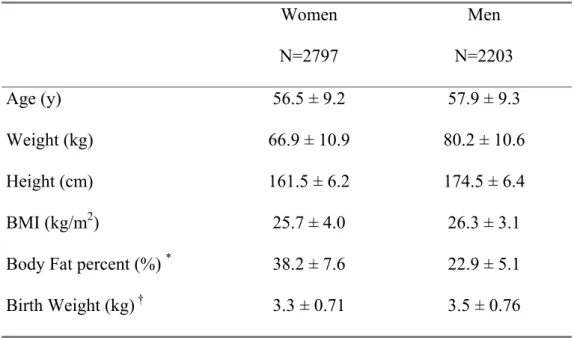
Table 1: Population description, the EPIC5000 study Women N=2797 Men N=2203 Age (y) 56.5 ± 9.2 57.9 ± 9.3 Weight (kg) 66.9 ± 10.9 80.2 ± 10.6 Height (cm) 161.5 ± 6.2 174.5 ± 6.4 BMI (kg/m2) 25.7 ± 4.0 26.3 ± 3.1
Body Fat percent (%) * 38.2 ± 7.6 22.9 ± 5.1
Birth Weight (kg) † 3.3 ± 0.71 3.5 ± 0.76
Results are mean ± sd *
N = 1997 in women and 1725 in men †
N = 1442 in women and 778 in men
Table 2: Genotype frequencies and Hardy-Weinberg (HW) equilibrium test SNP N 11 12 22 p-value for HW 6815 A/T (1=A; 2=T) 4771 57.5% 36.1% 6.4% 0.12 1156 T/C (G/A) (1=G; 2=A) 4879 39.9% 45.2% 15.0% 0.015 820 G/A (ApaI) (1=G; 2=A) 4634 51.7% 40.6% 7.7% 0.67
Table 3: Regression coefficients ± SE for each anthropometric outcome regressed on the three genotypes considered as quantitative traits (number of variant allele carried, corresponds to a co-dominant model).
6815 A/T
Number of allele T carried N=4770
1156 T/C (G/A)
Number of allele A carried N=4879
820 G/A (ApaI)
Number of allele A carried N=4634
β ± SE p β ± SE p β ± SE p
Weight (kg) -0.34 ± 0.25 0.19 0.33 ± 0.22 0.12 -0.17 ± 0.25 0.51 Body Fat percent (%)† -0.14 ± 0.18 0.42 -0.10 ± 0.15 0.53 0.10 ± 0.18 0.58 BMI (kg/m2) -0.02 ± 0.09 0.78 0.01 ± 0.07 0.89 0.07 ± 0.08 0.41
Height (cm) -0.32 ± 0.14 0.027 0.40 ± 0.13 0.001 -0.37 ± 0.14 0.009 Leg length (cm) -0.15 ± 0.10 0.13 0.21 ± 0.08 0.013 -0.18 ± 0.10 0.058
Trunk length (cm) -0.16 ± 0.08 0.039 0.19 ± 0.07 0.003 -0.19 ± 0.07 0.01 Birth Weight (kg)‡ 0.03 ± 0.02 0.30 0.02 ± 0.02 0.27 0.03 ± 0.02 0.29 Linear regression models including age and sex as covariates.
†
N = 3584, 3673 and 3493 respectively for the 3 SNPs ‡
N = 2134, 2185 and 2088 respectively for the 3 SNPs
Table 4: Age adjusted means (sem) of BMI (kg/m2) according to the three SNP genotypes in men and women. SNP Gender 11 12 22 p-value Recessive model p-value Co-dominant model 6815 A/T (1=A; 2=T) Men N mean (sem) 1229 26.36 (0.09) 765 26.23 (0.11) 117 26.58 (0.29) 0.36 0.90 Women N mean (sem) 1514 25.71 (0.10) 958 25.63 (0.13) 188 25.71 (0.29) 0.92 0.77 1156 T/C (G/A) (1=G; 2=A) Men N mean (sem) 829 26.31 (0.11) 1000 26.30 (0.10) 330 26.39 (0.17) 0.63 0.74 Women N mean (sem) 1091 25.6 (0.12) 1217 25.83 (0.11) 412 25.41 (0.20) 0.14 0.82 820 G/A (ApaI) (1=G; 2=A) Men N mean (sem) 1079 26.28 (0.09) 827 26.37 (0.11) 149 26.14 (0.25) 0.50 0.96 Women N mean (sem) 1316 25.62 (0.11) 1054 25.61 (0.12) 209 26.01 (0.28) 0.17 0.39
Table 5: Age adjusted means (sem) of height (cm) according to the three SNP genotypes in men and women. SNP Gender 11 12 22 p-value Recessive model p-value Co-dominant model 6815 A/T (1=A; 2=T) Men N mean (sem) 1229 174.7 (0.18) 765 174.2 (0.23) 117 174.8 (0.58) 0.65 0.23 Women N mean (sem) 1514 161.7 (0.15) 958 161.4 (0.19) 188 160.9 (0.43) 0.13 0.058 1156 T/C (G/A) (1=G; 2=A) Men N mean (sem) 829 174.3 (0.22) 1000 174.6 (0.20) 330 174.8 (0.35) 0.33 0.37 Women N mean (sem) 1091 161.3 (0.18) 1217 161.4 (0.17) 412 162.5 (0.29) 0.0005 0.002 820 G/A (ApaI) (1=G; 2=A) Men N mean (sem) 1079 174.8 (0.19) 827 174.2 (0.22) 149 174.4 (0.52) 0.80 0.068 Women N mean (sem) 1316 161.8 (0.16) 1054 161.5 (0.18) 209 160.9 (0.41) 0.086 0.07
Figure 1: Association of IGF2 haplotypes for 1156T/C (G/A) and 820G/A (ApaI) with adult
height. Tests for main haplotype effects used the Stata regression command xi:regres weighted
by the haplotype assignment probability and clustered by the individual identification to obtain
robust standard errors. The test of haplotype information against independent genotype
information was tested using the Stata command qhapipf and was statistically significant
(p=0.039). Analyses were adjusted for age and gender.
*** p<0.0001 ** p=0.0008