A deep learning approach to classify atherosclerosis
using intracoronary optical coherence tomography
The MIT Faculty has made this article openly available.
Please share
how this access benefits you. Your story matters.
Citation
Athanasiou, Lambros S. et al. “A deep learning approach to classify
atherosclerosis using intracoronary optical coherence tomography.”
Medical Imaging 2019: Computer-Aided Diagnosis, vol. 10950 ©
2019 The Author(s)
As Published
10.1117/12.2513078
Publisher
SPIE
Version
Final published version
Citable link
https://hdl.handle.net/1721.1/126580
Terms of Use
Article is made available in accordance with the publisher's
policy and may be subject to US copyright law. Please refer to the
publisher's site for terms of use.
PROCEEDINGS OF SPIE
SPIEDigitalLibrary.org/conference-proceedings-of-spieA deep learning approach to classify
atherosclerosis using intracoronary
optical coherence tomography
Lambros S. Athanasiou, Max L. Olender, José M. de la
Torre Hernandez, Eyal Ben-Assa, Elazer R. Edelman
Lambros S. Athanasiou, Max L. Olender, José M. de la Torre Hernandez,
Eyal Ben-Assa, Elazer R. Edelman, "A deep learning approach to classify
atherosclerosis using intracoronary optical coherence tomography ," Proc.
SPIE 10950, Medical Imaging 2019: Computer-Aided Diagnosis, 109500N (13
March 2019); doi: 10.1117/12.2513078
A deep learning approach to classify atherosclerosis using
intracoronary optical coherence tomography
Lambros S. Athanasiou
*a,b, Max L. Olender
a,c, José M. de la Torre Hernandez
d, Eyal Ben-Assa
e,f,
Elazer R. Edelman
a,ba
Institute for Medical Engineering and Science, Massachusetts Institute of Technology, Cambridge,
MA, United States;
bCardiovascular Division, Brigham and Women’s Hospital, Harvard Medical
School, Boston, MA, United States;
cDepartment of Mechanical Engineering, Massachusetts
Institute of Technology, Cambridge, MA, United States;
dHospital Universitario Marques de
Valdecilla, Unidad de Cardiologia Intervencionista, Servicio de Cardiologia, Santander, Spain;
e
Massachusetts General Hospital, Harvard Medical School, Cardiology Division, Department of
Medicine, Boston, MA United States;
fTel Aviv Sourasky Medical Center, Sackler Faculty of
Medicine, Cardiology Division, Tel Aviv, Israel
ABSTRACT
Optical coherence tomography (OCT) is a fiber-based intravascular imaging modality that produces high-resolution tomographic images of artery lumen and vessel wall morphology. Manual analysis of the diseased arterial wall is time consuming and sensitive to inter-observer variability; therefore, machine-learning methods have been developed to automatically detect and classify mural composition of atherosclerotic vessels. However, none of the tissue classification methods include in their analysis the outer border of the OCT vessel, they consider the whole arterial wall as pathological, and they do not consider in their analysis the OCT imaging limitations, e.g. shadowed areas. The aim of this study is to present a deep learning method that subdivides the whole arterial wall into six different classes: calcium, lipid tissue, fibrous tissue, mixed tissue, non-pathological tissue or media, and no visible tissue. The method steps include defining wall area (WAR) using previously developed lumen and outer border detection methods, and automatic characterization of the WAR using a convolutional neural network (CNN) algorithm. To validate this approach, 700 images of diseased coronary arteries from 28 patients were manually annotated by two medical experts, while the non-pathological wall and media was automatically detected based on the Euclidian distance of the lumen to the outer border of the WAR. Using the proposed method, an overall classification accuracy 96% is reported, indicating great promise for clinical translation.
Keywords: Optical coherence tomography, Deep learning, Atherosclerosis, Convolutional neural network
1. INTRODUCTION
Intravascular optical coherence tomography (OCT)1,2 is a catheter-based imaging modality developed over recent decades
that has become popular in interventional cardiology. OCT has much higher resolution than other intravascular imaging modalities, like intravascular ultrasound (IVUS): 12-18 microns axially and a lateral resolution of 20-90 microns3. OCT
calculates the proportion of the light backscattered and absorbed by the vessel tissue and reconstructs two-dimensional (2D) images which represent the cross sections of the imaged vessel.
OCT can provide accurate measurements of a vessel’s lumen, assess wall morphology, and allow detection of four different tissue types4: calcium (CA), lipid tissue (LT), fibrous tissue (FT), and mixed tissue (MT). Moreover, it enables the detection
of features that are associated with plaque vulnerability, including the measurement of fibrous cap thickness, which cannot be accurately evaluated by IVUS or by any other intravascular imaging technique5. However, the technology has a serious
drawback, the limited tissue penetration (maximum depth: 1.5-2.0 mm)4, which may not allow visualization and
assessment of the entire plaque and the media-adventitia border.
The aforementioned limitation of OCT led to the implementation of automated analysis methodologies that detected only the lumen border of the vessel6–9, or the lumen border and estimated the plaque area of the vessel10,11. Since manual plaque
*[email protected]; [email protected]; phone +1 617 715 4569.
Medical Imaging 2019: Computer-Aided Diagnosis, edited by Kensaku Mori, Horst K. Hahn, Proc. of SPIE Vol. 10950, 109500N · © 2019 SPIE
CCC code: 1605-7422/19/$18 · doi: 10.1117/12.2513078 Proc. of SPIE Vol. 10950 109500N-1
characterization is time consuming and relies on well-trained readers, several studies attempted to automatically detect the various plaque components using OCT images12. Xu et al.13 correlated the backscattering and attenuation coefficients with
CA, LT, and FT, while, in a similar attempt, van Soest et al.14 correlated the attenuation coefficients with healthy vessel
wall, intimal thickening, lipid pool, and macrophage infiltration. However, they both failed to define any clear threshold values between the different tissue types. Going one step further and using machine learning, Athanasiou et al.10 presented
a fully-automated OCT plaque characterization method which classified plaque as CA, LT, FT, or MT, with 83% accuracy. More recently, deep learning approaches using convolutional neural networks (CNNs)15–18 were presented, achieving an
overall accuracy of up to 91.7%18.
Although, CNN-based methods outperformed machine learning methods, they all failed to characterize the whole arterial wall, resulting in methods which cannot compete with widely-used virtual histology IVUS (VH-IVUS)19, limiting the
imaging detail superiority benefits of OCT when compared to IVUS. The primary drawbacks hampering automated OCT plaque characterization are the lack of large amounts of annotated images and the non-realistic tissue (area of interest) segmentation caused by the difficulty of automatically detecting the outer border. The proposed approach leverages our recently developed lumen8 and outer border detection20 algorithms to introduce an automated method which characterizes
the whole arterial wall. We present a novel and accurate method for detecting and characterizing, for the first time, the whole arterial tissue in a way similar to VH-IVUS.
The innovative aspects of proposed tissue characterization method are:
1. use of CNNs with a large amount of annotated data to detect atherosclerosis; 2. detection of normal tissue and shadowed areas within the OCT images; and
3. detection and classification of the whole arterial wall using OCT images in a similar way as VH-IVUS performs its analysis, enabling the wide use of OCT in atherosclerotic tissue detection.
2. MATERIALS AND METHODS
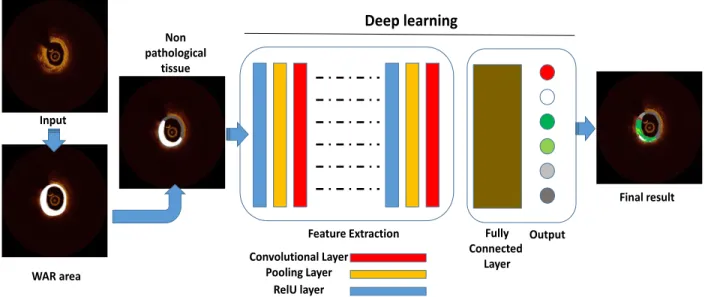
The proposed method (Figure 1) comprises the following three steps:
1. wall area (WAR) detection using previously developed lumen and outer border detection methods; 2. definition of the non-pathologic intima-media area; and
3. automatic characterization of the WAR using a CNN algorithm.
Figure 1: Schematic presentation of the proposed methodology. Convolutional Layer Pooling Layer RelU layer Fully Connected Layer
Feature Extraction Output
Deep learning
Input WAR area Non pathological tissue Final result2.1 Wall area detection
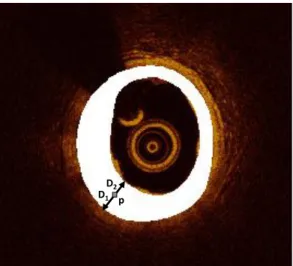
WAR is defined as the area between the lumen and outer border (Figure 2), i.e. the media-adventitia transition. The lumen detection method uses as input 2D cross-sectional OCT images, produces longitudinal cross-sectional images (sagittal cuts) which represent more accurately the sequential area of the OCT pullback, detects the lumen by applying bilateral filtering and a K-means algorithm, and translates the detected lumen to the 2D OCT images8. The outer border detection
method detects the outer vessel border within segments of the OCT pullback that are visible and then, by using a unique 3D surface-fitting method, fills the non-visible parts20.
2.2 Non-pathologic intima-media area detection
Once the lumen and media-adventitia borders are detected, the non-pathological tissue and media layer (M) of the WAR are defined. The concept is based on the VH-IVUS histology method where the normal vessel wall has intimal thickening of <300μm4,19. To measure the distance of the two borders, we calculate for each pixel of the WAR, 𝑝 ∈ 𝑊𝐴𝑅, the
combined distance of the pixel from the lumen and media-adventitia borders:
𝐷𝐿−𝑀𝐴= 𝐷1+ 𝐷2, (1)
and the distance of the pixel from the media-adventitia border: 𝐷1.
Here, 𝐷1 is the Euclidean distance of the pixel 𝑝 from the media-adventitia border and 𝐷2 is the Euclidean distance of the
pixel 𝑝 from the lumen border; if 𝐷1 < 100μm or 𝐷𝐿−𝑀𝐴<300μm the pixel belong to M. A schematic presentation of the
two distances is shown in Figure 2.
Figure 2: Schematic presentation of the two Euclidean distances calculated for defining the non-pathologic intima-media area (M) within the WAR (white).
2.3 CNN-based classification
After detecting the pixels that belong to the non-pathological tissue and media (M) area, the remaining WAR pixels are automatically classified into one of five categories including four plaque types: calcium (C), lipid tissue (LT), fibrous tissue (FT), or mixed tissue (MT), and no visible tissue (catheter artifact; N), using a CNN network.
2.3.1 CNN algorithm
CNNs belong to the family of deep learning networks21, and are commonly used to analyze and classify images. They
consist of an input and an output layer with multiple hidden layers between them. The hidden layers consist of several convolutional layers which automatically extract the complex features of the images.
A CNN is represented by a non-linear function:
𝑝𝑖= 𝑃(𝐼; 𝜃) (2)
which maps an image 𝐼 ∈ℝH×H having 𝐻 × 𝐻 size, to a vector 𝑝
𝑖= (𝑝1, 𝑝2, … 𝑝𝑐)𝑇, where 𝑝𝑖 ∈ [0,1] and denotes the
probability of the image 𝐼 to belong to one of 𝑐 classes: 𝑖 = 1 … 𝑐. 𝜃 = {𝜃1, 𝜃2, … 𝜃𝛫} are the number of 𝐾 parameters used
to map the input image 𝐼 to the vector 𝑝𝑖.
D1 p
D2
Proc. of SPIE Vol. 10950 109500N-3
The training of the CNN can be considered as a non-linear optimization problem:
𝜃̂=arg𝜃min 𝐿{𝐼(1),𝐼(2),…,𝐼(𝑁)}(𝜃). (3)
Here, 𝑁 is the number of images used to train the CNN, and
𝐿{𝐼(1),𝐼(2),…,𝐼(𝑁)}(𝜃) = − 1 𝛮∑ 𝑤𝑗 𝑁 𝑗=1 𝑦𝐶(𝑖)𝑇𝑙𝑜𝑔𝑃(𝐼(𝑖); 𝜃) (4)
is the cross-entropy loss (log loss) measuring the classification performance (having values between 0 and 1) for the 𝐶(𝑖)𝑇
labeled vector of the 𝑐 classes and 𝑤 weights:
𝑤𝑖= 1 𝑀𝑖 ∑ 1 𝑀𝑖 𝑐 𝑖=1 , (5)
for the 𝑀 training data.
To minimize the training time of the CNN, the Stochastic Gradient Descent (SGD) iterative method can be used. SGD approximates the dataset with a batch of random samples, using the stochastic gradient computed from the batch to update the model with each iteration22. SGD might oscillate along the path of steepest descent (gradient descent) towards the
optimum, instead of along the path toward the optimal, since the gradient always points towards the opposite side of this optimum from the current position. A solution to that problem is adding a momentum term to the parameter update to reduce oscillation:
𝜃𝜆+1= 𝜃𝜆− 𝛼𝛻𝐿(𝜃𝜆) + 𝛾(𝜃ℓ− 𝜃𝜆−1), (6)
where 𝜆 is the iteration number, 𝛼 > 0 is the learning rate, and the momentum term 𝛾 determines the contribution of the previous gradient step to the current iteration.
The SGD algorithm uses a subset of the training set called a mini-batch, evaluates the gradient, and then updates the parameters. Each evaluation is an iteration, and at each iteration the loss function is minimized further. The full pass of the training process over the whole training set using mini-batches forms an epoch.
2.3.2 CNN architecture
To classify the pixels of the WAR, we used a sequence of convolutions. To achieve the best classification results, different patch sizes, numbers of input patch convolution sequences, filters, and filter sizes were tested. The best results were acquires when having 45 layers in our network (Figure 3).
Figure 3: Architecture of the CNN used to classify the WAR pixels.
Patch 31x31
p
Convolutional Layer Batch Normalization Layer
RelU layer
Input 8 3x3 convolutions 16 3x3 convolutions 32 3x3 convolutions 128 3x3 convolutions
Max pooling Max pooling 2x2, stride 0 Max pooling 2x2, stride 0 Average pooling Fully Connected Layer Dropout Layer Fully Connected Layer Softmax Layer Classification Layer
Max pooling: 2x2, stride 2, padding 0 Average pooling: 2x2, stride 1, padding 0
3. DATASET
Twenty-eight (28) patients who underwent OCT examinations gave their informed consent for the study, and the study was approved by the Ethics Committee of the institution. Medical experts used the optical frequency domain imaging system FD-OCT C7XR system and the DragonFly catheter (St. Jude Medical, Lightlab Imaging Inc., Westford, MA, USA), which offers a maximum frame rate of 100 frames per second, 500 lines per frame, a scan diameter of 10 mm, and axial resolution of 15 μm, to image 28 coronary vessels. All images were digitally stored in raw format for off-line analysis, and all imaging data sets were anonymized and transferred to our lab for further analysis.
4. RESULTS
3.1 Wall area detection
Two medical experts examined the OCT frames in the twenty two patients and selected 700 images which corresponded to diseased coronary segments. Afterwards, they marked independently the contours of the lumen border, the intima-media border, and regions of calcium (C), lipid tissue (LT), fibrous tissue (FT), mixed (C+ LT) plaque (MP), and the area of the catheter shadow (no visible tissue; N); any disagreements in their annotations were resolved by consensus. The areas detected by the algorithm and annotated by the experts were calculated and compared (Figure 4).
(a)
(b)
Figure 4: (a) Regression analysis plot between the WAR detected by our method and annotated by the experts and, (b) Bland and Altman analysis plot for the WAR detected by our method and annotated by the experts.
3.2 Plaque characterization
The medical experts completely annotated 300 different plaque regions for 22 of the patients, from which 32 K patches were randomly selected for each class and augmented (each patch rotated 90o and 180o), resulting in 480 K patches (96 K
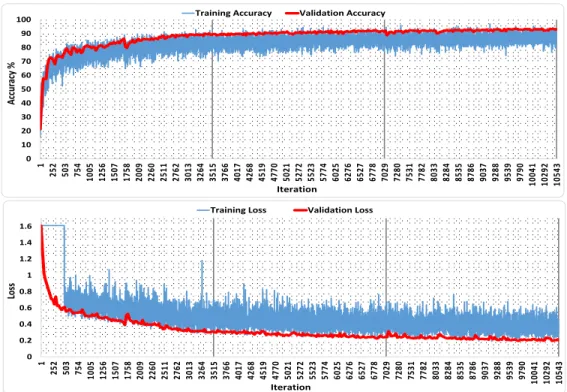
for each of the five classes). The patches were used to train (450 K) and validate (30 K) the CNN parameters. The CNN algorithm reached a validation accuracy of 94.00% (Figure 5).
One expert annotated 50 areas in the remaining 6 patients as C (9450 patches), LT (174448 patches), FT (216336 patches), MT (35301 patches), or N (408243 patches) regions to test the classification accuracy of the proposed method. The CNN network was trained and validated using the MATLAB Deep Learning Toolbox and a NVIDIA Titan Xp GPU (PG611) with 12 GB RAM. The overall accuracy of the proposed algorithm is 96.05% (Table 1); the ability of the method to produce an integrated plaque characterization map using OCT is presented in Figure 6.
Table 1: Confusion matrix of the tested patches.
Confusion Matrix C LT FT MT N Accuracy C 6831 959 163 1497 0 72.3 % LT 8835 162214 1378 1803 218 93.0 % FT 1451 2425 208421 4038 1 96.3 % MT 1738 1782 2072 29709 0 84.2 % N 1259 2629 872 168 403315 98.8 % Accuracy 72.3 % 93.0 % 96.3 % 84.2 % 98.8 % 96.05 %
Proc. of SPIE Vol. 10950 109500N-5
Figure 5: Training results of the CNN algorithm: Classification accuracies (top) and loss (bottom) for the training and testing data using the proposed CNN network over 3 epochs (3515 iterations each).
Figure 6: Application examples of the proposed integrated OCT plaque characterization method: initial images (top) and their corresponding color-coded images (bottom). C: white, LT: red, FT: green, MT: light green, N: light gray and M: dark gray.
0 10 20 30 40 50 60 70 80 90 100 1 252 503 754 1005 1256 1507 1758 2009 2260 2511 2762 3013 3264 3515 3766 4017 4268 4519 4770 5021 5272 5523 5774 6025 6276 6527 6778 7029 7280 7531 7782 8033 8284 8535 8786 9037 9288 9539 9790 10041 10292 10543
Training Accuracy Validation Accuracy
Acc uracy % Iteration 0 0.2 0.4 0.6 0.8 1 1.2 1.4 1.6 1 252 503 754 1005 1256 1507 1758 2009 2260 2511 2762 3013 3264 3515 3766 4017 4268 4519 4770 5021 5272 5523 5774 6025 6276 6527 6778 7029 7280 7531 7782 8033 8284 8535 8786 9037 9288 9539 9790 10041 10292 10543
Training Loss Validation Loss
Los
s
5. DISCUSSION AND CONCLUSIONS
Few methods have been presented during the last decade for detecting and characterizing atherosclerotic plaque using OCT images10,14–16. These methods were primarily based on machine learning algorithms10,13,14 and most recently on deep
learning approaches using convolutional neural networks (CNN)15,16. These methods can sufficiently detect a large
percentage of the atherosclerotic tissue within the arterial wall. However, while CNN-based methods outperformed the machine learning methods, they could not characterize the whole arterial wall as VH-IVUS19 does.
We present an automated method that automatically detects atherosclerosis and classifies the plaque image to 5 different classes: calcium (C), lipid tissue (LT), fibrous tissue (FT), mixed tissue (MT), no visible tissue (guidewire shadow artifact; N), and detects the non-pathological tissue or media (M). The method is based on the combination of WAR detection algorithms and CNN, and was validated using the estimations of expert observers as gold standard in a large clinically-relevant dataset. Our results demonstrate reliable tissue detection and characterization, even in images having artifacts. The method is more accurate and realistic than the methods presented previously in the literature, which makes it notably qualified for use in the clinical and research arenas. Improvements can be made as the method has lower accuracy when detecting calcific tissue (Table 1). This limitation is due to the nature of mixed tissue which includes calcium and lipid and shares image characteristics of both C and LT. Increasing the clinical dataset and incorporating histological findings in the training/testing phase of the proposed method is expected to solve the former limitation, enable its use in the clinical/research arena and enhance the field of computational cardiology23.
6. ACKNOWLEDGMENTS
This work was supported by an NVIDIA GPU Corporation Grant awarded to LA and partly funded by R01 GM 49039 from the U.S. National Institutes of Health to ERE.
REFERENCES
[1] Vignali, L., Solinas, E. and Emanuele, E., “Research and clinical applications of optical coherence tomography in invasive cardiology: a review,” Curr Cardiol Rev 10(4), 2014/06/05, 369–376 (2014).
[2] Athanasiou, L., Bruining, N., Prati, F. and Koutsouris, D., “Optical Coherence Tomography: Basic Principles of Image Acquisition,” [Intravascular Imaging: Current Applications and Research Developments], IGI Global, 180–194 (2011).
[3] Bezerra, H. G., Costa, M. A., Guagliumi, G., Rollins, A. M. and Simon, D. I., “Intracoronary Optical Coherence Tomography: A Comprehensive Review Clinical and Research Applications,” Jacc-Cardiovascular Interv. 2(11), 1035–1046 (2009).
[4] Tearney, G. J., Regar, E., Akasaka, T., Adriaenssens, T., Barlis, P., Bezerra, H. G., Bouma, B., Bruining, N., Cho, J., Chowdhary, S., Costa, M. A., de Silva, R., Dijkstra, J., Di Mario, C., Dudeck, D., Falk, E., Feldman, M. D., Fitzgerald, P., Garcia, H., et al., “Consensus Standards for Acquisition, Measurement, and Reporting of Intravascular Optical Coherence Tomography Studies: A Report From the International Working Group for Intravascular Optical Coherence Tomography Standardization and Validation,” J. Am. Coll. Cardiol. 59(12), 1058–1072 (2012).
[5] Hou, J., Xing, L., Jia, H., Vergallo, R., Soeda, T., Minami, Y., Hu, S., Yang, S., Zhang, S., Lee, H., Yu, B. and Jang, I. K., “Comparison of Intensive Versus Moderate Lipid-Lowering Therapy on Fibrous Cap and Atheroma Volume of Coronary Lipid-Rich Plaque Using Serial Optical Coherence Tomography and Intravascular Ultrasound Imaging,” Am. J. Cardiol. 117(5), 2016/01/19, 800–806 (2016).
[6] Tsantis, S., Kagadis, G. C., Katsanos, K., Karnabatidis, D., Bourantas, G. and Nikiforidis, G. C., “Automatic vessel lumen segmentation and stent strut detection in intravascular optical coherence tomography,” Med Phys 39(1), 2012/01/10, 503–513 (2012).
[7] Ughi, G. J., Adriaenssens, T., Onsea, K., Kayaert, P., Dubois, C., Sinnaeve, P., Coosemans, M., Desmet, W. and D’Hooge, J., “Automatic segmentation of in-vivo intra-coronary optical coherence tomography images to assess stent strut apposition and coverage,” Int J Cardiovasc Imaging 28(2), 2011/02/25, 229–241 (2012).
[8] Athanasiou, L., Rikhtegar Nezami, F., Zanotti Galon, M., Lopes, A. C., Lemos, P. A., de la Torre Hernandez, J. M., Ben-Assa, E. and Edelman, E. R., “Optimized computer-aided segmentation and 3D reconstruction using intracoronary optical coherence tomography,” IEEE J. Biomed. Heal. Informatics (2018).
Proc. of SPIE Vol. 10950 109500N-7
[9] Ahn, C. Y., Kim, B. K., Hong, M. K., Jang, Y., Heo, J., Joo, C. and Seo, J. K., “Automated Measurement of Stent Strut Coverage in Intravascular Optical Coherence Tomography,” J. Korean Phys. Soc. 66(4), 558–570 (2015). [10] Athanasiou, L. S., Bourantas, C. V., Rigas, G., Sakellarios, A. I., Exarchos, T. P., Siogkas, P. K., Ricciardi, A.,
Naka, K. K., Papafaklis, M. I., Michalis, L. K., Prati, F. and Fotiadis, D. I., “Methodology for fully automated segmentation and plaque characterization in intracoronary optical coherence tomography images,” J. Biomed. Opt. 19(2), 026009 (2014).
[11] Olender, M. L., Athanasiou, L. S., de la Torre Hernandez, J. M., Camarero, T. G., Cascon, J. D., Consuegra-Sanchez, L. and Edelman, E. R., “Estimating the internal elastic membrane cross-sectional area of coronary arteries autonomously using optical coherence tomography images,” 2017 IEEE EMBS Int. Conf. Biomed. Heal. Informatics, 109–112, IEEE (2017).
[12] Athanasiou, L. S., Fotiadis, D. I. and Michalis, L. K., [Atherosclerotic Plaque Characterization Methods Based on Coronary Imaging], Elsevier Science (2017).
[13] Xu, C. Y., Schmitt, J. M., Carlier, S. G. and Virmani, R., “Characterization of atherosclerosis plaques by measuring both backscattering and attenuation coefficients in optical coherence tomography,” J. Biomed. Opt. 13(3), 34003 (2008).
[14] van Soest, G., Goderie, T., Regar, E., Koljenovic, S., van Leenders, G. L. J. H., Gonzalo, N., van Noorden, S., Okamura, T., Bouma, B. E., Tearney, G. J., Oosterhuis, J. W., Serruys, P. W. and van der Steen, A. F. W., “Atherosclerotic tissue characterization in vivo by optical coherence tomography attenuation imaging,” J. Biomed. Opt. 15(1), 11105 (2010).
[15] He, S., Zheng, J., Maehara, A., Mintz, G., Tang, D., Anastasio, M. and Li, H., “Convolutional neural network based automatic plaque characterization for intracoronary optical coherence tomography images,” Med. Imaging 2018 Image Process. 10574, E. D. Angelini and B. A. Landman, Eds., 107, SPIE (2018).
[16] Borges Oliveira, D. A., Nicz, P., Campos, C., Lemos, P., Macedo, M. M. G. and Gutierrez, M. A., “Coronary calcification identification in optical coherence tomography using convolutional neural networks,” Med. Imaging 2018 Biomed. Appl. Mol. Struct. Funct. Imaging 10578, B. Gimi and A. Krol, Eds., 69, SPIE (2018).
[17] Kolluru, C., Prabhu, D., Gharaibeh, Y., Bezerra, H., Guagliumi, G. and Wilson, D., “Deep neural networks for A-line-based plaque classification in coronary intravascular optical coherence tomography images,” J. Med. Imaging 5(04), 1 (2018).
[18] Gessert, N., Lutz, M., Heyder, M., Latus, S., Leistner, D. M., Abdelwahed, Y. S. and Schlaefer, A., “Automatic Plaque Detection in IVOCT Pullbacks Using Convolutional Neural Networks,” IEEE Trans. Med. Imaging, 1–1 (2018).
[19] Konig, A. and Klauss, V., “Virtual histology,” Heart 93(8), 2007/05/16, 977–982 (2007).
[20] Olender, M. L., Athanasiou, L. S., Hernandez, J. M. de la T., Ben-Assa, E., Nezami, F. R. and Edelman, E. R., “A Mechanical Approach for Smooth Surface Fitting to Delineate Vessel Walls in Optical Coherence Tomography Images,” IEEE Trans. Med. Imaging, 1–1 (2018).
[21] Goodfellow, I., Bengio, Y. and Courville, A., [Deep learning].
[22] Sutskever, I., Martens, J., Dahl, G. and Hinton, G., “On the importance of initialization and momentum in deep learning,” Proc. 30th Int. Conf. Mach. Learn. 28(3), S. Dasgupta and D. McAllester, Eds., 1139–1147, PMLR, Atlanta, Georgia, USA (2013).
[23] Athanasiou, L., Nezami, F. R. and Edelman, E. R., “Position Paper Computational Cardiology,” IEEE J. Biomed. Heal. Informatics 23(1), 4–11 (2019).