www.the-cryosphere.net/11/723/2017/ doi:10.5194/tc-11-723-2017
© Author(s) 2017. CC Attribution 3.0 License.
Surge dynamics and lake outbursts of Kyagar Glacier, Karakoram
Vanessa Round1,2, Silvan Leinss3, Matthias Huss1,4, Christoph Haemmig5, and Irena Hajnsek31Laboratory of Hydraulics, Hydrology and Glaciology (VAW), ETH Zurich, 8093 Zurich, Switzerland 2Swiss Federal Institute for Forest, Snow and Landscape Research (WSL), 8903 Birmensdorf, Switzerland 3Institute of Environmental Engineering, ETH Zurich, 8093 Zurich, Switzerland
4Department of Geosciences, University of Fribourg, 1700 Fribourg, Switzerland 5GEOTEST AG, 3052 Zollikofen, Switzerland
Correspondence to:Vanessa Round (vround@hotmail.com) and Silvan Leinss (leinss@ifu.baug.ethz.ch) Received: 22 October 2016 – Discussion started: 10 November 2016
Revised: 17 February 2017 – Accepted: 23 February 2017 – Published: 21 March 2017
Abstract. The recent surge cycle of Kyagar Glacier, in the Chinese Karakoram, caused formation of an ice-dammed lake and subsequent glacial lake outburst floods (GLOFs) ex-ceeding 40 million m3in 2015 and 2016. GLOFs from Kya-gar Glacier reached double this size in 2002 and earlier, but the role of glacier surging in GLOF formation was previ-ously unrecognised. We present an integrative analysis of the glacier surge dynamics from 2011 to 2016, assessing surge mechanisms and evaluating the surge cycle impact on GLOFs. Over 80 glacier surface velocity fields were created from TanDEM-X (TerraSAR-X add-on for Digital Eleva-tion Measurement), Sentinel-1A, and Landsat satellite data. Changes in ice thickness distribution were revealed by a time series of TanDEM-X elevation models. The analysis shows that, during a quiescence phase lasting at least 14 years, ice mass built up in a reservoir area at the top of the glacier tongue, and the terminus thinned by up to 100 m, but in the 2 years preceding the surge onset this pattern reversed. The surge initiated with the onset of the 2014 melt season, and in the following 15 months velocity evolved in a manner con-sistent with a hydrologically controlled surge mechanism. Dramatic accelerations coincided with melt seasons, winter deceleration was accompanied by subglacial drainage, and rapid surge termination occurred following the 2015 GLOF. Rapid basal motion during the surge is seemingly controlled by high water pressure, caused by input of surface water into either an inefficient subglacial drainage system or unstable subglacial till. The potential lake volume increased to more than 70 million m3by late 2016, as a result of over 60 m of thickening at the terminus. Lake formation and the evolution
of the ice dam height should be carefully monitored through remote sensing to anticipate large GLOFs in the near future.
1 Introduction
Glacier surges are dynamic instabilities affecting about 1 % of glaciers worldwide (Jiskoot et al., 2000). They consist of periodically alternating long quiescent phases, charac-terised by years to decades of slow flow, and short active surge phases, characterised by months to years of acceler-ation and mass transport down the glacier (Meier and Post, 1969). During the active surge phase, the glacier typically experiences dramatic lengthening or thickening at the termi-nus with potentially hazardous consequences, in particular ice-dammed lake formation (Harrison et al., 2014). While surging glaciers in North America and Svalbard have been investigated in considerable detail, the large concentration of surge-type glaciers existing in the central Asian mountains, including the Karakoram (Copland et al., 2011), are less ex-tensively studied. Improved understanding of surge glacier dynamics in this region can assist anticipation of glacier be-haviour and hazard development in the future. The recent un-precedented collapse of two surging glaciers in Tibet (GAP-HAZ, 2016) highlights the potentially unexpected nature of glacier instabilities in the region.
Kyagar (Keyajir) Glacier, situated on the northern slopes of the Karakoram Mountains, occasionally causes glacial lake outburst floods (GLOFs) with devastating impacts on downstream communities along the Yarkant (Yarkand) River in northwestern China (Zhang, 1992; Hewitt and Liu, 2010;
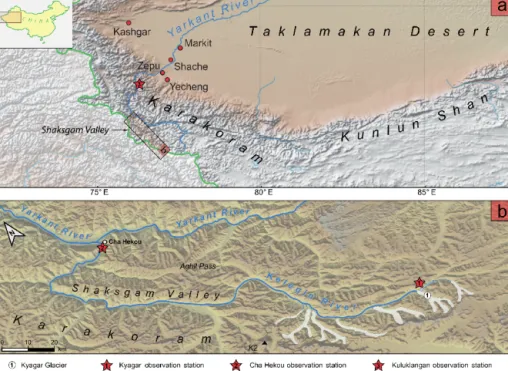
Figure 1. Location of (a) the Shaksgam Valley on the north side of the Karakoram Mountains in western China and (b) Kyagar Glacier in the Upper Shaksgam Valley. Observation stations at Kyagar Glacier, Cha Hekou, and Kuluklangan are indicated. The main flood impacts occur after the Yarkant River leaves the mountains near the Kuluklangan station.
Haemmig et al., 2014). The lake forms when ice at the glacier terminus impounds the river in the Upper Shaks-gam Valley. Owing to the remote location of Kyagar Glacier, about 450 km upstream of the Yarkant floodplain (Fig. 1), the origin of these floods was poorly understood in the past, and they arrived without warning (Zhang, 1992; Hewitt and Liu, 2010). An automated monitoring station was placed at Kyagar Glacier in 2012 to assess lake formation (Haemmig et al., 2014), at which time there was no lake as the river flowed through subglacial channels at the terminus. From mid-2014, camera images from the station showed dramatic vertical thickening of the glacier terminus followed by lake formation. This rapid thickening indicated a possible glacier surge and increased the potential ice-dammed lake volume.
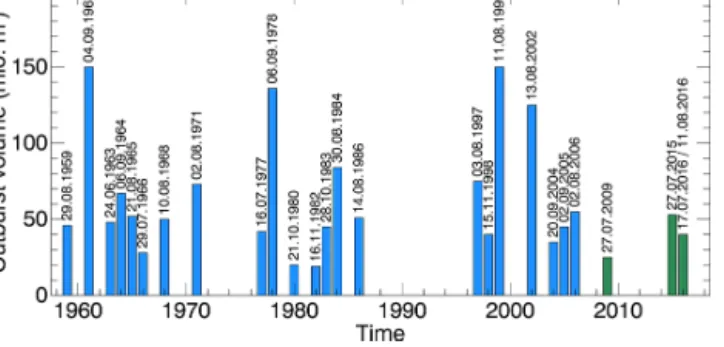
Although it was already recognised in the 1990s that Kya-gar Glacier sometimes dammed the river in the Upper Shaks-gam Valley and that there had been periods of advance or thickening in the late 1920s and 1970s (Zhang, 1992) and 1990s (Hewitt and Liu, 2010), the possibility of Kyagar being a surge-type glacier was not realised until recently (Gardelle et al., 2013; Haemmig et al., 2014), and no surge of the glacier has ever been documented. An investigation of his-toric GLOF occurrences from Kyagar Glacier shows that there have been three main periods of flooding in the last 60 years, with peak volumes larger than 130 million m3 in 1961, 1978, and 1999 (Fig. 2). At least the latter two of these periods coincide with periods of suspected advance or thick-ening. Recurring GLOFs linked to periods of glacier
surg-ing have also been observed for other surgsurg-ing glaciers (e.g. Hoinkes, 1969).
Surging affects both temperate and polythermal glaciers with a variety of geometries and settings (Clarke et al., 1986; Clarke, 1991; Jiskoot et al., 2000) and on vastly different timescales. The general mechanism is as follows: an unstable profile develops during quiescence, as slow velocities fail to redistribute accumulated mass from the upper to the lower part of the glacier, causing steepening of the surface and increasing basal shear stresses, to a point at which surging occurs through dramatically accelerated basal sliding (Ray-mond, 1987). The proposed mechanisms by which the ac-celerated basal sliding occurs are various and not completely understood, particularly because the subglacial environment is so difficult to observe. A switch in basal thermal conditions has been identified as a surge mechanism for some polyther-mal glaciers, with surging occurring when cold basal condi-tions switch to temperate (Clarke et al., 1984; Murray et al., 2000; Fowler et al., 2001). On the other hand, for temperate glaciers and many polythermal glaciers that are already tem-perate at the base (Sevestre et al., 2015), surging has been explained by a hydrological switch mechanism, by which a surge occurs when the subglacial drainage system becomes inefficient, raising subglacial water pressure and facilitating rapid sliding (Kamb et al., 1985; Björnsson, 1998). Rapid de-formation within subglacial till, in response to disturbance of the hydrological system within the till and increased effec-tive water pressure, has also been proposed as an important
Figure 2. Historical GLOF volumes from Kyagar Glacier since the 1960s. Volumes from 1959 to 2006 are redrawn after Zhang (1992) and Chen et al. (2010). Volumes from 2006 to 2016 are estimated from lake extent on satellite images.
possible surge mechanism and is the largest uncertainty in surge understanding (Boulton and Jones, 1979; Truffer et al., 2000; Harrison and Post, 2003). In all cases, a number of positive feedback mechanisms may enhance basal motion during a surge, for instance feedbacks between deformation, frictional heating, and subglacial water pressure (Weertman, 1969; Clarke et al., 1984; Sevestre et al., 2015).
Glacier surging in the Karakoram region has mainly been studied by satellite remote sensing, due to the difficulty of field access. Glaciers have been classified using visible mor-phological features (Barrand and Murray, 2006; Copland et al., 2011), and surge dynamics have been observed through surface velocities (Quincey et al., 2011, 2015; Mayer et al., 2011), producing some contradicting conclusions on surge mechanisms. Quincey et al. (2011) interpreted a lack of sea-sonal control on surge initiation as an indication of ther-mally controlled surges, whereas Mayer et al. (2011) pro-posed a hydrological switch mechanism for North Gasher-brum Glacier. Quincey et al. (2015) concluded that Karako-ram glacier surging must be quite heterogeneous with a spec-trum of surge mechanisms at play, having observed surges exhibiting a surge-front-like down-glacier acceleration as well as surges showing simultaneous glacier-wide acceler-ation. In the nearby West Kunlun Shan, two glacier surges showed a clear seasonal modulation of velocities during the active phase with winter velocities up to 200 % higher (Ya-suda and Furuya, 2015). The main limitations of these studies were data gaps, meaning that various stages of the surge de-velopment, such as surge initiation, were not observed, and changes to ice mass distribution during surging also were not investigated. For such an investigation, digital elevation models (DEMs) from before and after the surge would be required.
In this study the combination of optical and synthetic aper-ture radar (SAR) satellite data reveals the lead-up, the onset, and the termination of the surge, as well as velocity mod-ulations in relation to the seasonal cycle during the surge phase. A DEM time series exposes the ice mass distribution
changes caused by the surge and allows us to examine the mass build-up which ultimately drives the surge. Our anal-ysis of the most up-to-date available satellite tools provides a synthesis of the dynamics of a Karakoram glacier in un-precedented detail, showing the relationships between surg-ing and external factors such as seasonal melt cycles and lake drainage events.
In addition, we assess the impact of surging on the GLOF hazard posed by Kyagar Glacier in the recent past and into the future. GLOF hazard is largely determined by the lake volume and its drainage rate (Björnsson, 2010). The pre-sented time series of glacier DEMs allows for the estima-tion of the potential lake volume and projecestima-tion of potential GLOF volumes in the near future, and high-resolution satel-lite images reveal the drainage mechanism.
2 Study site and data 2.1 Study site
Kyagar Glacier is a polythermal glacier spanning from 4800 to over 7000 m a.s.l., consisting of three upper glacier trib-utaries 6–10 km in length which converge to form an 8 km long glacier tongue, approximately 1.5 km wide (Fig. 3). The total glacier area is 94 km2(Randolph Glacier Inventory Ver-sion 5.0, 2015), and the average surface slope is approxi-mately 2◦ over the tongue and 4.5–20◦ over the branches above the confluence. The surface of the glacier tongue is characterised by ice pinnacles (Fig. 4) up to 40 m high and as narrow as 10 m, indicating cold ice and low shear deforma-tion (Haemmig et al., 2014).
The tongue of Kyagar Glacier is most likely carved into the brown/black shales and cherty limestones of the 3 km thick Permian–Jurassic Shaksgam sedimentary formation, while the mountain range forming the southern margin of the glacier catchment consists of the Aghil formation limestone and perhaps dolomite (Desio et al., 1991). The Shaksgam Valley follows the Shaksgam fault, which passes under the terminus of Kyagar Glacier (Searle and Phillips, 2007).
Fieldwork at Kyagar Glacier is limited because of its re-moteness and political restriction of access. Following a Sino–Swiss expedition in 2012 (Haemmig et al., 2014), in situ observations became available from an automated mon-itoring station about 500 m upstream of the Kyagar Glacier terminus (Fig. 3), which operated from 7 September 2012 until being drowned by the growing lake on 29 June 2015. The northern Karakoram is largely influenced by westerly weather patterns and snow accumulation mainly in winter, while rainfall (at lower altitudes) peaks between May and September (Kapnick et al., 2014). Balanced or slightly posi-tive mass balances for Karakorum glaciers between 1999 and 2011 (Gardelle et al., 2013) contradict global trends of de-creasing glacier mass balance in line with global warming
Figure 3. Optical image of Kyagar Glacier on 29 March 2016 from the ESA Sentinel-2A satellite. The glacier-dammed lake of approx-imately 5 million m3is visible to the east of the glacier terminus. The curved scale bar up the west branch indicates the longitudinal profile used for surface velocity and elevation analysis, and the inset shows the monitoring station located about 500 m upstream of the glacier terminus.
but may be explained by regional increases in winter precip-itation (Kapnick et al., 2014).
2.2 Data
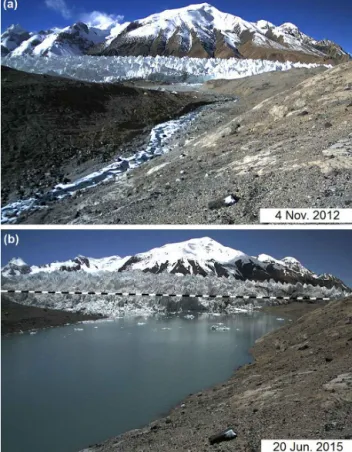
In situ data from the automated observation station included daily camera images of the glacier terminus, showing the up-stream face of the ice dam (Fig. 4). Meteorological variables included air temperature and precipitation amount and type, among others, recorded at hourly intervals until the station became submerged on 29 June 2015. Further meteorologi-cal data and river water level measurements were available from monitoring stations on the Yarkant River located at Cha Hekou and Kuluklangan, 190 and 500 km downstream from Kyagar Glacier, respectively (Fig. 1).
Figure 4. Images from the observation station upstream of Kyagar Glacier’s terminus from (a) before and (b) during the surge. The glacier, flowing from left to right, blocks the flow of the river and causes lake formation. The dashed line in (b) indicates the ice dam height from 2012 (a), highlighting the dramatic thickening at the terminus. Images: GEOPRAEVENT AG.
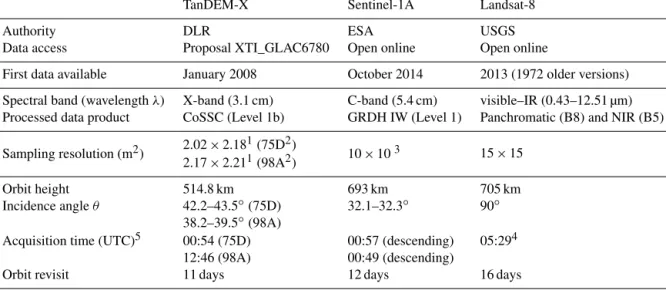
Three different satellite systems were used to determine surface velocities from the end of 2011 to the end of 2016: the SAR systems Sentinel-1A and TanDEM-X (TerraSAR-X add-on for Digital Elevation Measurement), and the Landsat-8 optical system. TanDEM-X is a formation of two tandem satellites, TanDEM-X and TerraSAR-X, data from both of which are used for all velocity and elevation analyses. In ad-dition, Sentinel-2 optical images were used for visual assess-ment of lake formation but not for velocity analysis. Acquisi-tion details of the three main satellite systems are presented in Table 1 (for a complete list of acquisitions see Supple-ment).
3 Methods
3.1 Image co-registration
All satellite scenes were co-registered to a common mas-ter scene to allow accurate comparison of images from the same orbit. The master scene for Sentinel-1A and Landsat-8 images was the first available image from each orbit.
Table 1. Summary of data products acquired by the three listed satellite systems used for this study.
TanDEM-X Sentinel-1A Landsat-8
Authority DLR ESA USGS
Data access Proposal XTI_GLAC6780 Open online Open online
First data available January 2008 October 2014 2013 (1972 older versions) Spectral band (wavelength λ) X-band (3.1 cm) C-band (5.4 cm) visible–IR (0.43–12.51 µm) Processed data product CoSSC (Level 1b) GRDH IW (Level 1) Panchromatic (B8) and NIR (B5)
Sampling resolution (m2) 2.02 × 2.18 1(75D2) 10 × 103 15 × 15 2.17 × 2.211(98A2) Orbit height 514.8 km 693 km 705 km Incidence angle θ 42.2–43.5◦(75D) 32.1–32.3◦ 90◦ 38.2–39.5◦(98A)
Acquisition time (UTC)5 00:54 (75D) 00:57 (descending) 05:294 12:46 (98A) 00:49 (descending)
Orbit revisit 11 days 12 days 16 days
1Single-look complex (SLC) single-look sampling resolution (range × azimuth).275D: orbit 75 descending (flying north to south); 98A: orbit 98 ascending
(flying south to north); both have the view direction to the right.3Ground-range-detected (GRD) multi-looked resolution (range × azimuth).4Orbit: path
148, row 35.5Local daytime at Kyagar Glacier on 21 June 2016: sunrise: 23:36 UTC; sunset: 14:10 UTC.
For TanDEM-X, another co-registration algorithm was used where the master was updated progressively as the average of all previously co-registered scenes in order to temporally smooth out moving features or strongly changing patterns such as snowmelt. The scenes used for image co-registration covered an area of approximately 30 × 50 km2 extending north from Kyagar Glacier, over which local offsets were calculated for patches of 512 × 512 pixel2. To remove off-sets resulting from patches covering moving glaciers, a pla-nar function was fitted to the offset fields and large outliers were removed, before again fitting a planar function to the fil-tered offset fields. The scenes were then resampled according to the final fitted function, resulting in a stack of images with sub-pixel co-registration accuracy.
3.2 Glacier surface velocity
Glacier surface velocities were determined using offset track-ing, through which the ground offset between corresponding patches of co-registered repeat-pass satellite image pairs is computed (Strozzi et al., 2002; Luckman et al., 2007). In-tensity cross-correlation was applied to paired patches from the SAR images, while for Landsat optical data phase cross-correlation was used to better deal with variable illumination conditions (Zitova and Flusser, 2003). The resulting offset field covering the glacier and its surroundings was then con-verted to surface velocity by dividing by the elapsed time between the paired images and scaling by ground range reso-lution. Longitudinal velocity profiles were determined along a manually determined central glacier flow line (as shown in Fig. 3) in the velocity offset patch coordinates.
Table 2. Patch size and patch spacing used for velocity determina-tion.
Patch size Patch spacing (pixels) (m2) (pixels2) (m) TanDEM-X 256 × 256 512 × 512 32 70 Sentinel-1A 64 × 64 640 × 640 18 180 Landsat 32 × 32 480 × 480 12 180
The patch size and spacing are presented in Table 2. Patch sizes were selected to optimise the superior correlation abil-ity of larger patches with the superior spatial resolution of smaller patches. Larger patches were required for the SAR systems, despite their finer resolution, to compensate for radar speckle. Velocity fields were filtered to remove offsets calculated with low correlation quality, as determined by the height of the correlation-function peak over the noise. Offsets with high divergence from neighbouring values and outliers with velocities 50 % larger than the maximum offset over the glacier were also removed.
The accuracy of the offset tracking procedure was assessed by calculating the patch offsets over a 1 × 2 km2 area of stable ground next to the glacier terminus. Since no offsets are expected over stable ground, offsets represent local in-accuracies in the co-registration of images caused by slight changes in imaging geometry and, hence, scene projection, as well as the inherent inaccuracy in the sub-pixel deter-mination of the correlation-function peak. The root-mean-square error for the offsets over stable ground was 0.08 pix-els or less for almost all the used image pairs from the three
satellite systems, similar to the 0.05-pixel error estimated by Strozzi et al. (2002). The velocity difference from assuming a horizontal surface for velocity calculations was only about 0.06 % over the 2◦sloping glacier tongue and 0.4 % over the 5◦slope just above the confluence. Due to the side-looking radar imaging geometry, steep slopes in the range direction result in a different pixel spacing and hence biased velocities. However as the glacier is not very steep and flows predomi-nately in the azimuth direction, this is not a problem. 3.3 Digital elevation models
Digital elevation models were derived using data from the TanDEM-X satellite formation (Krieger et al., 2007, 2013) using single-pass SAR interferometry. SAR interferometry allows accurate DEM generation if the absolute interferomet-ric phase can be successfully determined from the wrapped interferometric phase measured between 0 and 2π . Determi-nation of the absolute phase requires phase unwrapping al-gorithms to be applied to the interferogram (e.g. Goldstein et al., 1988; Zebker and Yanping, 1998). The phase unwrap-ping can be simplified by first subtracting a synthetic inter-ferogram, based on a reference DEM, and adding it back af-ter unwrapping is completed (e.g. Dehecq et al., 2015). This can help minimise phase-wrapping errors which can easily be recognised in the interferograms when an accurate reference DEM is used. If the phase difference to the measured data does not exceed 2π , phase unwrapping can even be avoided entirely.
The phase gradient and hence the DEM accuracy depend on the perpendicular interferometric baseline B⊥, the
com-ponent of the distance between the two SAR satellites which is perpendicular to both the line of sight and the flight direc-tion. Large baselines provide a better height accuracy, with phase cycles of 2π corresponding to smaller height of ambi-guity (HoA; see p. 3320 and Eq. 37 in Krieger et al., 2007), but on the other hand large baselines are more prone to phase unwrapping errors and signal decorrelation due to scattering volumes (Zebker and Villasenor, 1992) and noise contained in the reference DEM.
The reference DEM used for this study was composed from the 30 m resolution Shuttle Radar Topography Mission (SRTM) DEM (global version 3.0, 2015) and the average of eight TanDEM-X DEMs from orbit 75D between 12 Octo-ber and 28 DecemOcto-ber 2015. Phase-unwrapping errors could be avoided due to the very short baselines of 19–29 m giv-ing large HoAs of 250–400 m. For noise reduction, an adap-tive filter was applied to the interferograms (Goldstein and Werner, 1998). After phase unwrapping and conversion to height, the height corrections were averaged and added to the SRTM DEM to form the reference DEM which was down-sampled to a resolution of 8 × 8 m2. DEMs for each acqui-sition from orbit 75D were created by converting the phase difference against the reference DEM into a height change 1h, which was then added to the reference to obtain an
ab-solute DEM for each acquisition date. The extremely rough glacier surface topography, with ice pinnacles up to 40 m high and 20–40 m apart (estimated from shadow lengths and the observations from Haemmig et al., 2014), caused strong decorrelation and phase wraps within the coherence win-dow of 15 × 15 m2for large baselines, meaning that DEMs could not be created over the glacier tongue with baselines B⊥>200 m (HoAs below 20 m).
The generated DEMs contain errors from processing un-certainties as well as from microwave penetration into snow. Processing uncertainties include phase noise due to low cor-relation in the interferograms, global offsets due to geomet-ric errors, and errors of the SRTM DEM. Errors due to phase noise were estimated from the differences between the eight DEMs used for the reference DEM. The standard deviation was below 4 m. The SRTM DEM is specified with an abso-lute vertical accuracy of about 10 m (Farr et al., 2007), but for comparison of DEMs systematic vertical shifts or tilts were corrected for by referencing DEMs to a common reference height of flat terrain near the tongue of Kyagar Glacier. The remaining relative error between different DEMs was esti-mated from four flat valley planes and resulted in a maximum height error of ±1 m (standard deviation 0.65 m).
The error due to microwave penetration into dry snow can reach up to 6 m (Dehecq et al., 2015) for a microwave fre-quency of 9.65 GHz (TanDEM-X), but penetration is negligi-ble over wet snow (more than 1 % volumetric water content; Leinss et al., 2015, Fig. 5). Microwave penetration leads to potential underestimation of the actual surface height over dry snow and ice surfaces. For Kyagar Glacier, penetration depths of up to 2 m have been estimated by distinguishing between dry and wet snow conditions based on backscat-ter intensity (Nagler and Rott, 1998; Small, 2012; Nagler et al., 2016), and determining the apparent height difference between DEMs from wet versus dry conditions. Over the tongue of Kyagar Glacier, the backscatter intensity changed little between seasons (< 5 dB), because infrequent snow-fall means that the bare ice surface roughness dominates the backscatter signal from the tongue. Penetration is therefore expected to be negligible over the glacier tongue. In con-trast, large seasonal changes in backscatter intensity indicate changing water content and thus varying penetration depths over the accumulation basin. Backscatter decreased by more than 10 dB at the onset of snowmelt in 2015 over the accumu-lation areas, and an apparent surface height increase of less than 2 m was calculated between two large baseline interfer-ograms from before snowmelt (2 June 2015) and at the on-set of snowmelt (13 June 2015). This indicates a TanDEM-X penetration depth of 2 m or less in dry-snow conditions over the upper glacier. The relatively small penetration depths in the accumulation area might be a result of strongly scatter-ing high-density firn with ice inclusions, formed by refreez-ing after strong melt events extendrefreez-ing to over 6000 m a.s.l. in August (Fig. S1 in the Supplement), a phenomenon also
observed by Dehecq et al. (2015). The backscatter intensity changes are shown in Figs. S1 and S2.
The penetration error in the SRTM DEM should be slightly larger than for the TanDEM-X DEMs, as the SRTM DEM was acquired with a C-band radar with 5.3 GHz (Farr et al., 2007) during winter (February 2000). For C-band radars, expected penetration depths are 1–2 m into exposed ice (Rignot et al., 2001) and 5–10 m into dry snow (Rignot et al., 2001; Fischer et al., 2016). However, because in the accumulation area the penetration for X-band is < 2 m, we estimate a penetration of < 4 m in C-band (cf. Fig. 9 in Fis-cher et al., 2016) and 1–2 m over the glacier tongue.
In summary, systematic shifts are removed when compar-ing DEMs, but differences in penetration must be considered in particular when comparing the SRTM to the TanDEM-X DEMs or when comparing DEMs from different seasons. Over the glacier tongue, penetration errors are < 2 m, and over the accumulation area they are estimated to be < 4 m. 3.4 Calculation of positive degree days
Positive degree days (PDDs) at the glacier terminus were cal-culated as a proxy for potential melting. Positive air tem-perature measurements were summed with each measure-ment weighted by the fraction of a day which it represented (Vaughan, 2006), such that one hourly measurement of 6◦ would contribute 0.25 PDD. The hourly air temperature data from the station at Kyagar Glacier were used for comput-ing PDDs in 2013 and 2014. Data from the downstream Cha Hekou observation station were used to estimate PDDs at Kyagar Glacier in 2015 and 2016, to replace data from the Kyagar observation station which had been submerged. PDDs from the downstream station were scaled by using av-erage monthly PDD offsets to the Kyagar Glacier station data from 2013 and 2014.
3.5 Lake volume estimation
Lake volumes were calculated using the DEM of the empty lake basin from TanDEM-X data acquired on 18 Au-gust 2016, together with the lake extent and thus lake sur-face altitude from optical (Landsat or Sentinel-2) or SAR backscatter images (Sentinel-1A and TanDEM-X). In addi-tion, the initial lake formation during the winter of 2014/2015 was observed by the in situ camera, as the small initial vol-umes were not seen on the satellite images but were im-portant for assessing possible subglacial drainage. Potential lake volumes were estimated by calculating the lake volume which would result if the lake basin were filled to 90 % of the ice dam height, as determined from the DEM of the glacier terminus.
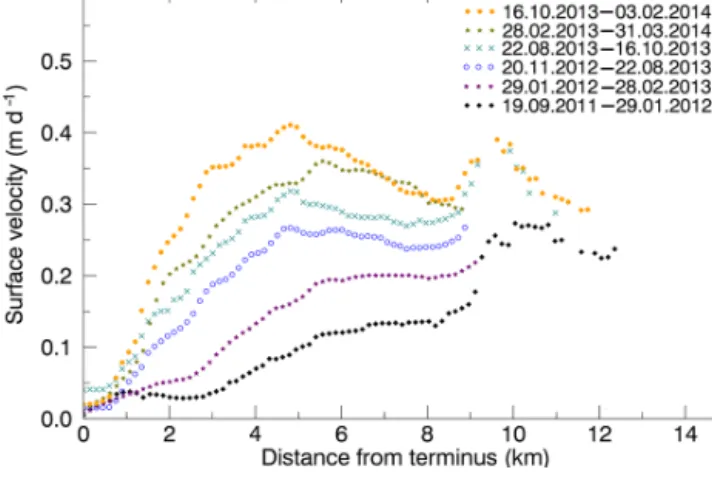
Figure 5. Longitudinal surface velocity profiles showing (from bot-tom to top) the pre-surge acceleration that occurred in the 2.5 years before the main surge onset. The profiles, derived from TanDEM-X data, follow the longitudinal path from Fig. 3. Gaps above 9 km in-dicate failed velocity calculation owing to the poor surface contrast providing no clear correlation. The labels state the time period over which each velocity calculation was averaged, in this case ranging from 2 to 13 months.
4 Results
4.1 Glacier surface velocities
More than 80 surface velocity fields over Kyagar Glacier from September 2011 to December 2016 capture 2.5 years building up to the surge, the initiation of the surge in May 2014, and several periods of acceleration and decelera-tion in the 2 years following the main surge phase. Pre-surge velocity is represented in Fig. 5, while Figs. 6 and 7 are maps of surface velocity during the surge onset and main develop-ment, and Fig. 8 depicts the temporal and spatial velocity profiles over the entire study period in a 2-D colour diagram. A complete set of surface velocity maps from all three satel-lite systems are provided in the Supplement.
In the 2.5 years before surge onset, a gradual but clear ac-celeration occurred, greatest over the middle of the glacier tongue (between 3 and 6 km) with an increase in velocity from 0.1 m d−1in winter 2011/2012 to over 0.4 m d−1in win-ter 2013/2014 (Fig. 5). The location of the maximum veloc-ity moved from above the confluence at 10 km at the end of 2011 to over the glacier tongue at 5 km in 2013/2014. Apart from this early shift, the spatial pattern of acceleration over the glacier tongue was quite uniform with no evidence of a surge front moving down the glacier, as observed for some other Karakoram glaciers (Mayer et al., 2011; Quincey et al., 2015). The presence of seasonal modulation could not be as-sessed due to the coarse temporal resolution of the six pre-surge acquisitions, but it can be seen that acceleration con-tinued over the winter immediately before surge initiation (Fig. 5, fastest velocity profile, from October 2013 to Febru-ary 2014). This gradual pre-surge acceleration may indeed
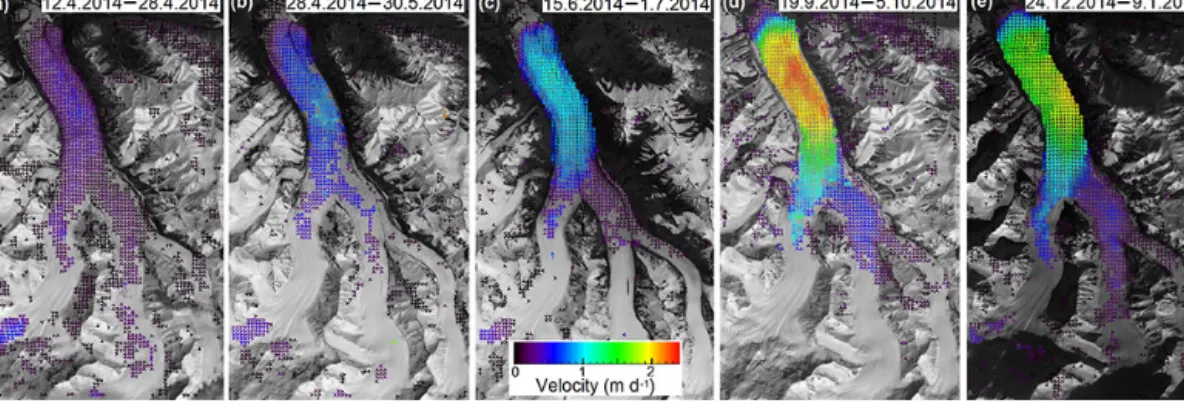
Figure 6. Velocity fields showing the onset and peak of the surge. Panels (a)–(c) show the initial acceleration between April and July 2014; (d) shows the maximum of the surge in September/October followed by deceleration to lower velocities in winter 2014/2015 (e). Background image from USGS Landsat 8 satellite data.
Figure 7. Velocity fields showing (a) the maximum velocity reached in 2015, followed by (b)–(d) the sudden deceleration from the end of July into August. These velocity fields were calculated from consecutive 11-day periods. Background image from TanDEM-X data provided by the German Space Agency (DLR).
have already been under way prior to 2011, with accelera-tion between annual velocities from 2004/2005 to 2010/2011 based on Landsat velocity analysis by Heid and Kääb (2012). The pre-surge acceleration appears insignificant in com-parison to the main surge phase, which started at the end of April 2014. Rapid acceleration first became evident between 28 April and 30 May 2014 (Fig. 6a–b), with a doubling of maximum velocity from 0.5 to over 1 m d−1within 32 days. Velocities continued increasing steadily (Fig. 6c) to a peak of almost 2.5 m d−1(Fig. 6d) between 19 September and 5 Oc-tober 2014. The maximum instantaneous velocity is likely to have been higher than the calculated values, which are aver-ages over 16-day periods. The surge caused a 6-fold acceler-ation in the 5 months following May 2014 and more than a 20-fold acceleration beginning 2011/2012.
After the surge peak in September 2014, there was a slight deceleration, which continued during winter (Fig. 6e) un-til maximum velocities had dropped to about 1.2 m d−1 in April 2015. This was followed by a new phase of accel-eration through May–July 2015 to almost 2 m d−1 in late July, slightly slower than the peak velocity in summer 2014.
This acceleration came to an abrupt halt between 27 July and 7 August 2015, causing the most rapid change observed with a halving of velocities over the tongue within 22 days (Fig. 7a–c). This abrupt slow-down was aligned with the lake drainage on 27 July, as indicated by the arrow in Fig. 8.
Deceleration continued over autumn 2015 and winter of 2015/2016, and velocities almost returned to pre-surge levels with a maximum less than 0.5 m d−1in March 2016. There was a slight acceleration after April 2016, but velocities were still significantly below the previous two summers, remain-ing below 1 m d−1and decreasing to below 0.5 m d−1by De-cember 2016.
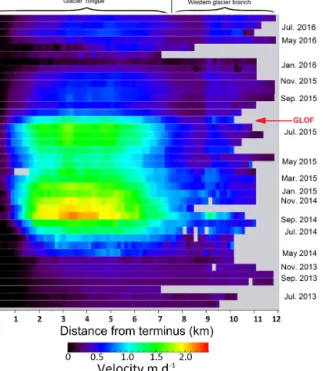
Figure 8, consisting of a stacked time series of velocity profiles along the glacier, shows that the surge mainly af-fected the tongue of the glacier, between 1 and 8 km, while above the confluence (> 8 km) the effect of the surge was small.
4.2 Glacier surface elevation
Four DEMs based on TanDEM-X data acquired before the surge (2012–2014) and eight DEMs from after the main part
Figure 8. Evolution of surface velocity along the longitudinal pro-file (see Fig. 3) showing the spatial extent of the surge and how it evolved in time. The surge predominately affected the glacier be-low the confluence at 8 km. The red arrow indicates the GLOF on 27 July 2015 and the corresponding abrupt deceleration.
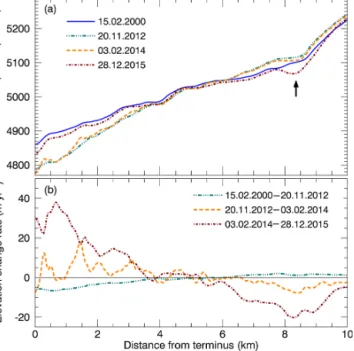
of the surge (October–December 2015) were compared with each other and with the SRTM DEM from 2000, to reveal the dramatic changes in glacier surface elevation and, hence, ice mass distribution over Kyagar Glacier caused by the surge. Maps of elevation change over the glacier during the quies-cence and surge periods are shown in Figs. 9 and 10, respec-tively. Longitudinal profiles of surface elevation are shown in Fig. 11a, and the elevation change rates in Fig. 11b.
Before the surge, between February 2000 and Novem-ber 2012, the surface elevation decreased gradually over most of the glacier tongue at a rate of 5 m a−1(Figs. 9 and 11b), resulting in an elevation loss of over 60 m at the glacier termi-nus. At the same time, elevation increased over the western branch by up to 30 m just above the confluence, while over the eastern branches the surface elevation increased more moderately with a maximum gain of 10 m (Fig. 9). This ob-served pattern is typical of a surging glacier in the quies-cence phase, with downwasting over the glacier tongue and ice build-up in a reservoir area, which for Kyagar Glacier forms just above the confluence on the western branch.
Between 2012 and 2014, in the 2 years preceding the surge, there was already a slight reversal of the quiescence pattern seen in the previous 12 years, with minor elevation loss just above the confluence and mass gain over the tongue (Fig. 11), indicating mass transport down the glacier from the reservoir. During the surge in 2014/2015, this mass transport
Figure 9. Glacier surface elevation changes between February 2000 (SRTM) and November 2012 (TanDEM-X). The elevation change represents 12 years of quiescence preceding the surge. The image is shown in radar coordinates for TanDEM-X data of orbit 75D, accounting for the slightly different orientation to the optical image in Fig. 3.
Figure 10. Glacier surface elevation changes during the surge from subtraction of two TanDEM-X DEMs from February 2014 and Oc-tober 2015. This surface elevation change reverses the change pat-tern shown in Fig. 9 through only 1.5 years of surging.
from the reservoir area intensified dramatically, with ice sur-face elevation increasing at a rate of almost 40 m a−1over the lowest parts of the glacier tongue, causing thickening in ex-cess of 60 m at the terminus beginning in February 2014. At the same time, surface elevation decreased by more than 40 m
Figure 11. (a) Elevation profiles from 2000, 2012, 2014, and 2015, and (b) the rate of elevation change between the periods 2000–2012, 2012–2014, and 2014–2015. Profiles are taken along the transect in-dicated in Figs. 9 and 10, and the black arrow indicates the location of the surface hollow remaining after the surge.
just above the confluence where the reservoir area formed during the quiescence. The mass transport, typical during a surge phase, essentially reversed the changes which occurred during the quiescence (2000–2012), such that the glacier sur-face profile at the end of 2015 had almost returned to that of 2000 (brown vs. blue lines in Fig. 11a).
There were significant adjustments to surface slope throughout the course of the surge, particularly over the glacier tongue. In 2000, the average slope over the first 8 km of the glacier was about 1.4◦, and by 2012/2014 it had in-creased to about 2.3◦. By the end of 2015, after the surge, slope had decreased again to about 1.6◦.
The post-surge glacier surface in October 2015 showed the presence of a surface hollow, approximately 12 m deep and up to 1 km wide, at the very beginning of the western branch above the confluence just before the slope significantly steep-ens (Fig. 11a, indicated by arrow). Such a depression is an unusual feature but could have formed as a consequence of the surge transporting ice from the reservoir area faster than the rate of replacement from above, owing to the observed flow disparity between the tongue and the glacier branches. 4.2.1 Mass balance and equilibrium line altitude Although not directly related to the surge characterisation, we provide a geodetic mass balance estimate for Kyagar Glacier between 2000 and 2015. The average volume differ-ence between the SRTM DEM and eight TanDEM-X DEMs
from between October and December 2015 was calculated and converted to mass change assuming an ice density of 850 ± 60 kg m−3(Huss, 2013). The mass balance was found to be −0.24 ± 0.22 m w.e. a−1. For the uncertainty, the radar penetration difference between the SRTM and the TanDEM-X DEMs dominates and was estimated to be a conserva-tive 3 m systematic error over the whole glacier. As the pen-etration for the SRTM C-band microwaves is deeper than the TanDEM-X X-band, our calculation may slightly un-derestimate mass loss. On the other hand, the area used for calculation (61 km2) missed some of the steepest por-tions of the accumulation area due to lack of interferomet-ric coherence affecting DEM creation, possibly leading to an under-representation of the accumulation area and exagger-ated mass loss. For comparison, Gardelle et al. (2013) re-ported an average mass balance of +0.11 ± 0.14 m w.e. a−1 for glaciers in the east Karakoram region between 2000 and 2008.
The equilibrium line altitude (ELA) estimated from the lo-cation of the snow line at the end of the ablation period ob-served from Landsat and TanDEM-X images was 5350 ± 80, 5400 ± 80, and 5510 ± 80 m a.s.l. over the western, middle, and eastern branches, respectively.
4.3 Meteorological observations
Temperatures remained below 0◦C between mid-October and late April according to data from the meteorological sta-tion at the glacier terminus (at 4800 m a.s.l.). The warmest months, July and August, experienced average daily maxi-mum temperatures of 4–7◦C and monthly PDDs exceeding 150 at the glacier terminus. By taking into account the glacier surface elevation and a lapse rate of about −0.006◦C m−1, it
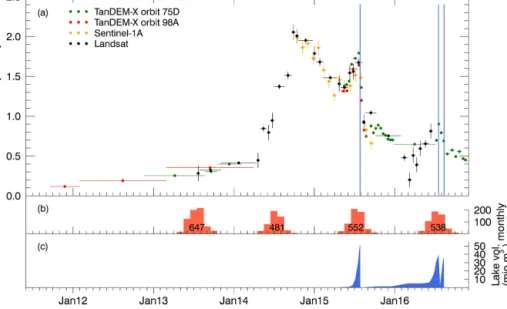
can be inferred that, over the whole glacier tongue, PDDs are positive between May and October, whilst over the bulk of the accumulation area (about 900 m above the terminus) melt potential was only significant from June to August. Evidence of high-altitude melt is also seen in the TanDEM-X backscat-ter images from August 2015 (Fig. S1). Annual PDDs at the glacier terminus were 647, 481, 552, and 528◦C in 2013, 2014, 2015, and 2016, respectively. The melt rate at the ter-minus is estimated to be around 5 m a−1, according to the ter-minus surface elevation decrease during quiescence (Fig. 11) and the melt rate of icebergs left in the empty lake basin after lake drainage in 2009 (Haemmig et al., 2014). Combining this melt rate and the annual average of 552 PDDs gives a realistic degree day factor of about 9 mm w.e.◦C−1d−1.
4.4 Lake formation and drainage
Images from the monitoring station at Kyagar Glacier showed that a lake initially began forming in the river basin upstream of the glacier terminus in early December 2014. During January and February 2015 the lake appeared to fill faster, before remaining at a constant size (still less than
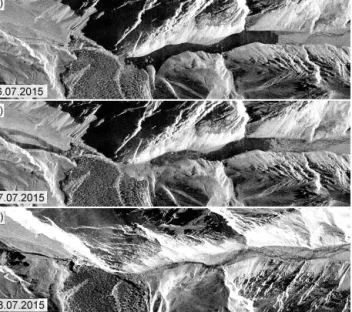
Figure 12. Radar backscatter images of the glacier terminus show-ing the lake (a) 11 days before drainage, (b) just after the start of drainage, and (c) after the lake drainage. Lake drainage clearly oc-curred through subglacial channels, rather than through dam col-lapse or overtopping. Images from TanDEM-X data provided by DLR.
1 million m3) during March. In April 2015 the lake size in-creased again in line with the onset of spring melting, contin-uing more rapidly during the summer until reaching an esti-mated volume of 53 million m3before draining through sub-glacial channels on 27 July 2015, as observed by TanDEM-X acquisitions (Fig. 12).
Following the drainage in July, a new lake started forming in September 2015 and remained at a volume of approxi-mately 1.5 million m3between October and December 2015. As during the previous winter, the lake size increased be-tween January and February 2016, from approximately 1.5 to 5.0 million m3, and again this winter lake filling seemed to stop during March and recommence with the onset of the melting season. The lake rapidly filled during summer 2016 and reached an estimated volume of 40 million m3by 13 July before a rapid drainage event occurred on 17 July 2016. Al-most immediately after this event, the lake filled again and reached an estimated volume of 37 million m3before a sec-ond drainage event on 11 August. Lake volumes, as calcu-lated from satellite images and the lake basin DEM, are pro-vided in the Supplement.
In addition to the large ice-dammed lake at the glacier ter-minus, a lake approximately 200 m long, situated about 9 km from the terminus on the eastern edge of the glacier, was clearly visible on several consecutive TanDEM-X backscat-ter images (Fig. S4). This lake became visible about 1 month before the GLOF in 2015 and was still present during the drainage on 27 July but had disappeared by 28 July after the GLOF. In 2016 the lake appeared again, a bit over a month
before the GLOF in July 2016, and disappeared after the GLOF.
5 Discussion
Based on the results, we discuss possible surge mechanisms for the observed behaviour of the glacier before and during the main surge phase, and we rule out mechanisms which contradict the observed behaviour. The effect of the surge cycle on the GLOF hazard posed by Kyagar Glacier in the past and future is assessed to provide an outlook for its hazard potential.
5.1 Surge mechanisms for Kyagar Glacier 5.1.1 Pre-surge build-up
The observed pre-surge acceleration could have arisen through increased internal ice deformation and/or increased basal sliding, both of which may be expected following the steepening of the glacier tongue between 2000 and 2012 (Fig. 11a). The contribution of internal ice deformation ud
to surface flow can be estimated with the parallel-sided slab assumption with the plain strain approximation (Greve and Blatter, 2009), as
ud=
2A
n +1(ρgsin α)
nHn+1, (1)
where the strain rate factor A = 2.4 × 10⁻²⁴s−1Pa−3 (for temperate ice, a conservative estimate), ice density ρ = 900 kg m−3, Glen’s exponent n = 3, and gravitational ac-celeration g = 9.8 m s−2, leaving the key variables surface slope, α, and ice thickness H (Cuffey and Paterson, 2010). Assuming a constant glacier thickness of 250 m, an estima-tion on the high side according to the glacier bed profile pre-sented by Haemmig et al. (2014), the 1.4◦surface slope over the glacier tongue in 2000 would result in a surface velocity of 4 mm d−1. The increased slope of 2.3◦in 2012 would give deformation velocities of around 18 mm d−1, approximately 1 order of magnitude lower than the observed 0.1 m d−1 be-tween 2011 and 2012 (Fig. 5). Hence, it seems that basal mo-tion significantly contributed to flow of the glacier tongue al-ready prior to the surge, indicating that the base of the glacier tongue was already temperate and contradicting the thermal mechanism in which a switch from cold to temperate base causes surge onset. Conditions are different above the con-fluence where the surface slope of around 4.5◦in 2012 could cause surface velocities on the order of 0.1 m d−1 through internal deformation alone, in the same order of magnitude as observed velocities. Pre-surge velocities above the con-fluence could therefore feasibly occur in a cold-based situa-tion through internal deformasitua-tion without the contribusitua-tion of basal motion. However, basal motion upstream of the conflu-ence is not ruled out with this simple calculation.
Figure 13. (a) Evolution of surface velocity at the middle of the glacier tongue (4 km from the terminus, Fig. 3) from the end of 2011 until mid-2016, with horizontal bars representing the period over which velocity was calculated and vertical bars showing the velocity uncertainty. The blue vertical lines indicate GLOF events. (b) Monthly PDDs indicated by the bars, and yearly PDDs indicated by the numbers. (c) Temporal change in lake volume as calculated from lake extent on satellite images.
The effect of increased surface slope on basal shear stress, τb, during the quiescence can be estimated from
τb=ρgHsin α (2)
if the glacier base is assumed to mirror the surface slope (Cuffey and Paterson, 2010). If all variables except the slope are considered constant, then the increase from 1.4 to 2.3◦ between 2000 and 2012 over the glacier tongue will have caused a 64 % basal shear stress increase, from about 54 to 88 kPa. The thickness increase over the reservoir area would further increase τb at the upper part of the glacier tongue.
Given the potential sensitivity of the subglacial hydrological drainage system efficiency to basal stress (Eisen et al., 2005), the conditions at the end of the quiescence could favour a switch to an inefficient drainage system.
However, the slope began decreasing between 2012 and 2014 (Fig. 11) while velocity continued to increase. This contradicts the idea that increasing slope alone could have driven the acceleration. Positive feedback mechanisms trig-gered by increasing basal stress must therefore play a role in the continued acceleration during the late quiescence, and ultimately in bringing the glacier into a critical state be-fore surge initiation. These could include increased frictional heating enhancing meltwater production and water pressure at the glacier base (Dunse et al., 2015; Weertman, 1969), or increased basal deformation closing subglacial drainage channels, thus trapping water and increasing water pressure (Clarke et al., 1984; Kamb et al., 1985). Processes within the subglacial till such as a positive feedback between till deformation, consolidation, and water pressure (Boulton and Zatsepin, 2006) could also play a role.
The continuation of acceleration during winter 2013/2014 (Fig. 13), rather than another slow-down as observed by Haemmig et al. (2014) during the previous winter, may in-dicate the presence of an inefficient subglacial drainage sys-tem. Such winter acceleration was observed prior to the 1982/1983 surge of Variegated Glacier and was attributed to the establishment of an inefficient linked-cavity drainage sys-tem with higher water pressure, in part due to low water flux allowing drainage channels to close (Kamb et al., 1985). 5.1.2 Main surge phase, 2014 to 2016
The rapid spring acceleration observed in May 2014 can be explained by the input of surface meltwater increasing water pressure in an inefficient subglacial drainage system, which was suspected to be present during the preceding winter. Continued acceleration through the summer could reflect in-creasing subglacial water pressure as meltwater input con-tinued. The deceleration after reaching maximum velocities in October 2014 indicates decreasing subglacial water pres-sure, perhaps through the gradual evolution of a subglacial drainage system towards the end of summer followed by de-clining meltwater input and possible subglacial drainage. Ev-idence for the drainage of en- or sub-glacially stored water during wintertime comes from the observed lake formation starting in December 2014, at a time when temperatures con-sistently well below 0◦ exclude surface water sources. The lake growth and, hence, the drainage of subglacial water ap-peared to end in January 2015. This indicates that most sub-glacial water was already drained or that subsub-glacial drainage channels closed towards the end of the winter. Closing of the
subglacial channels would again put the subglacial system into a state very sensitive to surface water input and allow summer-onset acceleration again in 2015.
The seemingly extremely rapid response of surface veloc-ity to the onset of surface melting indicates an efficient trans-fer of surface water to the glacier base, which was in a critical state before the melt season started. The heavily crevassed surface, as observed during past expeditions (Mason, 1928; Haemmig et al., 2014) and seen on satellite images, may sig-nificantly contribute to the efficiency of vertical drainage. We note, however, that on some images supraglacial lakes are present on the glacier surface (Figs. S3 and S4). These supraglacial lakes might indicate that surface water is not al-ways connected with the subglacial drainage system despite extensive crevassing, or on the other hand they might be an expression of high englacial water pressures during the surge. The presence of a small lake at the side of the glacier near the confluence (Fig. S4), as well as its disappearance after the GLOFs in 2015 and 2016, indicates that this surface lake is a reflection of the englacial water pressure being high dur-ing the surge and low after the GLOF when the subglacial drainage system evolves to a more efficient state.
The abrupt deceleration at the end of July 2015, occurring simultaneously with the lake outburst, is an extreme exam-ple of deceleration occurring in association with subglacial drainage. It seems that the opening of subglacial channels beneath the terminus during the lake outburst triggered the reduction of subglacial water pressure and, hence, velocity beneath the whole glacier tongue within 11 days (Fig. 7). The disappearance of the supraglacial lake near the conflu-ence also reflects the establishment of a more efficient sub-glacial drainage system along the entire length of the glacier tongue. This rapid evolution of the drainage system arises from a change in boundary conditions, namely the sudden decrease in water pressure as the lake at the terminus drained. 5.1.3 Summary of surge mechanism
The various phases of the surge were facilitated by a basal motion mechanism very sensitive to subglacial water pres-sure, controlled by meltwater input in summer, reduced input and perhaps drainage of most of the subglacial water in early winter, and rapid subglacial drainage during the GLOF in summer 2015. It seems that the surge is well explained by the presence of an inefficient basal drainage system facilitating high subglacial water pressure, corresponding to the mech-anism proposed by Kamb et al. (1985). However, the sea-sonality observed at Kyagar Glacier is different to the often-cited winter initiation associated with closure of subglacial channels in the hydrological switch mechanism (Eisen et al., 2005; Kamb et al., 1985). In the case of Kyagar Glacier, de-velopment of an inefficient drainage system in winter does not necessarily facilitate increased subglacial water pressure until the beginning of the melt season, due a lack of liquid water in winter. Surge initiation in winter should not be
con-sidered a precondition of hydrologically controlled surges (see e.g. Jiskoot and Low, 2011).
We note that the idea of surge initiation through formation of an inefficient drainage system, as discussed in Sect. 5.1.2, could be replaced by that of a layer of subglacial till in which increased water pressure reduces till strength to a deforma-tion threshold (Boulton and Jones, 1979; Cuffey and Pater-son, 2010). It is likely that the tongue of Kyagar Glacier is underlain by a permeable till, owing to fine-grained sedimen-tary rock on which the glacier tongue lies (Desio et al., 1991; Searle and Phillips, 2007). We cannot speculate further on the exact nature of the subglacial drainage system as there is no field evidence, but we conclude that Kyagar Glacier is a system very sensitive to water in- and outputs during the surge, rather than being purely internally regulated.
The spatial pattern of acceleration and elevation change over Kyagar Glacier provides further information about the nature of the surge, in particular that it was the tongue of the glacier which primarily underwent surging, evidenced by the velocity increase (Fig. 8) and the steepening of the pro-file over the glacier tongue during quiescence (Fig. 11). The build-up of an ice reservoir at the confluence represents the intersection between the surging tongue and the tributaries, which maintain more steady flow and support the recharge of the ice reservoir during quiescence. We note also that looped moraines do not form at Kyagar Glacier because there is no surging of upper tributaries into a non-surging part of the glacier (see video in the Supplement). Surging confined mainly to the flatter, lower part of the glacier has been ob-served for a number of other Karakoram surges (Mayer et al., 2011; Quincey et al., 2015).
The distinction between these two parts of the glacier is also reflected in the glacier surface slope, with the tongue being much more gently sloped (2◦vs. 4.5◦). The surge be-haviour of Kyagar Glacier likely stems from the character-istics of the lower glacier, in particular its apparent inability to transport mass from the reservoir area down the glacier tongue to the terminus in a regular manner. Basal motion is necessary to transport mass from the reservoir area down the glacier tongue, but some characteristic of the glacier causes this to occur cyclically through periods of surging. Clarke et al. (1986) noted that surging glaciers tended to have greater slope over the accumulation area and lower slope over the ablation area, and Björnsson et al. (2003) summarised that surge-type glaciers in Iceland tended to exhibit small slopes with velocities too slow to remain in balance with the accumulation rate. These factors could also apply to Kya-gar Glacier. At least three of the five closest downstream neighbouring glaciers have also experienced surging (Cop-land et al., 2011; Mayer et al., 2011; Quincey et al., 2015) and share common topographic and climatic factors possibly contributing to their surge nature. The combination of steep accumulation areas and relatively flat glacier tongues may be conducive to surge development, as may the underlying sedimentary geology or the particular climatic conditions
ac-cording to the climatic envelope theory of Sevestre and Benn (2015).
We estimate a surge return period of around 15–20 years for Kyagar Glacier, based on the information that the last ma-jor period of advance was in the late 1990s (Hewitt and Liu, 2010) and the similarity between the glacier profile in 2000 and that from after the surge in 2015 (Fig. 11). The historic frequency of lake outburst flooding indicates periods of in-creased lake formation, and therefore probably surge activity, every 15–20 years (Fig. 2). The surge return periods of other individual Karakoram glaciers have also been similarly esti-mated at around 15 to 20 years (Mayer et al., 2011; Quincey and Luckman, 2014), although longer return periods are also possible (Copland et al., 2011).
5.2 Future outlook for Kyagar Glacier and lake formation
The potential volume of the glacier-dammed lake at Kya-gar Glacier depends on both the height of the ice dam at the glacier terminus and whether the subglacial channels through which the lake drains are open or closed. Thickening of over 60 m at the glacier terminus caused potential GLOF volume to increase more than 40-fold beginning in early 2014, to over 70 million m3, according to the August 2016 DEM of the glacier. GLOF hazard potential is expected to remain high for a number of years as the still slightly elevated tongue ve-locity continues to transport mass to the terminus area, poten-tially increasing the height of the ice dam until mass transport to the terminus area falls below the ablation rate. The height of the ice dam is expected to decrease at an estimated rate of 5 m a−1once mass transport to the terminus ceases, accord-ing to the ablation rate of the latest quiescence phase and the estimated melting rate of icebergs left in the empty lake basin after lake drainage in 2009/2010 (Haemmig et al., 2014). Un-less the mass balance significantly changes, it would be ex-pected that the next quiescence phase would last until around 2030 based on an estimated 15–20-year return period.
The size of future GLOFs depends largely only on the po-tential lake volume, the volume reached if the lake filled to 90 % of the ice height. However the actual volume reached may be less if the lake drains before the potential volume is reached. Despite the ice dam being about 5 m higher in 2016 than 2015, the lake volume was less in 2016 as the outburst occurred at about 85 % of the ice dam height. This can be ex-plained by subglacial channels from the 2015 lake outburst providing a weaker, preferential pathway for lake drainage and thus earlier outburst in 2016 followed by a smaller second outburst. We note that GLOFs > 80 million m3have never been followed by a significant drainage event in the next year (Fig. 2), which perhaps indicates that large floods cause formation of subglacial channels large enough to re-main open until the following year. Meteorological factors, such as temperature during the GLOF, may also influence the peak flood discharge (Ng et al., 2007).
It is important that the height of the ice dam and the lake evolution be monitored through satellite imagery each sum-mer in the years following the surge, to assess imminent GLOF threat and allow affected communities to be better prepared for flood impacts.
6 Conclusions
Our integrative picture of the recent surge of Kyagar Glacier – built from satellite surface velocity maps, terrestrial sta-tion images, and DEMs – provides an extraordinary insight into glacial surging in connection with surface hydrology and glacier-dammed lake formation and outburst. After gradual surface velocity increase through the last few years of the quiescence, the glacier entered a state highly sensitive to sur-face water input. Two dramatic acceleration phases occurred in concurrence with the onset of the surface meltwater pro-duction in the seasons of 2014 and 2015, indicating a surge mechanism related to the evolution of the basal hydrological system and associated changes in subglacial water pressure, rather than to an internally controlled switch to temperate basal temperatures. Between the acceleration phases, decel-eration was accompanied by drainage of subglacial water, evidenced by the filling of the glacier-dammed lake during the winters of 2014/2015 and 2015/2016. Lake drainage in July 2015 caused instantaneous deceleration over the whole glacier tongue, indicating that a sudden drainage of the sub-glacial water under a large part of the glacier tongue occurred with the lake outburst event.
Surging of Kyagar Glacier is the main driver of ice-dammed lake formation and GLOFs. The thickening of over 60 m at the glacier terminus during the surge caused poten-tial GLOF size to increase almost 40-fold beginning in early 2014, to over 70 million m3at the end of summer 2016. The hazard potential of large GLOFs remains high in the next few years, potentially larger than the 2015 and 2016 GLOFs, but the actual magnitude depends on the timing of lake drainage. Remotely sensed data, in particular from TanDEM-X, are es-sential to the observation of the surge phenomenon and the assessment of hazard formation. The remote sensing of the glacier should be continued to monitor lake formation and the evolution of the ice dam height.
Data availability. The list of satellite data used is included in the Supplement. Sentinel-1A and Landsat satellite data are publicly available online from ESA (https://cophub.copernicus.eu/dhus/#/ home) and USGS (https://landsat.usgs.gov/landsat-data-access), re-spectively. Access to all TanDEM-X data can be applied for online from DLR (https://tandemx-science.dlr.de/), or specific data can be provided by the authors on request. Data from the stations in China are regulated by GEOTEST and local Chinese authorities, and can be requested through the authors.
The Supplement related to this article is available online at doi:10.5194/tc-11-723-2017-supplement.
Author contributions. Vanessa Round wrote major parts of the pa-per, calculated velocity maps, and analysed all data. Silvan Leinss developed the offset tracking algorithms and did the interferomet-ric processing to obtain the DEMs. Matthias Huss and Christoph Haemmig initiated the study and contributed to discussion of the results throughout. Irena Hajnsek provided feedback on a final ver-sion.
Competing interests. The authors declare that they have no conflict of interest.
Acknowledgements. We are grateful to the German Space Agency (DLR) for providing TanDEM-X data through the proposal XTI_GLAC6780, the European Space Agency (ESA) for Coper-nicus Sentinel-1A and Sentinel-2 data, and the US Geological Survey for provision of Landsat data. Geopraevent AG provided access to data and images from the monitoring stations in China. We thank ETH Zurich for providing the funding for this study and M. Funk for helpful comments on the manuscript. We would like to acknowledge the constructive reviews by M. Truffer and C. Mayer and comments by the scientific editor, O. Eisen, which contributed to the final version of this paper.
Edited by: O. Eisen
Reviewed by: C. Mayer and M. Truffer
References
Barrand, N. E. and Murray, T.: Multivariate Controls on the In-cidence of Glacier Surging in the Karakoram Himalaya, Arct. Antarct. Alp. Res., 38, 489–498, 2006.
Björnsson, H.: Hydrological characteristics of the drainage system beneath a surging glacier, Nature, 395, 771–774, 1998.
Björnsson, H.: Understanding jokulhlaups; from the tale to theory, J. Glaciol., 56, 1002–1010, 2010.
Björnsson, H., Pálsson, F., Sigurdsson, O., and Flowers, G. E.: Surges of glaciers in Iceland, Ann. Glaciol., 36, 82–90, 2003. Boulton, G. S. and Jones, A. S.: Stability of temperate ice caps and
ice sheets resting on beds of deformable sediment, J. Glaciol., 24, 29–43, 1979.
Boulton, G. S. and Zatsepin, S.: Hydraulic impacts of glacier ad-vance over a sediment bed, J. Glaciol., 52, 497–527, 2006. Chen, Y., Xu, C., Chen, Y., Li, W., and Liu, J.: Response of
glacial-lake outburst floods to climate change in the Yarkant River basin on northern slope of Karakoram Mountains, China, Quatern. Int., 226, 75–81, 2010.
Clarke, G. K. C.: Length, width and slope influences on glacier surg-ing, J. Glaciol., 37, 236–246, 1991.
Clarke, G. K. C., Collins, S. G., and Thompson, D. E.: Flow, thermal structure and subglacial conditions of a surge-type glacier, Can. J. Earth Sci., 21, 232–240, 1984.
Clarke, G. K. C., Schmock, J., Simon, C., Ommanney, L., and Collins, S. G.: Characteristics of Surge-Type Glaciers, J. Geo-phys. Res., 91, 7165–7180, 1986.
Copland, L., Sylvestre, T., Bishop, M. P., Shroder, J. F., Seong, Y. B., Owens, L. A., Bush, A., and Kamp, U.: Expanded and Recently Increased Glacier Surging in the Karakoram, Arct. Antarct. Alp. Res., 43, 503–516, 2011.
Cuffey, K. M. and Paterson, W. S. B.: The Physics of Glaciers, El-sevier, 4 Edn., 2010.
Dehecq, A., Millan, R., Berthier, E., Gourmelen, N., and Trouvé, E.: Elevation changes inferred from TanDEM-X data over the Mont-Blanc area: Impact of the X-band interferometric bias, IEEE J. Sel. Top. Appl., 22–24 July, 2015.
Desio, A., Caporali, A., Gaettani, M., Gosso, G., Palmieri, F., Pog-nante, U., and Rampini, L.: Geodesy, Geophysics and Geology of the Upper Shaksgam Valley (North-East Karakoram) and South Sinkiang, Consiglio Nazionale delle Ricerche, 1991.
Dunse, T., Schellenberger, T., Hagen, J. O., Kääb, A., Schuler, T. V., and Reijmer, C. H.: Glacier-surge mechanisms promoted by a hydro-thermodynamic feedback to summer melt, The Cryosphere, 9, 197–215, doi:10.5194/tc-9-197-2015, 2015. Eisen, O., Harrison, W. D., Raymond, C. F., Echelmeyer, K. A.,
Bender, G. A., and Gorda, J. L. D.: Variegated Glacier, Alaska, USA: a century of surges, J. Glaciol., 51, 399–406, 2005. Farr, T. G., Rosen, P. A., Caro, E., Crippen, R., Duren, R.,
Hensley, S., Kobrick, M., Paller, M., Rodirguez, E., Roth, L., Seal, D., Schaffer, S., Shimada, J., Umland, J., Werner, M., Oskin, M., Burbank, D., and Alsdorf, D.: The Shut-tle Radar Topography Mission, Rev. Geophys., 45, RG2004, doi:10.1029/2005RG000183, 2007.
Fischer, G., Parrella, G., Papathanassiou, K., and Hajnsek, I.: Inter-pretation of Pol-InSAR Signatures from Glaciers and Ice Sheets at Different Frequencies, Proceedings of EUSAR 2016: 11th Eu-ropean Conference on Synthetic Aperture Radar, 6–9 June, 2016. Fowler, A. C., Murray, T., and Ng, F. S. L.: Thermally controlled
glacier surging, J. Glaciol., 47, 527–538, 2001.
GAPHAZ: 17 July and 21 September 2016 glacier collapses in Ti-bet, available at: http://gaphaz.org/, 2016.
Gardelle, J., Berthier, E., Arnaud, Y., and Kääb, A.: Region-wide glacier mass balances over the Pamir-Karakoram-Himalaya dur-ing 1999–2011, The Cryosphere, 7, 1263–1286, doi:10.5194/tc-7-1263-2013, 2013.
Goldstein, R. M. and Werner, C. L.: Radar interferogram filter-ing for geophysical applications, Geophys. Res. Lett., 25, 4035– 4038, 1998.
Goldstein, R. M., Zebker, H. A., and Werner, C. L.: Satellite radar interferometry – Two-dimensional phase unwrapping, Ra-dio Sci., 23, 713–720, 1988.
Greve, R. and Blatter, H.: Dynamics of Ice Sheets and Glaciers, Springer Berlin Heidelberg, 1 Edn., 2009.
Haemmig, C., Huss, M., Keusen, H., Hess, J., Wegmüller, U., Ao, Z., and Kulubayi, W.: Hazard assessment of glacial lake outburst floods from Kyagar glacier, Karakoram Mountains, China, Ann. Glaciol., 55, 34–44, doi:10.3189/2014AoG66A001., 2014. Harrison, W. D. and Post, A. S.: How much do we really know about
glacier surging?, Ann. Glaciol., 36, 1–6, 2003.
Harrison, W. D., Osipova, G. B., Nosenko, G. A., Espizua, L., Kääb, A., Fischer, L., Huggel, C., Burns, P. A. C., Truffer, M., and Lai,
A. W.: Glacier Surges, Chapter 13, in: Snow and Ice-Related Hazards, Risks and Disasters, Elsevier, 2014.
Heid, T. and Kääb, A.: Repeat optical satellite images reveal widespread and long term decrease in land-terminating glacier speeds, The Cryosphere, 6, 467–478, doi:10.5194/tc-6-467-2012, 2012.
Hewitt, H. and Liu, J.: Ice-dammed lakes and outburst floods, Karakoram Himalaya: historical perspectives on emerg-ing threats, Phys. Geogr., 36, 528–551, doi:10.2747/0272-3646.31.6.528, 2010.
Hoinkes, H. C.: Surge of the Vernagtferner in the Ötztal Alps since 1599, Can. J. Earth Sci., 6, 853–861, doi:10.1139/e69-086, 1969. Huss, M.: Density assumptions for converting geodetic glacier volume change to mass change, The Cryosphere, 7, 877–887, doi:10.5194/tc-7-877-2013, 2013.
Jiskoot, H. and Low, R. H.: Is seasonal timing of surge initiation or termination related to surge character and development?, AGU Fall Meeting Abstracts, 503–516, 2011.
Jiskoot, H., Maurray, T., and Boyle, P.: Controls on the distribution of surge-type glaciers in Svalbard, J. Glaciol., 46, 412–422, 2000. Kamb, B., Raymond, C. F., Harrison, W. D., Engelhardt, H., Echelmeyer, K. A., Humphrey, N., Brugman, M. M., and Pfef-fer, T.: Glacier Surge Mechanism: 1982–1983 Surge of the Var-iegated Glacier, Alaska, Science, 227, 469–479, 1985.
Kapnick, S. B., Delworth, T. L., Ashfaq, M., Malyshev, S., and Milly, P. C. D.: Snowfall less sensitive to warming in Karakoram than in Himalayas due to unique seasonal cycle, Nat. Geosci., 7, 834–840, 2014.
Krieger, G., Moreira, A., Fiedler, H., Hajnsek, I., Werner, M., You-nis, M., and Zink, M.: TanDEM-X: A Sattelite Formation for High-Resolution SAR Interferomertry, IEEE T. Geosci. Remote, 45, 3317–3341, 2007.
Krieger, G., Zink, M., Bachmann, M., Bräutifam, B., Schulze, D., Martone, M., Rizzoli, P., Steinbrecher, U., Antony, J. A., Zan, F. D., Hajnsek, I., Papathanassiou, K., Kugler, K., and Cassola, F.: TanDEM-X: A radar interferometer with two formation-flying satellites, Acta Astronaut., 89, 83–98, 2013.
Leinss, S., Wiesmann, A., Lemmetyinen, J., and Hajnsek, I.: Snow Water Equivalent of Dry Snow Measured by Differential Inter-ferometry, IEEE J. Sel. Top. Appl., 8, 3773–3790, 2015. Luckman, A., Quincey, D., and Bevan, S.: The potential of
satel-lite radar interferometry and feature tracking for monitoring flow rates of Himalayan glaciers, Remote Sens. Environ., 111, 172– 181, 2007.
Mason, K.: Exploration of the Shaksgam Valley and Aghil Ranges, 1926, Survey of India, 1928.
Mayer, C., Fowler, A. C., Lambrecht, A., and Schnarrer, K.: A surge of North Gasherbrun Glacier, Karakoram, China?, J. Glaciol., 57, 904–916, 2011.
Meier, M. F. and Post, A.: What are glacier surges?, Can. J. Earth Sci., 6, 807–817, 1969.
Murray, T., Stuart, G. W., Miller, P. J., Woodward, J., Smith, A. M., Porter, P. R., and Jiskoot, H.: Glacier surge propagation by ther-mal evolution at the bed, J. Geophys. Res., 105, 13491–13507, 2000.
Nagler, T. and Rott, H.: SAR tools for snowmelt modelling in the project HydAlp, Int. Geosci. Remote Se., 3, 1521–1523, 1998.
Nagler, T., Rott, H., Ripper, E., Bippus, G., and Hetzenecker, M.: Advancements for Snowmelt Monitoring by Means of Sentinel-1 SAR, Remote Sens., 8, 348, doi:Sentinel-10.3390/rs8040348, 20Sentinel-16. Ng, F., Liu, S., Mavlyudov, B., and Wang, Y.: Climatic control
on the peak discharge of glacier outburst floods, Geophys. Res. Lett., 34, L21503, doi:10.1029/2007GL031426, 2007.
Quincey, D. J. and Luckman, A.: Brief Communication: On the magnitude and frequency of Khurdopin glacier surge events, The Cryosphere, 8, 571–574, doi:10.5194/tc-8-571-2014, 2014. Quincey, D. J., Braun, M., Glasser, N. F., Bishop, M. P., and
Luck-man, A.: Karakoram glacier surge dynamics, Geophys. Res. Lett., 38, L18504, doi:10.1029/2011GL049004, 2011.
Quincey, D. J., Glasser, N. F., Cook, S. J., and Luckman, A.: Het-erogeneity in Karakoram glacier surges, J. Geophys. Res.-Earth, 120, 1288–1300, 2015.
Randolph Glacier Inventory Version 5.0: Global Land Ice Measure-ments from Space, Boulder Colorado, USA, Digital Media, Tech. rep., available at: http://www.glims.org/RGI/index.html, 2015. Raymond, C. F.: How Do Glaciers Surge?, J. Geophys. Res., 92,
9121–9134, 1987.
Rignot, E., Echelmeyer, K., and Krabill, W.: Penetration depth of interferometric synthetic-aperture radar signals in snow and ice, Geophys. Res. Lett., 28, 3501–3504, 2001.
Searle, M. P. and Phillips, R. J.: Relationships between right-lateral shear along the Karakoram Fault and metamorphism, magma-tism, exhumation and uplift: evidence from the K2-Gashebrum-Pangong ranges, north Pakistan and Ladakh, J. Geol. Soc. Lon-don, 164, 439–450, 2007.
Sevestre, H. and Benn, D. I.: Climatic and geometric controls on the global distribution of surge-type glaciers: implications for a unifying model of surging, J. Glaciol., 61, 646–659, 2015. Sevestre, H., Benn, D. I., Hulton, N. R. J., and Baelum, K.: Thermal
structure of Svalbard glaciers and implications for thermal switch models of glacier surging, J. Geophys. Res., 120, 2220–2236, 2015.
Small, D.: SAR backscatter multitemporal compositing via local resolution weighting, Int. Geosci. Remote Se., 22–27 July 2012, 4521–4524, 2012.
Strozzi, T., Luckman, A., Murray, T., Wegmüller, U., and Werner, C. L.: Glacier Motion Estimation Using SAR Offset-Tracking Procedures, IEEE T. Geosci. Remote, 40, 2384–2390, 2002. Truffer, M., Harrison, W. D., and Echelmeyer, K. A.: Glacier motion
dominated by processes deep in underlying till, J. Glaciol., 46, 213–221, 2000.
Vaughan, D. G.: Recent Trends in Melting Conditions on the Antarctic Peninsula and Their Implications for Ice-sheet Mass Balance and Sea Level, Arct. Antarct. Alp. Res., 38, 147–152, 2006.
Weertman, J.: Water lubrication mechanism of glacier surges, Can. J. Earth Sci., 6, 929–942, 1969.
Yasuda, T. and Furuya, M.: Dynamics of surge-type glaciers in West Kunlun Shan, Northwestern Tibet, J. Geophys. Res.-Earth, 120, 2393–2405, 2015.
Zebker, H. A. and Villasenor, J.: Decorrelation in interferometric radar echos, Int. Geosci. Remote Se., 30, 950–959, 1992. Zebker, H. A. and Yanping, L.: Phase unwrapping algorithms for
radar interferometry: residue-cut, least-squares, and synthesis al-gorithms, J. Opt. Soc. Am., 15, 586–598, 1998.
Zhang, X.: Investigation of glacier bursts of the Yarkant River in Xinjiang, China, Ann. Glaciol., 16, 135–139, 1992.
Zitova, B. and Flusser, F.: Image registration methods: a survey, Im-age Vision Comput., 21, 977–1000, 2003.