ECONOMIC AND SYSTEM RELIABILITY CONSIDERATIONS FOR ACHIEVING AN EXTENDED OPERATING CYCLE FOR LIGHT WATER REACTORS
by Feng Li
B.S., Engineering Mechanics Tsinghua University, Beijing, China, 1990
M.S., Reactor Engineering and Safety Tsinghua University, Beijing, China, 1991 Submitted to the Department of Nuclear Engineering
in Partial Fulfillment of the Requirement for the Degree of Master of Science in Nuclear Engineering
at the
Massachusetts Institute of Technology September, 1996
@ 1996 Massachusetts Institute of Technology All rights reserved
Signature of Author... ... ... Department of Nuclear Engineering
August 8, 1996 Certified by...
Neil. E. Todreas Professor of Nuclear Engineering Thesis Co-Supervisor Certified by..
<Z Michael. W. Golay
Professor of Nuclear Engineering Thesis Co-Supervisor A ccepted by...
ff
(
Jeffrey P.
Friedberg
ChaIrman, Department Committee on Graduate Students
MAY 19 1997
Science
LIBRARFiES
ECONOMIC AND SYSTEM RELIABILITY CONSIDERATIONS FOR ACHIEVING AN EXTENDED OPERATING CYCLE FOR LIGHT WATER REACTORS
by Feng Li
Submitted to the Department of Nuclear Engineering in Partial Fulfillment of the Requirement for the Degree of Master of Science in Nuclear Engineering
ABSTRACT
The economic performance of a nuclear power plant can be improved by increasing the plant capacity factor. However, the current short refueling cycle lengths, usually 12 to 18 months, limit the capacity factor that can be achieved. Extending the refueling cycle length should be considered as a strategy to obtain higher capacity factor. A project concerned with the feasibility of extending the refueling interval to 48 months is currently in progress at MIT. This thesis will be a part of this project.
This thesis has two major parts. The first part is an economic analysis. The purpose of the economic analysis is to study the economic feasibility of operating cycle extension, and to set a reasonable goal for the capacity factor of the plant and its individual systems which is required to make a 48-month operating cycle length economically attractive. In the economic analysis, the potential benefits and costs of operating cycle extension are identified. The major benefit of cycle extension is the additional electricity generation because of the higher plant capacity factor. Besides this, benefits can be gained from reduced number of outages. The dominant cost of operating cycle extension is the extra fuel cost because of the required higher fuel enrichment and lower fuel burnup. A economic model for operating cycle extension is developed to evaluate the net benefit of operating cycle extension. As the extreme boundaries, the annual extra cost is considered as constant and linearly changing with the extended cycle length.
In the economic analysis, the changes in the net benefit due to different extended cycle lengths, changes in total outage length and different current cycle lengths are studied; the sensitivities of net benefit to the total extra costs and the electricity price are also studied. All these sensitivity studies are carried out based upon both constant and linear annual extra cost models. Since some required surveillance whose interval is shorter than 48 months may not be extended, a mid-cycle planned outage for surveillance only may be necessary. The effects of the mid-cycle outage on the plant capacity factor and net benefit of refueling cycle extension will be studied.
The second part of this thesis is a study for improving the reliability and capacity factor of nuclear plant systems. To make the extension of refueling cycle length to 48 months profitable, the unplanned outage rate must be limited below a certain level. This requirement for unplanned outage rate is set based upon the results of the economic analysis. The intentions of the reliability and capacity factor analyses are to identify the individual component performance regimes of a PWR system which are necessary for achieving the required levels of power plant reliability, to formulate the basic strategies for obtaining high capacity factor for PWR systems, and to develop a framework for analyzing the economically-important system performance.
The feedwater supply system of a PWR, the Seabrook Nuclear Power Station is chosen as an example. To aid in understanding the system's working principle, a system description is included in this thesis. By using a Markov model, the feedwater supply system reliability is thoroughly investigated. The studies include a reliability analysis and a capacity factor analysis. The reliability analysis identifies the key components of the condensate and feedwater system based upon plant-specific data. The capacity factor analysis studies whether the strategy of providing redundancy in the key components is necessarily a good strategy for improving the capacity factor of an economically-important system, even though we already know that it is a good strategy for improving the reliability of a safety-important system. The capacity factor analysis also studies the sensitivity of system capacity factor to the individual system component failure rates and repair rates. The component performance regimes is thus obtained from these sensitivity analyses. In addition, the effects of common cause failures, human errors, and component wearout upon the system capacity factor is also investigated in the capacity factor analysis. Based upon the results of these analyses, the strategies for obtaining high system capacity factor are proposed.
Neil E. Todreas
Title: Professor of Nuclear Engineering Co-supervisor
Michael W. Golay
Title: Professor of Nuclear Engineering Co-supervisor
Acknowledgments
This thesis is a portion of the "Improvement in Nuclear Plant Capacity Factors Through Longer Cycle Length Operation" project, funded by the US Department of Energy through a subcontract with the Idaho National Engineering Laboratory (INEL) University Research Consortium.
I am grateful to Professor Michael W. Golay and Professor Neil E. Todreas, the thesis co-supervisors. Without their continuous guidance, supports and insights, this thesis would not have been possible.
I am also appreciative of the efforts put forth by Professor Michael J. Driscoll. His suggestions and comments on this thesis were invaluable. I would like to express my appreciation to my colleagues: Michael V. McMahon, Thomas J. Moore, Robert S. Mchenry, and Christopher Handwerk. Discussions with them were always stimulating, and their assistance in language was very useful.
I am also grateful to the engineering staff of the Seabrook Nuclear Power Station for valuable discussions on the feedwater supply system upon which this thesis was focused.
Table of Contents
Chapter 1 INTRODUCTION...
12
1.1 Im petus ... 12
1.2 Forty-Eight Month Operating Cycle Project... 15
1.3 Thesis O bjectives... 16
1.3.1 Economic Considerations... 17
1.3.2 Reliability and Availability Considerations ... 18
1.4 Term inology... 20
Chapter 2 ECONOMIC FACTORS OF OPERATING CYCLE
EXTENSION ...
22
2.1 Benefits of Operating Cycle Extension... ... 22
2. 1.1 Introduction ... 22
2.1.2 Increased Generation of Electricity ... ... 23
2.1.3 Operation and Maintenance Benefits... ... 23
2.1.4 Benefit to Environment and Plant Personnel ... 25
2.2 Extra Costs of Operating Cycle Extension... ... 25
2.2.1 Introduction ... ... 25
2.2.2 Extra Fuel Cost... ... 26
2.2.3 Transition Cost... 26
2.2.4 M anagement Cost... ... ... 27
Chapter 3 CALCULATION OF THE NET BENEFITS OF
OPERATING CYCLE EXTENSION ...
28
3.1 Introduction ... 28
3.2 Modeling the Extra Costs ... 29
3.3 M odeling the Benefits ... 31
3.4 Net Benefit of Operating Cycle Extension... 32
Chapter 4 RESULTS AND CONCLUSIONS OF ECONOMIC
ANALYSIS...
35
4.1 Introduction ... 35
4.2 Net Benefits of Extending Plant Cycle Length Without Considering A M id-Cycle Outage ... 36
4.2.1 Effects of Extended Plant Cycle Length ... 36
4.2.2 Effects of Total Outage Length ... 38
4.2.3 Effects of Current Operating Cycle Length... 41
4.2.4 Effects of Total Extra Costs... 43
4.2.5 Effects of Replacement Energy Cost... 47
4.3 Effects of Mid-Cycle Outage... 49
4.3.1 Effects on Plant Capacity Factor ... 49
4.3.2 Effects on Net Benefit... ... 51
4.4 Conclusions of Economic Analysis... ... ... 51
Chapter 5 THE FEEDWATER SUPPLY SYSTEM OF A TYPICAL
PWR...
53
5.1 General System Description ... ... 53
5.3 Feedwater System ... 59
5.4 Heater Drain System ... 63
5.5 Sum m ary ... 66
Chapter 6 EVALUATION OF EXPECTED SYSTEM RELIABILITY
AND CAPACITY FACTOR ...
... 67
6.1 Component reliability and Availability ... 67
6.2 Fault Tree M ethod ... 69
6.3 Event Tree Method ... 70
6.4 Calculation of System Reliability and Capacity Factor ... 71
6.5 M odeling the System ... 72
6.6 Component Failure Rate and Repair Rate Data... 74
Chapter 7 RESULTS OF SYSTEM RELIABILITY AND CAPACITY
FACTOR ANALYSIS ...
76
7.1 Results of Reliability Analysis... 76
7.2 Results of Capacity Factor Analysis ... 77
7.2.1 Results Using Failure Rate Data From the Seabrook Nuclear Power Plant ... .. . ... 78
7.2.2 Results Categorizing the Components into Passive and Active Components... ... ... 80
Chapter 8 CONCLUSIONS OF SYSTEM RELIABILITY AND
CAPACITY FACTOR ANALYSIS...
94
Chapter 9 SUMMARY AND FUTURE WORKS... 97
Appendix:
Failure Rate Data of Major Components of the Condensate and Feedwater System ... 99List of Figures
Figure 3.1 Benefits and Costs Trends Associated with Capacity Factor Increase ... 28 Figure 4.1 Net Benefit v/s Cycle Length For Various Outage Lengths
(Constant Extra Cost, Current Cycle Length: 18 Months) ... 37 Figure 4.2 Net Benefit v/s Cycle Length For Various Outage Lengths
(Linear Extra Cost, Current Cycle Length: 18 Months)...38 Figure 4.3 Net Benefit v/s Outage Length For Various Cycle Lengths
(Constant Extra Cost, Current Cycle Length: 18 Months)...39 Figure 4.4 Net Benefit v/s Outage Length For Various Cycle Lengths
(Linear Extra Cost, Current Cycle Length: 18 Months)...40 Figure 4.5 Net Benefit v/s Cycle Length For Various Outage Lengths
(Constant Extra Cost, Current Cycle Length: 12 Months)...41 Figure 4.6 Net Benefit v/s Cycle Length For Various Outage Lengths
(Linear Extra Cost, Current Cycle Length: 12 Months)...42 Figure 4.7 Net Benefit v/s Cycle Length (Constant Extra Cost,
Current Cycle length: 18 months, Total Added Cost: $ 25 Million/year)... 43 Figure 4.8 Effect of Total Cost For Various Cycle Lengths (Constant Extra Cost,
Current Cycle Length: 18 months, Total outage length: 70 days)... 44 Figure 4.9 Net Benefit v/s Cycle Length (Linear Extra Cost,
Current Cycle length: 18 months, Total Added Cost: $ 25 Million/year)... 45 Figure 4.10 Effect of Total Cost For Various Cycle Lengths (Linear Extra Cost,
Current Cycle Length: 18 months, Total outage length: 70 days)... 46 Figure 4.11 Effect of Replacement Energy Cost per EFPD (Constant Extra Cost,
Current Cycle Length: 18 months, Outage length: 70 days)... 47 Figure 4.12 Effect of Replacement Energy Cost per EFPD (Linear Extra Cost,
Figure 4.13 Effect on Capacity Factor of Mid-Cycle Outage For Various Unplanned Outage Lengths
(Refueling Outage: 30 days, Current total outage: 80 days,
Current cycle length: 18 months, Extended cycle length: 48 months)... 49
Figure 4.14 Effect on Net Benefit of Mid-Cycle Outage Length For Various Unplanned Outage Lengths (Refueling Outage: 30 days, Current total outage: 80 days, Current cycle length: 18 months, Extended cycle length: 48 months)... 50
Figure 5.1 A Schematic of Feedwater Supply Systems... 54
Figure 5.2 A Schematic of Condenser and Condensate System ... ... 56
Figure 5.3 A Schematic of Feedwater System ... ... 60
Figure 5.4 A schematic of Heater Drain System ... ... 64
Figure 6.1 Bathtub Shape Failure Rate Function ... 69
Figure 7.1 Absolute System Capacity Change Due to Adding Redundant SGFP ... 80
Figure 7.2 System Capacity Factor v/s Passive Components Failure Rate ... 81
Figure 7.3 System Capacity Factor v/s Active Components Failure Rate ... 81
Figure 7.4 System Capacity Factor v/s Passive Components Repair Rate... 83
Figure 7.5 System Capacity Factor v/s active Components Repair Rate...83
Figure 7.6 Illustration of The Effective Failure Rate of Active Components ... 84
Figure 7.7 Illustration of The Effective Failure Rate of Passive Components... 85
Figure 7.8 Human Error Effect on System Capacity Factor... 86
Figure 7.9 Common Cause Failure Effect on Capacity Factor...87
Figure 7.10 Effect of Common Cause Failure Repair Rate on Capacity Factor ... 87
Figure 7.11 The Bathtub Shape Failure Rate (hazard) Function of Active Components (Different Inceptions)... 88
Figure 7.13
Figure 7.14
Figure 7.15
Figure 7.16
The Bathtub Shape Failure Rate (hazard) Function of Active Components (Different Wearout Rate, Wearout Inception: 3 yr)... 90 Wearout Effects on System Capacity Factor (Different Wearout Rates,
Wearout Inception: 3 yr) ... ... 91 The Bathtub Shape Failure Rate (hazard) Function of Active Components
(Different Wearout Rate, Wearout Inception: 2 yr)... 92 Wearout Effects on System Capacity Factor (Different Wearout Rates,
List of Tables
Chapter 1 INTRODUCTION
1.1 Impetus
Nuclear power has been facing more and more competition since the former monopolized utility market was opened to independent power producers (IPP). The competition from the coal and gas power forces the nuclear industry to focus on strategies that will improve its economic performance and make it attractive compared with other major electric power producing options. Only by pursuing these strategies may the nuclear industry be able to survive in the short term and grow in the long term.
Conventional power plants have economic advantages over nuclear plants, such as lower construction costs and interest payment, fewer safety requirements and thus lower operation and maintenance costs, low decommissioning costs, and relatively less staff levels. But nuclear plants have an obvious advantage over the conventional plants in their much lower fuel costs. The contribution to the cost per unit electricity from some costs, such as fuel costs, is almost constant; but the contributions from some other costs, such as investment and staff costs, which are basically constant in the total amount, will decease if the amount of generated electricity increases. Therefore, the time that the nuclear plant is on-line should be pursued as much as possible because the more time that the nuclear plant is on-line, the less generating cost per unit electricity, and the more the disadvantages of nuclear power can be offset by its low fuel costs.
The economic performance of nuclear power plants is usually measured in terms of capacity factor. Capacity factor is defined as the ratio of the amount of electricity
produced over a given time period to the amount of electricity that could have been produced if the plant had always been operated at full capacity for the same time period. Since a nuclear plant is generally operated at full capacity when on-line, the capacity factor is approximately determined by the ratio of on-line time to the sum of on-line and off-line time for a given time period. The off-line time, called outage time, consists of two parts, planned outage and unplanned outage. The planned outage is usually scheduled over a certain time period for reactor refueling, component maintenance and other surveillance activities. Unplanned outage, sometimes called forced outage, is usually caused by system malfunctions or human errors. Any strategy to improve the plant capacity factor has to reduce the length of planned outage and/or unplanned outage over a given time period.
An unplanned outage is the unanticipated plant shutdown or power reduction due to component failures or/and operator errors. It can be reduced by optimizing the design, enhancing the component performance, shortening the repair times, and reducing the human error rates. The unplanned outage rate should be minimized, because the unplanned shutdown of a nuclear plant is not only a economic loss, but may also have a negative impact on the plant operational safety.
The length of planned outage over a given period can be reduced by reducing the total length of each outage or by extending the time interval between two planned outages, thus effectively reducing the planned outage length over the given time period. Both approaches are currently practiced by the industry. Some European countries, such as Finland and Switzerland, are operating their nuclear plants with short planned outages. In Finland, the plants are operating on a one-year refueling cycle, with alternating ten and
fifteen day planned outages. In the US, the nuclear industry is also striving to reduce the planned outage length. However, equal effort is also focused on extending the operating cycle length. The reasons are as follows:
* Historically, the US nuclear industry has had long outage lengths with the average values being about sixty-five days for PWRs and a little longer for BWRs, although the best plant has been as short as twenty-two days. This is the basis for concluding that margin exists for improvement of plant capacity factor through either extension of
operating cycle length or reduction of planned outage length.
* The capacity factor of a plant with a longer operating cycle is higher than that of a plant with a shorter operating cycle. As illustrated in Table 1.1, if the planned outage length is sixty days, assuming no forced outages, the maximum capacity factor that can be achieved in a plant with 48-month cycle is 95.9%. This is much higher than that of a twelve-month cycle plant, which is only 83.6%.
12 Months 83.6%
18 Months 89.0%
24 Months 91.8%
48 Months 95.9%
Table 1.1 Maximum Capacity Factor For Variable Operating Cycle Length
* Doubling the cycle length is effectively equal to reducing the outage length by half. It may prove more difficult to reduce the outage length than to extend the cycle length in
order to achieve the same capacity factor enhancement; especially when the outage length is already relatively short.
Extending the cycle length will reduce the total number of refueling outages within a given time interval. Elimination of the expensive refueling outages can save a utility tens of millions dollars.
The US nuclear industry increasingly realizes the potential economic gains from the extension of operating cycles. However, as shown in Table 1.1, the current industry practice of moving from 12- and 18-month cycles to 24 month cycles may be too modest for sizable economic gains. It is logical to raise the questions: Are there even greater economic benefits available by extending the cycle length to the order of 48 months? And, if the answer to the first question is yes, how can these benefits be obtained? In order to answer these questions, a project concerned with the feasibility of extending the operating cycle to 48 months is underway at MIT. This thesis is a part of the work of this project.
1.2 Forty-eight Month Operating Cycle Project
In order to make the extension of the operating cycle to 48 months economically profitable, a comprehensive strategy for obtaining a 48-month operating cycle must be developed. Such a strategy should address the following areas:
* Core Design Issues: A fuel core needs to be designed that is capable of continuous operation for 48 months. For practicality, its dimensions, geometry, and thermal-hydraulic characteristics should fit the current operating plant envelope, and its fuel
burnup and poison concentrations should be maintained at or below the licensing limits.
* Required Reliability and Availability Performance: The forced outage rate must be limited in order to make a 48 month operating cycle economically profitable. Otherwise, the benefit gained from the longer cycle will be negated by the increased forced outage rate. A strategy for attaining the required plant levels of reliability and availability must be formulated.
* Surveillance Requirements: The surveillance activities include all required maintenance and testing. These activities must be made consistent with a 48-month cycle through one of three ways: extending the surveillance interval to at least 48 months, changing the surveillance from off-line to on-line, or eliminating unnecessary surveillances .
1.3 Thesis Objectives
There will be extra costs for a plant with 48-month operating cycle. These costs need to be offset by the economic gains of the longer cycle operation. The economic gains come mainly from the additional generated electricity due to the increased plant capacity factor. However, the plant forced outage rate has to be limited. Otherwise, the enhancement of the plant capacity factor through the longer cycle will be canceled by the increased forced outage rate. In order to understand how to make the extended operating cycle economically attractive, the following objectives are developed in this thesis:
1 T. Moore, J. Maurer, R. McHenry and N.E. Todreas, "Surveillance Strategy for a Four-Year Operating Cycle in Commercial Nuclear Reactors," MIT-ANP-TR-036, June 1996.
* Investigate the economic feasibility of extending the operating cycle length; set up a reasonable goal for the capacity factor of the plant and its individual systems that makes the extension of the operating cycle length to 48 months economically favorable.
* Identify the individual component performance regimes that are necessary for achieving the required levels of power plant reliability; formulate the basic principles for obtaining high capacity factors for economically-important systems; develop a framework for analyzing the economically-important system performance.
1.3.1 Economic Considerations
In order to achieve the first objective, an economic analysis is done. This economic analysis is described in Chapters two through five.
The economic penalty of an operating cycle extension comes mainly from the higher fuel cost because a 48-month cycle core requires higher performance fuel, such as, higher enrichment, higher quality of cladding, higher enrichment of burnable poisons. Lower burnup may also be required. Additionally, a transition cost is necessary. The economic gains through longer cycle operation come mainly from more generated electricity and fewer number of outages within a given time period. All these economic factors, both benefit and cost, are identified in Chapter two. The model to analyze the economic feasibility of extending operating cycle length is presented in Chapter three. The. impacts of the economic factors on the economics of the operating cycle extension are investigated in Chapter four. In term of maximum allowed outage days, Chapter four also
establishes the required goal for the plant capacity factor for the extension of operating cycle length to 48 months to be profitable.
Since some required surveillances whose interval is currently shorter than 48 months may not be extendible2, a mid-cycle planned outage for surveillance only may be necessary. The effects of the mid-cycle outage on the plant capacity factor and net benefit of refueling cycle extension are also studied in Chapter four.
The results and conclusions of economic analysis are summarized in the end of Chapter four. According to the analysis results, it can be concluded that extension of the operating cycle length to 48 months is economically feasible if the refueling outage length and the unplanned outage rate can be limited within a certain level.
1.3.2 Reliability and Availability Considerations
To achieve the second objective, a system reliability and capacity factor analysis is done as described in Chapters five to nine. In the reliability and capacity factor analysis, the feedwater supply system at Seabrook Nuclear Power Station (SNSP), a typical Westinghouse type PWR, is examined. The reason for choosing a feedwater supply system as an example is that the feedwater supply system has a significant impact on the plant capacity factor and safety.
To help to understand how the feedwater supply system performs its functions, a description of the system is included in Chapter five of this thesis. The methodology to evaluate the system reliability and capacity factor is developed in Chapter six. Chapter six describes the methods to
2 T. Moore, J. Maurer, R. McHenry and N.E. Todreas, "Surveillance Strategy for a Four-Year Operating
* Estimate the reliability of a component or its availability if the component is repairable; * Process the operational history record into needed failure and repair rates;
* Simplify the system to a degree which can be analyzed yet still captures the essential nature of problem;
* Understand the consequences for the system of each component's malfunction;
* Determine which system power capacity level corresponds to each combination of component failures;
* Calculate the probability of the system being in each of the possible power capacity levels.
The reliability and capacity factor analyses for a PWR feedwater supply system are presented in Chapter seven. In this chapter, the key components of the feedwater supply system are identified based upon the plant-specific data. It is studied whether the strategy of providing redundancy in the key components is necessarily a good strategy for improving the capacity factor of an economically-important system, even though it is already known that it is a good strategy for improving the reliability of a safety-important system. The capacity factor analysis also studies the sensitivity of system capacity factor to the individual system component failure rates and repair rates. The component performance regimes are obtained from these sensitivity analyses. In addition, the effects of common cause failures, human errors, and component wearout upon the system capacity factor are also investigated in the capacity factor analysis. Based upon the results of these analyses, the basic principles for obtaining high system capacity factor are identified in Chapter eight.
The conclusions of this thesis are summarized in Chapter nine, and some consideration about the future work are also presented in Chapter nine.
1.4 Terminology
Some important terms used in this thesis need to be clarified here.
Reliability: The "reliability" R(t) of a component (or a system), which performance is measured, is the probability that the component (or system) will operate
successfully over the time interval from 0 to t.
Availability: The "availability" A(t) of a component (or a system), which performance is measured, is the probability that the component (or system) is operating successfully at time t. If repair of the component is impossible, the availability A(t) must be equal to reliability R(t). If repair is possible, then R(t) • A(t).
Capacity: The "capacity" of a system is the designed maximum ability of system to perform the system function. The system may be running under full capacity or partial capacity corresponding to different output of the system.
Capacity Function: The "capacity function" C(t) of a system, which performance is measured, is the output of system at time t as the fraction of the full capacity, representing the system performance at time t.
Capacity Factor: The "capacity factor" CF(t) of a system, which performance is measured, is the ratio of the average output (capacity function C(t)) of the system over the time interval [O,t] to the full capacity of the system.
The capacity factor is a commonly used index to measure system performance.
Chapter 2
ECONOMIC FACTORS OF OPERATING
CYCLE EXTENSION
Comparing with current industrial practice, there are economic benefits and penalties associated with the extension of the operating cycle length. In order to study the economic feasibility of operating cycle length extension, all these economic factors need to be identified. This chapter will describe the benefits and costs due to the extension of
operating cycle length.
2.1 Benefits of Operating Cycle Extension
2.1.1 Introduction
There are many benefits which accrue to utilities that choose to extend plant cycle length. In some cases, they can be translated into direct revenue gains. In other instances, the benefits in the operation and maintenance (O&M) of the plant and the benefits to the environment are more difficult to quantify in monetary terms. All of these factors are addressed in this section.
The greatest benefit of extending fuel cycle lengths is the increase of the plant capacity factor, and thus the generation of more electricity. This term can be easily translated into monetary form if the cost of buying replacement electricity and the selling price of electricity are known. In addition to the benefit of increased electricity generation, there are also significant advantages to the environment and possibly to the O&M costs of plants.
2.1.2 Increased Generation of Electricity
If the total outage length of a nuclear plant, including forced outages and planned outages, can be maintained unchanged or even lower, a longer operating cycle results in a smaller ratio of outage time to cycle length, i.e., a higher capacity factor. The number of Effective Full Power Days (EFPDs) per year of plant operation is increased. The saving of replacement energy cost due to the increased EFPDs can be calculated if the monetary value of the dispatch of a KwHr of electricity to the grid is known. For example, the gross saving realized per EFPD for a 1150 MWe plant is $2.76 x 10⁷ * E, where E is the rate of replacement energy cost in terms of $/KwHr. The benefit of the increased amount of generated electricity varies with the different replacement energy prices of different regions. In the US, the average replacement energy cost is about 2.5 cents per KwHr. Therefore, the saving of replacement energy cost for each EFPD is about 0.7 million dollars.
2.1.3 Operation and Maintenance Benefits
O&M benefits are more difficult to quantify. However, the following factors can be significant:
* Expensive outage costs are reduced due to the fewer number of outages needed over the same time period. Normally during outages, most utilities pay considerable overtime to plant staff while hiring a large number of contract workers and outside services to complete all required jobs. By reducing the number of outages, the overtime, contract labor and service costs are proportionately reduced. There will also
be a reduction in the materials and supplies consumed during outages. This reduction of outage expenses could be as much as 15 million dollars per outage.
* More reliable components require fewer surveillances, tests, calibrations, and repairs. Consequently, less manpower is required to run the plant. The reduced labor cost is sizable. However, to achieve higher reliability, investments in hardware innovations and different management styles may be required. The investments will be listed in the second part of this chapter, as a cost of extending fuel cycle length.
* To achieve longer cycle length, new techniques are employed to make components more reliable. Thus, the costs of repair and replacement can be reduced since more reliable components require fewer repairs and replacements. This reduction may be tremendous.
* Fewer refuelings also reduce the probability of damage to equipment as a result of maintenance done during the outage. When the reactor vessel head is removed, there is the possibility of some inadvertent damage to the fuel or core internals. The thermal cycles imposed on other plant equipment can cause problems with seals, valve packing, and even structures. Most equipment performs better when it runs continuously than when subject to cycling.
* The time spent on outage planning may be reduced, since the number of outages is reduced.
* More reliable operation may result in a longer plant life. There is an obvious benefit if plant life can be extended since the initial investment required in nuclear power plants is so large.
2.1.4 Benefit to Environment and Plant Personnel
The potential benefit to the environment and plant personnel is most difficult to express in monetary terms. These impacts, however, are also important advantages resulting from the extension of fuel cycle length.
For example, the personnel radiation exposure is reduced because of the reduced amount of time spent by plant personnel in handling fuel and performing maintenance on primary systems during outage periods.
2.2 Extra Costs of Operating Cycle Extension
2.2.1 Introduction
There are costs inherent in extending plant cycle lengths. Most of them are one time expenses as initial investments for technical innovations or development of techniques to extend the cycle length of operating plants. However, the extra fuel cost is incurred over the entire subsequent operation period.
Extra fuel cost is the most significant cost in plant cycle extension. In addition, the transition cost may also be significant depending on the rate of premature replacement of old assemblies, even though it is a one time expense. These factors can be translated into monetary terms directly. Other additional expenses, such as management expense, however, are more difficult to determine. All of these costs will be addressed in this section.
2.2.2 Extra Fuel Cost
A longer-life core will utilize higher enrichment fuel. The higher enrichment requirement increases the cost. Also, depending on core design, the fuel burnup may have to be reduced so that more fuel is needed to produce the same amount of power. Besides, additional fuel is needed for the added plant on-line days. Preliminary estimates suggested that the extra fuel cost is about 1.5 mills/KwHr, i.e., about 13 million dollars per year for a 1150 Mw plant being extended to a 48 month cycle from the current 18 month cycle with an 87% capacity factor.1 More recent results, of work still in progress, suggest that even including reuse of peripheral assemblies, the cost could reach $27 million per year2.
2.2.3 Transition Cost
Transition cost is defined as the one time cost of shifting a currently operating plant to a longer cycle length. It includes:
* Initial investment to design the new core;
* Costs of labor and materials to replace the old core; * Cost of prematurely disposing of the old core.
(Note: the factors presented above refer only to the added incremental cost compared to "business as usual" cost associated with these factors.)
* Any investment in advanced technology applied to improve component availability, extend surveillance intervals, and perform on-line maintenance. For example, the
S"A Strategy For Extending Cycle Length To Improve Pressurized Water Reactor Capacity Factor", A.F.A. Ayoub and M.J. Driscoll, MIT-ANP-TR-032, May, 1995
investment in a robotics system to facilitate on-line testing of steam generators falls into this category.
* To reduce the repair time of failed components thus increasing the availability of components, more spare components may be required. There will be a cost to maintain this increased inventory.
2.2.4 Management Cost
More efficient management is required to achieve higher system/component availability and, ultimately, a higher plant capacity factor. Initial investment in upgrading management techniques and tools, such as advanced management software, may be required.
Also, extra on-site and off-site education and training may be required for plant workers to master the new technique. The investment in training facilities and costs of human resources need to be considered.
2.2.5 Other Costs
* Interest due to new investments;
Chapter 3 CALCULATION OF THE NET BENEFITS OF
OPERATING CYCLE LENGTH EXTENSION
3.1 Introduction
Benefits and costs of extending plant cycle lengths have been mentioned above. Subtracting the costs from the benefits will yield the net benefit of extending the plant cycle length.
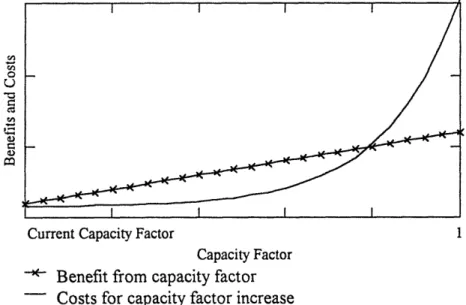
As illustrated in Figure 4.1, the benefits generally change in direct proportion to capacity factor increase. The costs, however, may resemble an exponential-like function. Starting from a low capacity factor state, a small investment in innovations may result in a large increase in capacity factor, but if the current capacity factor is already relatively high, even a small increase in capacity factor requires a much larger investment. Thus, there
CA vlJM c,, 0 Q a)
Current Capacity Factor
Capacity Factor
" Benefit from capacity factor
Costs for capacity factor increase
may be an upper limit to the capacity factors that power plants could achieve. Significant research will be required to determine the true shape of the curve of cost increase with capacity factor.
As a starting point, this chapter will try to quantify the economic factors of nuclear plant operating cycle length extension in term of the present monetary value. Therefore, the net benefits of such an extension can be calculated. In this chapter, the net benefits will be estimated in term of the annual net income. The effect of discount rate (i.e., the future monetary value) will not be considered at this point.
To simplify the analysis and still be able to ascertain the nature of the problem, only the extra fuel cost, the saving from replacement energy cost and the saving from the elimination of outages are considered in the following analysis, since they are the dominant economic factors of the operating cycle extension project.
3.2 Modeling The Extra Costs
The extra costs of the operating cycle extension mainly come from the increased fuel cost. For a plant operating at a relatively low capacity factor, the annual extra cost increases when the plant operating cycle length is extended. The longer the cycle is extended, the higher the extra cost. This is because the extra fuel cost is increased when the operating cycle is extended, even though the initial investments in some necessary innovations may be the same for variable extended cycle lengths.
The extra fuel cost is mostly due to the required higher enrichment and depends on the number of fuel batches. If the fuel batch fraction is linearized between 2.67 for an
18-month cycle, which is the current industrial practice, and 1 for the 48-18-month cycle, which is the design goal of this project, the extra fuel cost is roughly linearly proportional to the extended cycle length.1
This thesis will bracket the extra fuel cost using two extreme cases: 1) Constant annual extra fuel cost, 2) Linearly increased extra fuel cost. In the constant extra fuel cost model, the extra fuel cost is treated as 20 million dollars per year, regardless of the operating cycle length extension. In the linear cost model, the extra fuel cost is treated as zero for the current cycle, linearly increasing to 20 million dollars for the 48-month cycle. It must be emphasized that the benchmark value of 20 million dollars per year is still a rough preliminary estimate. These two models can be mathematically formulated as:
1) Constant Cost Model:
C=M (3-1)
2) Linear Cost Model:
T,
-To
C=
TeT
M
(3.-2)
1460 - To
where C is the annual extra fuel cost, To is the current cycle length in days, T. is the extended cycle length in days, M is the annual extra fuel cost if the cycle is extended to 48 months (1460 days). As mentioned above, the value of M is assumed to be 20 million dollars in this thesis.
The two extra fuel cost models are the extreme boundaries of the actual extra fuel cost, at least in terms of functional behavior, if not absolute magnitude. The constant cost
'Christopher S. Handwerk, "Economic Analysis of Implementing a Four Year Extended Operating Cycle in Existing PWR's." August 1996.
model represents the most pessimistic case and the linear cost model, which is based on the linearized batch fraction assumption, represents the most optimistic case. The actual economics of operating cycle length extension will be between the results of the analyses based on these two models. Even though more study is required to determine the precise relation between the extra fuel cost and the extended cycle length and to establish a more accurate number for the extra fuel cost, the present results based on these models are still able to give us valuable information about the economic feasibility of operating cycle extension.
3.3 Modeling The Benefits
The benefits of the operating cycle extension mostly come from the additional generated electricity and the saving from the elimination of outages. The benefit from the additional generated electricity is basically the saving for the replacement energy cost, which is proportional to plant capacity factor increase. The saving from eliminating each single outage can be taken as a constant.
If a plant, currently operated in a cycle length of To with a total outage length of Oo, is modified to operate in a cycle length of T, with a total outage length of 0,, the increase ACP of plant capacity factor will be
ACP = O e 00 (3-3)
Te
To
If the replace energy cost is R million dollars per EFPD, the annual saving B1 from the additional generated electricity will be:
B1 = ACP* R*365 = (2 - )*R*365 (3-4)
Te
To
Assume that the cost for an outage is E million dollars, i.e., the saving from the elimination of one outage is E million dollars. If the plant cycle length is extended from current To days to Te days, the effective annual saving B2 from the elimination of outage is given by
365 365
B2 = ( - )* E . (3-5)
To
Te
In this thesis, the value of E will be taken as 15 million dollars. This number is an average value of current industrial experience.
3.4 Net Benefit of Operating Cycle Extension
Subtracting the extra cost from the benefits will yield the net benefit of operating cycle extension. i.e.,
NB = B, + B
2-
C
(3-6)
Combining equations (3-1) to (3-5), the net benefit NB can be formulated as: 1) Constant extra fuel cost model:
NB= (e )* R*365+( 1 )*E-M (3-7)
Te
T
oT
0Te
2) Linear extra fuel cost model:
O 0 1 1 T-T
NB= (e )* R*365 +( 1)* E Te-T *M (3-8)
In this thesis, the economic feasibility of the operating cycle extension project is analyzed for both the constant cost and linear cost models.
To simplify the analysis without changing the nature of the problem, assume that the total number of outage days, which includes planned outages and unplanned outages, in an extended cycle is the same as in a current plant cycle. Some may argue that there would be more forced outages for a plant running on a longer cycle. This may be true. However, one of the goals of this research is to develop a methodology for applying advanced technology to improve the availability of components, thus reducing plant forced outages as much as possible. On the other hand, refueling outages are more easily kept at the same length, and even shortened, by better refueling outage management and by maximizing the percentage of maintenance which is performed on-line. Thus the goal of keeping total outage length unchanged is achievable.
The cost to improve component availability has the same trend as that to increase plant capacity factor. Improvement of component availability over a certain value will incur an unrecoverable cost. Work done by the MIT research group suggests that there are probably a number of components for which surveillance interval extension is not prudent because of the excessive cost. Based on this consideration, the mid-cycle outage concept is introduced. The plant plans to shut down between two refueling outages for a short time to conduct essential preventive maintenance and surveillance testing for components with poor performance history. This mid-cycle outage still realizes the benefit of not removing the reactor vessel head.
The net benefits of extending plant cycle length without a mid-cycle outage and with a mid-cycle outage are both calculated in this thesis. All these analyses are to investigate the economic feasibility of extending the operating cycle length under the basic conditions and goals as follows:
* Extra fuel cost: 1) 20 million dollars per year regardless the extended cycle length; 2) linear increase with the extended cycle length, from zero on current cycle length to 20 million dollars per year for a 48 month cycle length;
* Replacement Energy Cost: 2.5 cent/KwHr, i.e., $0.7 million/EFPD for a 1150 MW plant;
* Saving from elimination of outages: 15 million dollars per outage.
And the basic goal of the project is to achieve a 48-month operating cycle with 30 days refueling outage and maximum 43 days forced outage ( 3% unplanned outage rate) during one cycle.
Chapter 4
RESULTS
AND
CONCLUSIONS
OF
ECONOMIC ANALYSIS
4.1 Introduction
The results of the economic analysis are presented in this chapter. Different extended cycle lengths, different total outage lengths, and different current operating cycle length, will yield different economic favorability. So do the total extra costs and replacement energy cost. All these effects on the economic feasibility of operating cycle extension will be studied first without considering the effect of mid-cycle outage.
The effects of a mid-cycle outage on the plant capacity factor and economics are then studied. Based on the analysis, the maximum allowed mid-cycle outage length can be obtained. The study considering a mid-cycle outage is only for a plant with an extended cycle length of 48 months, since for shorter cycle length extensions, a mid-cycle outage may be not necessary.
Every study in this chapter includes cases based on the constant extra cost and the linear extra cost models. As discussed in Chapter three, the results based on these two models represent the extreme boundaries of the possible economic trends for operating cycle extension.
4.2 Net Benefits of Extending Plant Cycle Length Without Considering a
Mid-Cycle Outage
In this section, some comparisons of net benefits as affected by different factors are presented. The effects of extended plant cycle length, total outage length, current operation cycle length, total extra cost and the replacement energy cost will be discussed. 4.2.1 Effects of Extended Plant Cycle Length
A. Constant Extra Cost Model
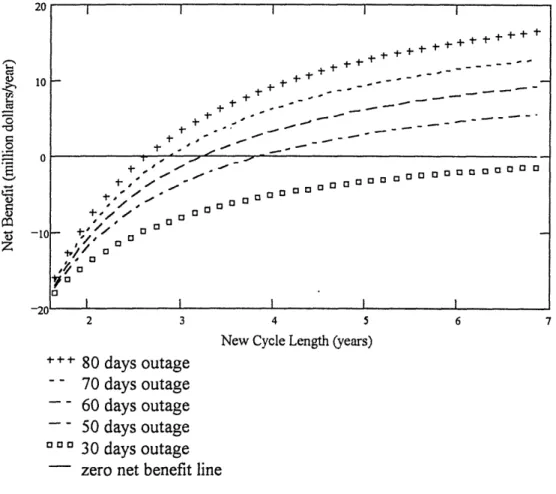
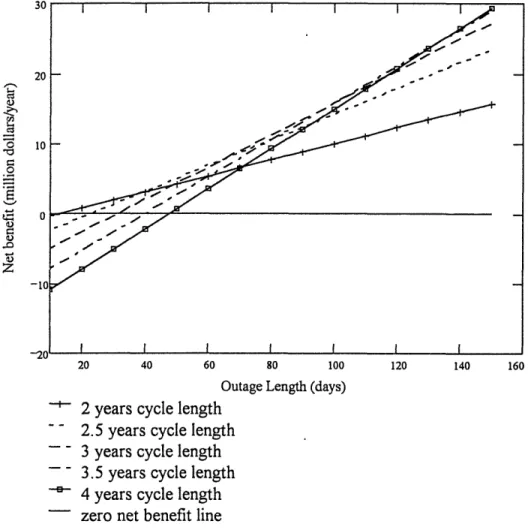
If the extra cost is assumed to be constant, for a plant currently on an 18 month cycle, the net benefit of an extended fuel cycle as a function of the cycle length and outage length is shown in Figure 4.1. In this figure, the replacement electricity cost per EFPD is taken as 0.7 million dollars, i.e. 2.5 cents per KwHr for a 1150 MW plant, which is a typical electricity replacement price. The total added cost (mostly from extra fuel cost) is taken as 20 million dollars per year, and saving from elimination of outages is $15 million per outage.
It is found that the longer the cycle is extended, the greater the net benefit gained. If the total outage length is longer, the effect is more significant. The line with the symbol "+" represents a plant with an 80 day outage, which is a typical value for current US practice. This line shows a sizable net benefit from extending the cycle length to 4 years even though there is negative net benefit for extending cycle length to 2 years. The MIT research group has been told by some utility representatives that there was little motivation to drive current 12 or 18 month cycles to 24 month cycles because there was no real economic benefit. Figure 4.1 suggests that a two year cycle extension is too
modest to get economic benefits, while a more ambitious goal of four year cycles could lead to significant benefits (under a constant scenario).
2 3
+ + 80 days outage 70 days outage -- 60 days outage - - 50 days outage
aa0 30 days outage - zero net benefit linc
4 5
New Cycle Length (years)
Figure 4.1 Net Benefit v/s Cycle Length For Various Outage Lengths (Constant Extra Cost, Current Cycle Length: 18 Months)
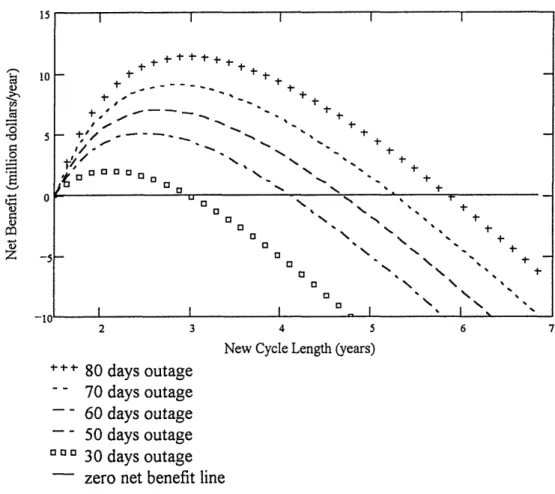
B. Linear Extra Cost Model
If the extra cost is considered as linearly changing with the extended cycle length, the net benefit of the operating cycle length extension is shown in Figure 4.2. For a plant with total outage length of 80 days, its optimal cycle length is about three years. The shorter the plant total outage length, the shorter the optimal cycle length. For a plant with
SI I +
+++
~+
+ 4 -1- - - -l-- _ -+ -I- -1- 7 "! -s / -.-' Ile, 00 0 0 0 000. 13 13 3 ID 0 0 0D0 Do
°~ +/ •of0 E 0/ y0f 0 ~ I I Icurrent total outage longer than 50 days, extending the operating cycle length to four years is still economically profitable if the total outage length is maintained at 50 days.
15 St t t + + S10 d t +s -6 0dy -o--tag ,5ds a ++ S 30 dy ," o -I-o + -Cosa E \CoMoe o \ + - -2 3 4 5 6 7
New Cycle Length (years)
+ + 80 days outage
- - 70 days outage
- - 60 days outage - - 50 days outage
... 30 days outage zero net benefit line
Figure 4.2 Net Benefit v/s Cycle Length For Various Outage Lengths (Linear Extra Cost, Current Cycle Length: 18 Months)
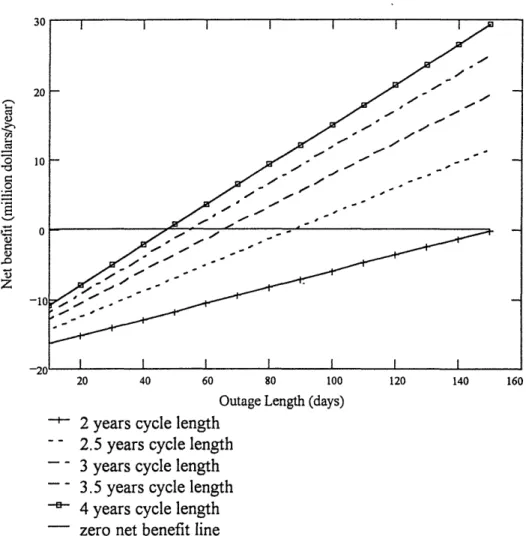
4.2.2 Effects of Total Outage Length A. Constant Extra Cost Model
As described in Chapter three, the total outage length in an extended cycle is assumed to remain the same as the current total outage length in a current cycle. Figure 4.3 shows the relationship of the total outage length to the net benefit of extending the
cycle length. It is found that the extension of the operating cycle length is more economically profitable if the total outage length is longer. As shown in the figure, an extension to a four year cycle can yield a net benefit even though the current total outage is very short, while an extension to two years can achieve a benefit only if the current outage length is relatively long.
20 40 60 80 100
Outage Length (days) 2 years cycle length
2.5 years cycle length 3 years cycle length
3.5 years cycle length 4 years cycle length zero net benefit line
120 140 160
Figure 4.3 Net Benefit v/s Outage Length For Various Cycle Lengths (Constant Extra Cost, Current Cycle Length: 18 Months)
-3--B. Linear Extra Cost Model
The effect of the total outage length using the linear extra cost model is shown in Figure 4.4. The results based on the linear extra cost assumption are in contrast to the results based on the constant extra cost model. To make the operating cycle extension profitable, the shorter total outage length requires shorter extended cycle length. However, if the total outage is longer than 70 days, the short cycle length extension to two years is no longer the most economically favorable, and if the total outage is very
0
z
20 40 60 80 100 120 140 160
Outage Length (days) - 2 years cycle length
2.5 years cycle length - - 3 years cycle length -- 3.5 years cycle length
4 years cycle length zero net benefit line
Figure 4.4 Net Benefit v/s Outage Length For Various Cycle Lengths (Linear Extra Cost, Current Cycle Length: 18 Months)
long, such as longer than 120 days, the longer extended cycle length shows more economic favorability.
4.2.3 Effects of Current Operation Cycle Length A. Constant Extra Cost Model
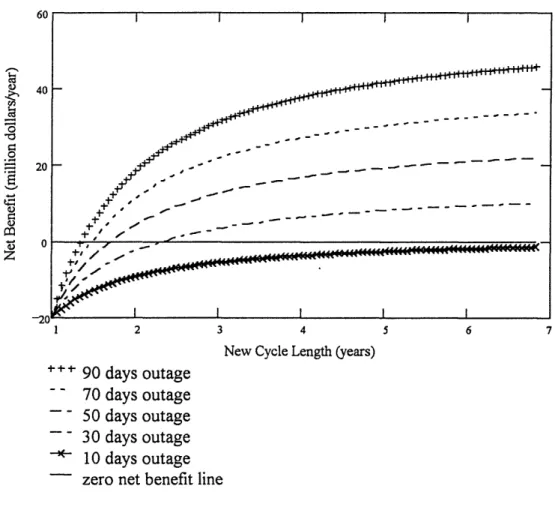
Figure 4.5 represents plants currently with 12 month cycles and the same parameters as those in section 4.2.1 ($0.69 million/EFPD of replacement energy cost, $15 million/outage of saving, and $20 million/year of extra cost). In Figure 4.5, a more
1 2 3 4 5 6
New Cycle Length (years) " 90 days outage
70 days outage - - 50 days outage - - 30 days outage - 10 days outage
zero net benefit line
Figure 4.5 Net Benefit v/s Cycle Length For Various Outage Lengths (Constant Extra Cost, Current Cycle Length: 12 Months)
significant effect of extension of cycle length is shown. For plants with 12 month cycles, extending the cycles to four years can be profitable even if the total outages which can be achieved are as short as 10 days. This is an interesting point for those utilities inclined to remain in a 12 month cycle and put their efforts into driving the outage length shorter. B. Linear Extra Cost Model
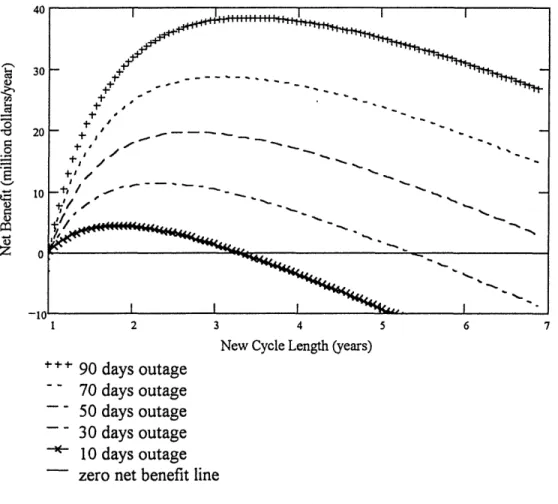
Using the linear extra cost model, the net benefit of extending the operating cycle length of a plant which is currently operated on a 12-month cycle is shown in Figure 4.6. Comparing with the economics of a plant with 18 month cycle, extending the operating
c0 4) 4. 4.)
z,
I 2 3 4 5 6 7New Cycle Length (years) 90 days outage
70 days outage - 50 days outage -- 30 days outage - 10 days outage
zero net benefit line
Figure 4.6 Net Benefit v/s Cycle Length For Various Outage Lengths (Linear Extra Cost, Current Cycle Length: 12 Months)
cycle length of a plant on a 12-month cycle shows stronger favorability. The optimal cycle lengths are longer, and almost four years if the total outage is 90 days.
4.2.4 Effects of Total Extra Costs A. Constant Extra Cost Model
If the total extra cost of extending the fuel cycle length to four years is more than the assumed 20 million dollars per year, cycle extension may be still attractive. Figure 4.7
shows the net benefit of extending the operating cycle length of a current 18-month cycle plant assuming the total extra cost of extending the plant cycle to four years is 25 million
-10 2 3 80 days outage 70 days outage 60 days outage 50 days outage 30 days outage zero net benefit line
4 5
New Cycle Length (years)
Figure 4.7 Net Benefit v/s Cycle Length
(Constant Extra Cost, Current Cycle length: 18 months, Total Added Cost: $ 25 Million/year)
_ r+ .i..i1-- .- --"- "- I -- + -++ S -I--. s - .""" + 1 13' 0 OEOO~OOOOOOOO -, 00 D - ° I I I I I 1-4.1 000l Jv
dollars per year. It is found in Figure 4.7 that there is still a net benefit for extending cycle length to four years.
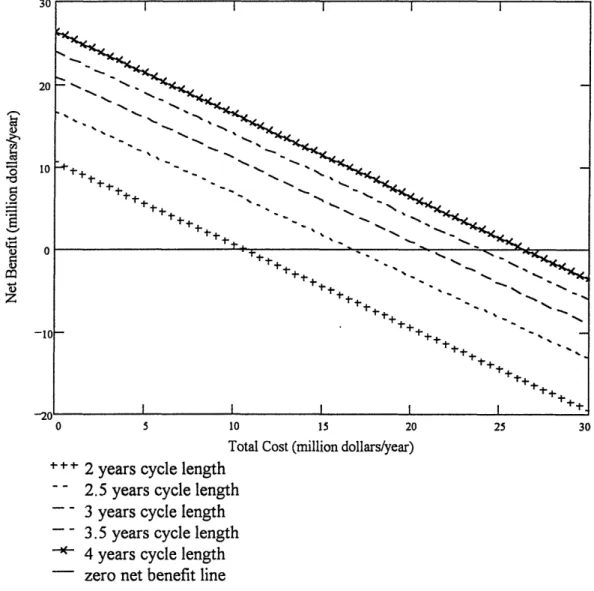
Figure 4.8 also shows the effect of different total extra cost for extending the operating cycle length of a plant with a 70-day total outage per cycle from 18 months to 48 months. Net benefit decreases while total extra cost goes up. But the longer the cycle,
4-) I.-0 4) 4) 4)
z
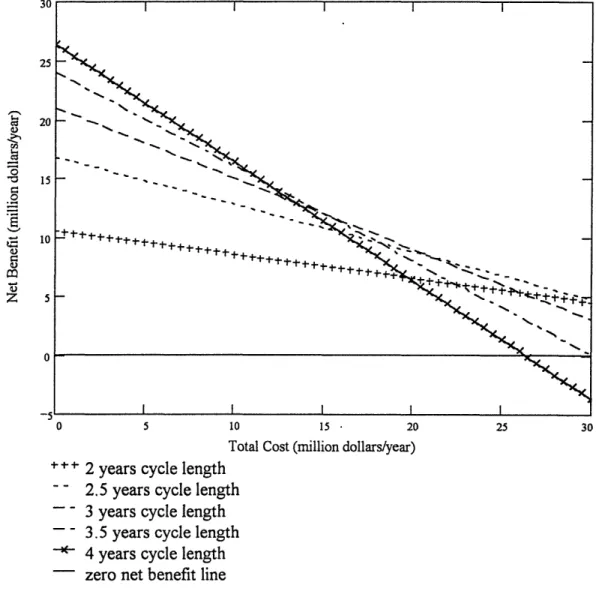
0 5 10 15 20 25 30Total Cost (million dollars/year)
+ 2 years cycle length - 2.5 years cycle length - - 3 years cycle length - - 3.5 years cycle length
4 years cycle length zero net benefit line
Figure 4.8 Effect of Total Cost For Various Cycle Lengths (Constant Extra Cost, Current Cycle Length: 18 months,
the more the expense which can be tolerated. If the cycle length is extended to four years, an extra cost of 27 million dollars per year can be offset.
B. Linear Extra Cost Model
Using the linear extra cost model, the net benefit for various extended cycle length is shown in Figure 4.9 assuming that the extra cost is 25 million dollars for extending the cycle length from the current 18 months to 48 months. As shown in the figure, if the total outage is longer than 65 days, extending the cycle length to four years still can achieve a positive net benefit, even though the optimal cycle lengths are less than three years.
10 "- 5 "d 0 0
E!
S-5 )Z-z-
1 I I I I I + +++ + + f+" - , , -. i + +f S%•N -t-* N . 0 a N N. + % \ \ % ++ a \ \ % % % % + + + a + a + 2 3 4 5 6 7New Cycle Length (years) . 80 days outage
- 70 days outage - 60 days outage -- 50 days outage
a"" 30 days outage zero net benefit line
Figure 4.9 Net Benefit v/s Cycle Length (Linear Extra Cost, Current Cycle length: 18 months,
Comparing with Figure 4.2, in which the extra cost for extending the cycle to 48 months is 20 million dollars, it can be concluded that the economics of the cycle length extension is sensitive to the extra cost.
This conclusion can be supported by the results shown in Figure 4.10. Figure 4.10 shows how the net benefits change with the nominal extra cost for extending the cycle to
-o 0 o U U m z 0 5 10 15 - 20 25 30
Total Cost (million dollars/year)
+ 2 years cycle length
- - 2.5 years cycle length
- - 3 years cycle length - - 3.5 years cycle length
- 4 years cycle length zero net benefit line
Figure 4.10 Effect of Total Cost For Various Cycle Lengths (Linear Extra Cost, Current Cycle Length: 18 months,
four years. It is found that the net benefit of the operating cycle length extension is sensitive to this nominal value and the sensitivity increases if the cycle length is extended longer.
4.2.5 Effects of Replacement Energy Cost
The effects of replacement energy cost per EFPD on net benefit are shown in Figure 4.11. Net benefit is sensitive to the replacement energy cost per EFPD. The benefit mostly comes from the additional generated electricity. So a small change in the price of electricity will yield a large change in the net benefit. This point is interesting because the price of electricity is region-dependent. That means that the net benefit of extending plant
-10 2 4 $0.3 million/EFPD $0.5 million/EFPD $0.7 million/EFPD $0.9 million/EFPD zero net benefit line
6
>New Cycle Length (years)
Figure 4.11 Effect of Replacement Energy Cost per EFPD
(Constant Extra Cost, Current Cycle Length: 18 months, Outage length: 70 days)
I/ -t *1 X1 LL· I, r /' / X*
+:
LU 0 --=•C r · + +"-., I " 1- --'-cycle length has a regional dependency. Figure 4.11 also shows that there will be no benefit if the replace energy cost is too small, as in the case of $0.3 million per EFPD, equal to about 1 cent per KwHr for a 1150 MW plant.
B. Linear Extra Cost Model
Using the linear extra cost model, the sensitivity of net benefit to the replacement energy cost is shown in Figure 4.12. It is also found that there will be little net benefit if the replacement energy cost is too small. In order to establish the economic feasibility of operating cycle length extension, an accurate value for the replacement energy cost must be obtained. v,.. 1.--oO 0 o Z
z
00 2 4 6 8 10 12New Cycle Length (years) -" $0.3 million/EFPD
- $0.5 million/EFPD - $0.7 million/EFPD - $0.9 million/EFPD zero net benefit line
Figure 4.12 Effect of Replacement Energy Cost per EFPD
4.3 Effects of Mid-Cycle Outage
The outage length considered in section 4.2 is the total outage length. For a more detailed analysis, outage days can be broken into three categories: Refueling outage, Unplanned (Forced) outage, and Mid-cycle outage. The effects of these three categories of outages on plant capacity factor and net economic benefit will be discussed in this section.
4.3.1 Effects on Plant Capacity Factor
0.95 0.85 0.8 -" - 13-10 20 30
Mid-Cycle Outage Length (Days) Unplanned outage 40 days
Unplanned Outage 80 days Unplanned Outage 120 days Unplanned Outage 160 days Unplanned Outage 200 days Current Capacity Factor
Figure 4.13 Effect on Capacity Factor of Mid-Cycle Outage For Various Unplanned Outage Lengths
(Refueling Outage: 30 days, Current total outage: 80 days, Current cycle length: 18 months, Extended cycle length: 48 months)
= - - - ..
= -
Figure 4.13 shows the effect of mid-cycle outage lengths on plant capacity factor, for a range of unplanned outage lengths. The refueling length is fixed at 30 days per cycle and the cycle length is assumed to have been extended to four years. Compared with the current 18 month cycle with a 80 day total outage, a four year cycle with a mid-cycle outage up to 50 days in length is competitive in terms of plant capacity factor even though the unplanned outage is as high as 120 days. However, only comparing to the current state in terms of capacity factor is not sufficient, because it doesn't take into account the
-5
0
Z 0 -51(
0 10 20 30 40 50
Mid-Cycle Length (Days) "< Unplanned outage 20 days
- Unplanned Outage 60 days - - Unplanned Outage 60 days -- Unplanned Outage 80 days Unplanned Outage 100 days Zero Benefit Line
Figure 4.14 Effect on Net Benefit of Mid-Cycle Outage Length For Various Unplanned Outage Lengths
(Refueling Outage: 30 days, Current total outage: 80 days, Current cycle length: 18 months, Extended cycle length: 48 months)
I I I I
I
- - -=