HAL Id: hal-01304165
https://hal.sorbonne-universite.fr/hal-01304165
Submitted on 19 Apr 2016
HAL is a multi-disciplinary open access
archive for the deposit and dissemination of sci-entific research documents, whether they are pub-lished or not. The documents may come from teaching and research institutions in France or
L’archive ouverte pluridisciplinaire HAL, est destinée au dépôt et à la diffusion de documents scientifiques de niveau recherche, publiés ou non, émanant des établissements d’enseignement et de recherche français ou étrangers, des laboratoires
A neural network-based method for merging ocean color
and Argo data to extend surface bio-optical properties
to depth: Retrieval of the particulate backscattering
coefficient
R. Sauzède, Hervé Claustre, J. Uitz, C. Jamet, G. Dall’Olmo, F. d’Ortenzio,
B. Gentili, A. Poteau, C. Schmechtig
To cite this version:
R. Sauzède, Hervé Claustre, J. Uitz, C. Jamet, G. Dall’Olmo, et al.. A neural network-based method for merging ocean color and Argo data to extend surface bio-optical properties to depth: Retrieval of the particulate backscattering coefficient. Journal of Geophysical Research. Oceans, Wiley-Blackwell, 2016, �10.1002/2015JC011408�. �hal-01304165�
A neural network-based method for merging ocean color and
Argo data to extend surface bio-optical properties to depth:
Retrieval of the particulate backscattering coefficient
R. Sauzède1, H. Claustre1, J. Uitz1, C. Jamet2, G. Dall’Olmo3,4, F. D’Ortenzio1, B.
Gentili1, A. Poteau1and C. Schmechtig1
[1]{Sorbonne Universités, UPMC Univ Paris 06, CNRS, Observatoire Océanologique de Villefranche (OOV), Laboratoire d’Océanographie de Villefranche (LOV), 181 Chemin du Lazaret, 06 230 Villefranche-sur-Mer, France.}
[2]{Laboratoire d’Océanologie et de Géosciences, UMR8187, ULCO/CNRS, Wimereux, France}
[3]{Plymouth Marine Laboratory, Plymouth, UK}
[4]{National Centre for Earth Observation, Plymouth, UK} Correspondence to: R. Sauzède ([email protected])
Corresponding author: R. Sauzède, Laboratoire d’Océanographie de Villefranche, CNRS, UMR7093, Villefranche-Sur-Mer, France. ([email protected])
Research Article Journal of Geophysical Research: Oceans DOI 10.1002/2015JC011408
This article has been accepted for publication and undergone full peer review but has not been through the copyediting, typesetting, pagination and proofreading process which may lead to
Key points:
A neural network is developed to infer the vertical distribution of the backscattering coefficient
The neural network requires as input Argo T/S profiles and ocean color remote sensing products
Validation of the method is highly satisfactory which supports its application to the global ocean
Abstract
The present study proposes a novel method that merges satellite ocean-color bio-optical products with Argo temperature-salinity profiles to infer the vertical distribution of the particulate backscattering coefficient (bbp). This neural network-based method (SOCA-BBP
for Satellite Ocean-Color merged with Argo data to infer the vertical distribution of the Particulate Backscattering coefficient) uses three main input components: (1) satellite-based surface estimates of bbp and chlorophyll a concentration matched-up in space and time with
(2) depth-resolved physical properties derived from temperature-salinity profiles measured by Argo profiling floats and (3) the day of the year of the considered satellite-Argo matchup. The neural network is trained and validated using a database including 4725 simultaneous profiles of temperature-salinity and bio-optical properties collected by Bio-Argo floats, with concomitant satellite-derived products. The Bio-Argo profiles are representative of the global open-ocean in terms of oceanographic conditions, making the proposed method applicable to most open-ocean environments. SOCA-BBP is validated using 20% of the entire database (global error of 21%). We present additional validation results based on two other independent datasets acquired (1) by four Bio-Argo floats deployed in major oceanic basins,
not represented in the database used to train the method; and (2) during an AMT (Atlantic Meridional Transect) field cruise in 2009. These validation tests based on two fully independent datasets indicate the robustness of the predicted vertical distribution of bbp. To
illustrate the potential of the method, we merged monthly climatological Argo profiles with ocean color products to produce a depth-resolved climatology of bbp for the global ocean.
Key words: Particulate backscattering coefficient, ocean color, Argo profiling float,
1 Introduction
The ocean plays an important role in the regulation of the climate of our planet by influencing the amount of carbon dioxide (CO2) in the atmosphere. An important part of this regulation
takes place through the so-called biological carbon pump, which results from the sinking and sequestration to the deep oceans of part of the stock of Particulate Organic Carbon (POC) produced by phytoplankton photosynthesis [Falkowski et al., 1998; Volk and Hoffert, 1985]. Despite their importance to the global carbon cycle, these processes are still poorly constrained. This is largely caused by a lack of observations of key biogeochemical properties and associated processes on relevant space and time scales. Traditional ship-based sampling and measurement methods provide direct, detailed information on biogeochemical properties of the water column, but with insufficient space-time coverage.
Recent advances in optical sensors implemented on in situ and remote-sensing platforms allow the study of biogeochemical variables and processes in the open ocean over a broad range of temporal and spatial scales. The increasing use of such optical tools has led the scientific community to develop optical proxies for estimating key biogeochemical parameters. Specifically the particulate backscattering coefficient and the particulate beam attenuation coefficient are widely used as proxies of POC [Bishop and Wood, 2009; Bishop, 2009; Gardner et al., 2006]. The particulate backscattering coefficient (bbp) has received
much attention in the recent years because it can be continuously measured in situ from autonomous platforms [e.g. Boss and Behrenfeld, 2010; Boss et al., 2008; Dall’Olmo and
Mork, 2014] or retrieved from satellite remote-sensing of ocean color [Behrenfeld et al., 2005; Siegel et al., 2005; Westberry et al., 2008]. Aside from being a relevant proxy of POC [Balch et al., 2001; Cetinić et al., 2012; Loisel et al., 2001, 2002; Stramski et al., 1999, 2008], this
dependence as an index of particle size [e.g. Dall’Olmo and Mork, 2014; Loisel et al., 2006] and phytoplankton size structure [Kostadinov et al., 2010]. Although still debated, several recent studies have shown that bbp could also be considered as an indicator of phytoplankton
carbon [Behrenfeld et al., 2005; Graff et al., 2015; Martinez-Vicente et al., 2013]. This would make bbp an interesting alternative to chlorophyll a concentration for monitoring
phytoplankton biomass in situ or from space. Therefore bbp appears as a key bio-optical
property to study the space-time dynamics of POC and possibly of phytoplankton biomass, a prerequisite for ultimately improving the characterization and quantitative assessment of biologically mediated carbon fluxes in the global open ocean.
Satellite remote sensing of ocean color, coupled to relevant algorithms, has the potential to provide a quasi-synoptic view of bbp which, in turn, can be interpreted in terms of POC
[Loisel et al., 2001, 2002; Stramski et al., 1999, 2008]. We note that satellite-derived products of POC may also be obtained from reflectance- or beam attenuation-based algorithms [e.g.
Gardner et al., 2006; Stramski et al., 2008]. Several studies have used this potential to
examine the spatial and temporal distribution of POC in the open ocean [Gardner et al., 2006;
Loisel et al., 2002; Stramska, 2009]. However, such satellite-based estimates are restricted to
the ocean surface layer and, in the context of global carbon cycle studies including carbon production and export, are insufficient. In fact, the photosynthetic activities of phytoplankton are not restricted to the near-surface layer but also to deeper layers in the water column. Moreover, POC, which is vector of carbon export, is also composed of biogenic detrital particles, microzooplankton, heterotrophic bacteria, viruses and aggregates that are present within the entire water column in various proportions. So the vertical distribution of POC is important for understanding both pelagic ecosystems and carbon flux. The high spatial and temporal variability of the vertical distribution of POC makes the extension of surface POC to
depth complex. To our knowledge, this has been attempted only by Duforêt-Gaurier et al. [2010] who based their study on a relatively small database of POC vertical profiles.
Because bbp is tightly linked to the stock of biologically derived carbon (POC), its vertical
distribution must be in some way driven by nutrient availability and light regime, which are in turn influenced by the physical forcing of the water column. Hence, one may expect that combining the satellite-derived surface data of bbp with available information on the physical
state of the water column will help extending surface bbp to depth and constraining its vertical
distribution. Since the launch of the Argo program, temperature and salinity profiles are measured continuously with high spatio-temporal resolution throughout the world’s oceans [Roemmich et al., 2009]. Now mature, with more than 3800 active floats, the Argo array provides a unique high-resolution view of hydrological properties in the upper 2000 m of the ocean. These data represent an ideal candidate for merging with satellite ocean color products. Therefore, in this study, we propose to develop and examine the potential of a new global method for merging satellite ocean color and physical Argo data to infer the vertical distribution of bbp with a relatively high spatio-temporal resolution, i.e. the resolution of
Argo-to-satellite matchup data.
In the past few years, the number of concurrent in situ observations of the vertical distributions of temperature, salinity and bbp has dramatically increased. This results from the
integration of optical sensors on autonomous platforms, especially Bio-Argo profiling floats which almost all measure bbp [Boss et al., 2008; Claustre et al., 2010a, 2010b; Mignot et al.,
2014; Xing et al., 2014] in addition to physical vertical profiles of temperature and salinity. Hence the numerous vertical profiles collected by Bio-Argo floats offer a new path for developing a global parameterization of the vertical distribution of this key bio-optical property. Our study aims to use the large database of physical and bio-optical vertical profiles
collected by the Bio-Argo fleet within the global open ocean to establish the proposed method.
Artificial neural networks (ANNs) are very powerful methods for approximating any differentiable and continuous functions [Hornik et al., 1989] and have been widely used for biogeochemical, geophysical and remote sensing applications [e.g. Bricaud et al., 2007;
Friedrich and Oschlies, 2009; Gross et al., 2000; Jamet et al., 2012; Krasnopolsky, 2009; Niang et al., 2006; Palacz et al., 2013; Raitsos et al., 2008; Sauzède et al., 2015; Telszewski et al., 2009]. These methods have a large potential to model complex and nonlinear relationships
that are characteristic of ecological datasets [Lek and Guégan, 1999]. Furthermore, one of the benefit of using ANNs is that uncertainties in input data are accounted for during the training process of the neural network. Indeed, ANNs are relatively insensitive to reasonable uncertainties in input data. Therefore, we selected this method as the most appropriate for reaching our goal.
In summary, this study presents a new ANN-based method that uses merged satellite ocean color-based products and physical Argo data to retrieve the vertical distribution of bbp at the
global scale. Hereafter the method is referred to as SOCA-BBP for Satellite Ocean Color merged with Argo data to infer the vertical distribution of the Particulate Backscattering coefficient. SOCA-BBP uses three main input components: (1) a surface component composed of satellite-based estimates of bbp and chlorophyll a concentration, (2)
vertically-resolved physical quantities derived from Argo temperature and salinity profiles, and (3) the day of the year of the considered satellite-to-Argo matchup. Our analysis utilizes a large database of 4725 concurrent in situ vertical profiles of temperature, salinity and bbp collected
resulting database is representative of various trophic conditions, making the method largely applicable to the global open ocean.
2 Data presentation and processing
Below we present the Bio-Argo database used in this study, which is composed of concurrent vertical profiles of temperature, salinity and particulate backscattering coefficient. Then we present the procedure for matching up the Bio-Argo vertical profiles with satellite-based bio-optical products. We finally describe the resulting database used to develop and validate the SOCA-BBP algorithm.
2.1 Database of concurrent vertical profiles of temperature, salinity and particulate backscattering coefficient
In addition to the standard conductivity-temperature-depth (CTD) sensors mounted on physical Argo profiling floats, Bio-Argo floats are equipped with additional bio-optical sensors that can be used to measure proxies of major biogeochemical variables. Specifically, the Bio-Argo floats are fitted with a CTD (Seabird); a sensor package (Satlantic OCR) that measures downwelling irradiance at three wavelengths and PAR (Photosynthetically Available Radiation); and a sensor package (WET Labs ECO Puck Triplet) composed of a chlorophyll a fluorometer, a CDOM (Colored Dissolved Organic Matter) fluorometer and a sensor measuring the particulate backscattering coefficient at a wavelength of 700 nm (79 floats) or 532 nm (4 floats). In the present study, we use exclusively measurements of temperature, salinity and particulate backscattering coefficient to train and validate the method.
The Bio-Argo floats used in this study typically collect measurements from 1000 m to the surface with a ~1 m resolution every 10 days, 3 days, or even three times per day depending on the float mission configuration. When the float surfaces, data are transmitted in real time
using Iridium communication. Thanks to this communication system the float mission parameters can also be modified in real time (e.g. time interval between two profiling cycles). The volume scattering function (VSF), β(θ,𝜆) (m-1 sr-1), is defined as the angular distribution
of scattering relative to the direction of light propagation θ at the optical wavelength 𝜆. The backscattering sensor of Bio-Argo floats measures β(124°, 𝜆) with 𝜆 = 700 nm or 532 nm. The contribution of particles to the VSF, βp, is calculated by subtracting the contribution of
pure seawater, βsw, from β(124°, 𝜆): ) , 124 ( ) , 124 ( ) , 124 ( p sw . (1)
with βsw depending on temperature and salinity and computed using a depolarization ratio of
0.039 [Zhang et al., 2009]. Then, the particulate backscattering coefficient at 700 or 532nm, bbp(𝜆), is determined from βp(124°, 𝜆) and a conversion factor, χ, [Boss and Pegau, 2001; Kokhanovsky, 2012; Sullivan and Twardowski, 2009] as follows:
)) , 124 ( ) , 124 ( ( 2 ) ( sw bp b . (2)
The value of χ for an angle of 124° is 1.076 [Sullivan and Twardowski, 2009].
As the Bio-Argo database includes ten times more bbp(700) profiles than bbp(532) profiles, in
order to harmonize the bbp profiles of the database, the profiles of bbp(532) were converted to
bbp(700). The conversion was performed using a power law model of the particulate
backscattering coefficient spectral dependency: 0 0) ( ) ( bp bp b b . (3)
We use a value of 𝛾=2 for the Bio-Argo profiles collected in the North Pacific subtropical gyre and a value of 𝛾=3 for those collected in the South Pacific Subtropical Gyre. These values are based on Loisel et al., [2006] who showed that the low chlorophyll waters of the
subtropical gyres are typically associated with high 𝛾 values (between 2 and 3) whereas low or even negative 𝛾 values are found in the more productive areas of the ocean (between -1.5 and 1). The CTD data were quality controlled following the standard Argo protocol [Wong et
al., 2014]. A quality control procedure was applied to each profile of bbp(700) (hereafter bbp;
see Table 1 for a list of symbols): (1) the manufacturer-supplied offsets and scaling factors were applied to each raw profile; (2) high-frequency spikes were removed using a median filter; (3) bbp values above 0.03 m-1 were discarded as considered outside of the sensor range
of operation. The final Bio-Argo database of concurrent bbp and temperature-salinity
measurements is composed of 8330 vertical profiles collected by 83 Bio-Argo profiling floats.
2.2 Bio-Argo and satellite ocean color matchup database
For consistency with Bio-Argo bbp data measured at (or converted to) 700 nm, the
satellite-derived bbp data were estimated for a wavelength of 700 nm using the Quasi-Analytical
Algorithm [QAA, Lee et al., 2002]. Then, each profile of the Bio-Argo database described above was matched up with satellite data of surface bbp(700) and chlorophyll a concentration
(Chl) using the closest pixel from standard level 3 8-day MODIS-Aqua composites (Reprocessing R2014.0) with a 9-km resolution (provided by the OceanColor Web: http://oceancolor.gsfc.nasa.gov).
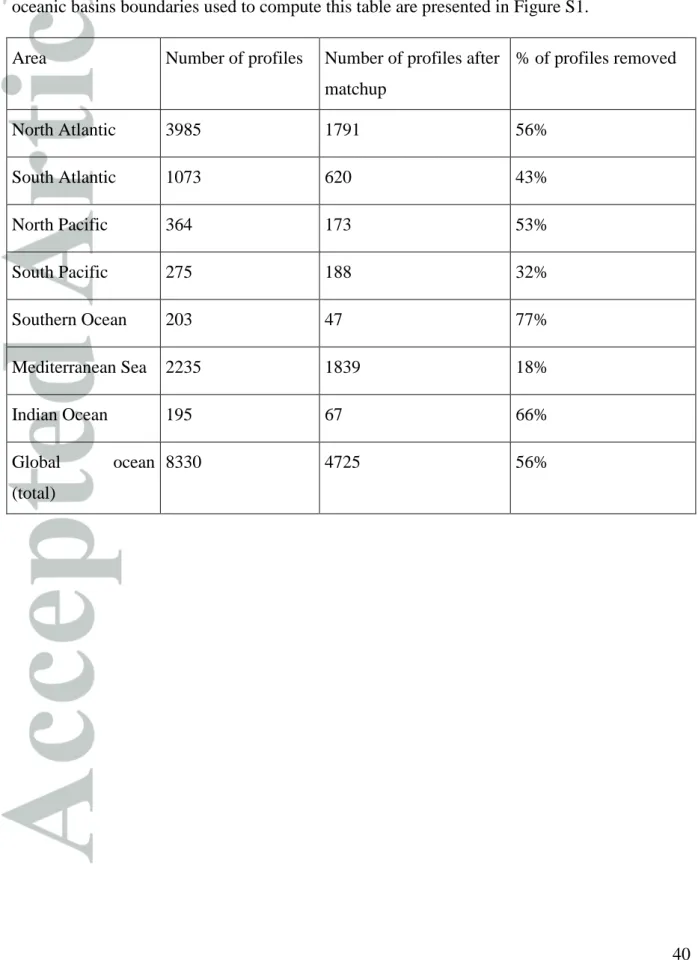
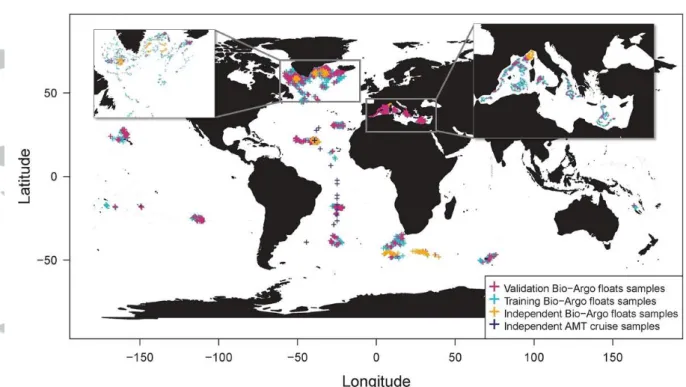
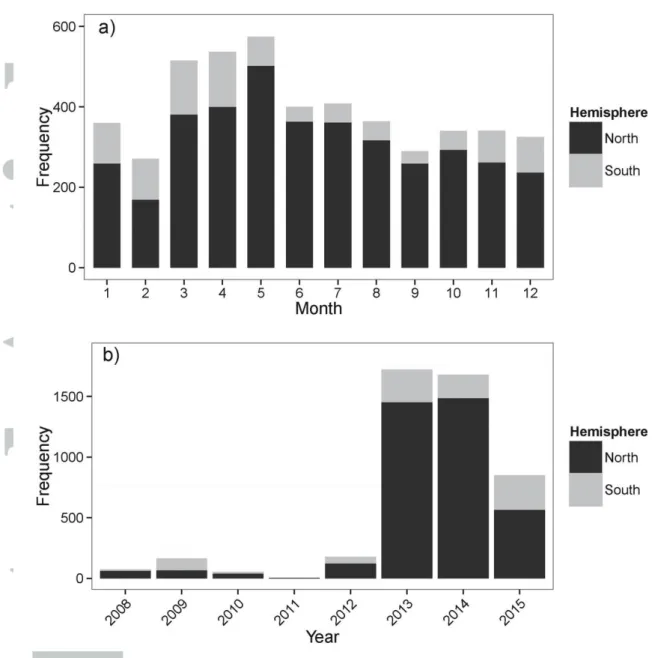
The matchup procedure led to discarding 43% of the profiles from the initial Bio-Argo database (see discarding rate for the major oceanic basins in Table 2). The geographic distribution of the 4725 remaining Bio-Argo profiles with concomitant MODIS-Aqua-derived products is presented in Figure 1. The database used in this study covers most of the major ocean basins (i.e. Southern Ocean, Indian Ocean, Mediterranean Sea, North Pacific, South Pacific, North Atlantic and South Atlantic; see Figure S1 for details of basin boundaries). The under-representation of the southern hemisphere, due to under-sampling (see Figure 1), is
apparent in Figure 2. On a monthly basis, more profiles are available for spring and summer than for autumn and winter months for the northern and southern hemisphere (Figure 2a). This temporal bias of data acquisition is mostly due to a lack of satellite images at high latitudes during winter and autumn. The annual distribution of the vertical profiles in the database covers 8 years from 2008 to 2015 (Figure 2b); most of the observations were nevertheless collected since 2013.
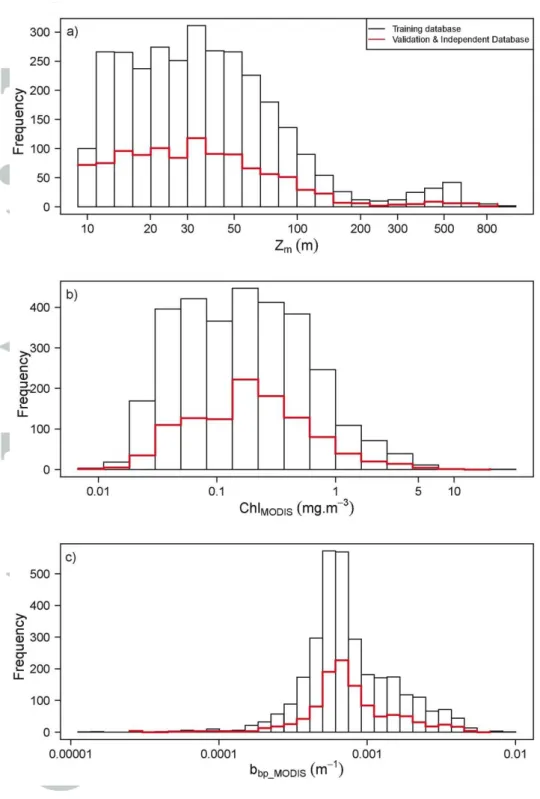
The resulting Bio-Argo and satellite matchup database appears to be representative of a broad variety of hydrological and biogeochemical conditions prevailing in the global open ocean (Figure 3). For instance, the values of mixed layer depth, Zm, acquired by the Bio-Argo floats
vary between 15 and 900 m (measurements from the North Atlantic Subtropical Gyre in spring and the North Atlantic in winter, respectively). Zm is calculated from the density
profiles using a density criterion of 0.03 kg m-3 as in de Boyer Montégut et al. [2004]. The
database is also representative of most trophic conditions observed in the open ocean (i.e. from oligotrophic to eutrophic waters, see Figure 3b). The MODIS-Aqua-estimated Chl, ChlMODIS, covers 3 orders of magnitude (i.e. from 0.01 to 10 mg m-3). The most oligotrophic
conditions were found in the South Atlantic Subtropical Gyre in autumn and the most eutrophic in the North Atlantic, especially in the Labrador Sea during the spring bloom. Similarly, the MODIS-Aqua-derived bbp, bbp_MODIS, covers 3 orders of magnitude (from
0.00001 to 0.01 m-1; Figure 3c).
Before splitting the Bio-Argo and satellite matchup database into two subsets for developing the neural network (i.e. the training and validation datasets), 314 profiles collected by four Bio-Argo floats were removed from the database to create an “independent dataset” used for an additional validation of the method. These four floats were chosen in four major oceanic
basins: the North Atlantic Subpolar Gyre, the North Atlantic Subtropical Gyre, the Southern Ocean and the Mediterranean Sea.
The resulting matchup database was randomly split into two independent subsets, including 80% (3525 profiles used for training the MLP) and 20% (886 profiles used for validating the MLP) of the data. Similar to the training dataset, the validation dataset is representative of the hydrological and biogeochemical conditions prevailing in the global open ocean (see histograms in Figure 3).
Finally, a totally independent dataset from an AMT (Atlantic Meridional Transect) field cruise in 2009 is also used to validate independently the method (i.e. different bbp sensor,
different time and location of bbp acquisition). This addition validation is done in order to
demonstrate the good generalization of the method (i.e. good performance of the method in other conditions as used for the neural network training). During this AMT cruise, the continuous bbp measurements at 470 and 526 nm were made using a WET Labs ECO-BB3
sensor. The AMT bbp(700) profiles was then computed by linearly combining bbp
measurements at 470 and 556 nm. After matchup, this subset is composed of 16 matchup satellite and in situ profiles of temperature, salinity and bbp.
To summarize, the geographical distribution of the sampling stations included in the training, validation, independent 4-float and totally independent-AMT subsets is shown in Figure 1.
2.3 Normalization of the vertical profiles of the particulate backscattering coefficient
SOCA-BBP is designed to predict the vertical distribution of bbp within the so-called
productive layer. This corresponds essentially to the layer where most particle and phytoplankton stocks are confined. In mixed conditions, the thickness of the productive layer roughly coincides with that of the mixed layer. In stratified conditions (typically associated
with the presence of a deep chlorophyll maximum) the productive layer is more linked to the euphotic layer. Here the productive layer is described through the introduction of a dimensionless depth, 𝜁 [Sauzède et al., 2015], with 𝜁 defined as the geometrical depth, z, divided by a normalization depth, Znorm:
norm Z z
. (4)
with Znorm defined as the depth at which the Chl vertical profile returns to a constant
background value (depth of the bottom of the productive layer). As fluorescence profiles are always collected simultaneously with temperature, salinity and bbp profiles by the Bio-Argo
floats, Znorm can be computed with precision for the Bio-Argo database using the fluorescence
profiles [see Sauzède et al., 2015, for details].
As the main objective of the SOCA-BBP method is to merge satellite and Argo data without using vertical bio-optical profiles acquired by Bio-Argo floats, for application purposes, we developed a statistical relationship to estimate Znorm from two parameters accessible or
derivable from our input dataset: (1) the euphotic layer depth, Ze, the depth at which
irradiance is reduced to 1% of its surface value; and (2) the mixed layer depth, Zm. Ze is
computed with the following procedure: (1) the attenuation coefficient at 490 nm, Kd490, is
determined using the satellite-derived chlorophyll a concentration [Morel and Maritorena, 2001]; (2) the total attenuation coefficient, KPAR, is retrieved from Kd490 [Rochford et al.,
2001]; (3) finally, Ze is retrieved from KPAR using the exponential decrease of light over
depth. The most statistically significant relationship between Znorm and both the Ze and Zm
parameters was found when stratified conditions are discriminated from mixed conditions based on the ratio of Ze to Zm [i.e. Ze > Zm: stratified; Ze < Zm: mixed; Morel and Berthon,
1989; Uitz et al., 2006]. We obtain the following optimal statistical relationships for a stratified water column:
) log( 04 . 1 ) log( 12 . 0 ) log(Znorm Zm Ze . (5)
and for a mixed water column :
) log( 51 . 0 ) log( 64 . 0 ) log(Znorm Zm Ze . (6)
The relationship between Znorm computed from the fluorescence in situ profiles measured by
the Bio-Argo floats and modeled with the statistical relationships presented above for the two hydrological regime of the water column (stratified or mixed) is satisfactory with a median absolute percent difference, MAPD, of 14% (for more details see Figure S2). Finally, Znorm
used to scale bbp profiles ranges from 20 m to 805 m in the Bio-Argo database (see Figure S3).
Scaling the bbp profiles with respect to 𝜁 enables the merging all the profiles regardless of
their vertical shape and range of variation while simultaneously accounting for their variability.
3 SOCA-BBP algorithm development
3.1 General principles of Multi-Layer Perceptron (MLP)
The type of artificial neural network chosen in this study is a Multi-Layer Perceptron [MLP;
Bishop, 1995; Rumelhart et al., 1988]. A MLP is composed of several layers: one input layer,
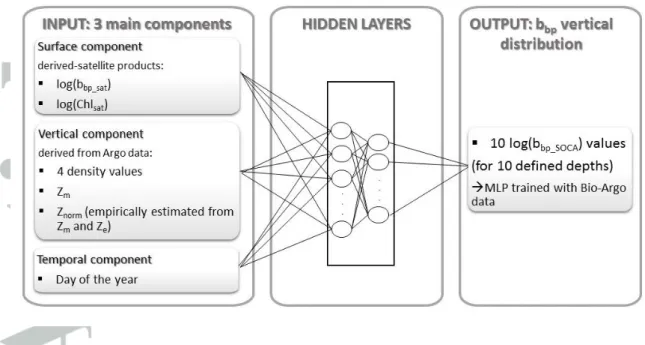
one output layer and one or more intermediate levels (i.e. the so-called hidden layers). Each layer is composed of neurons, which are elementary transfer functions that provide outputs when inputs are applied. Each neuron is interconnected with the others by weights (Figure 4). The matrix of these weight values is iteratively adjusted during the training phase of the MLP and is computed by minimizing a cost function defined as the quadratic difference between the desired and computed outputs. The technique used for this minimization is the back-propagation conjugate-gradient, which is an iterative optimization method adapted to MLP development [Bishop, 1995; Hornik et al., 1989].
To determine the weights of the MLP, the training dataset is randomly split into two subsets (50% of the data each), the so-called “learning” and “test” datasets. These two subsets are used during the training process of the MLP to prevent overlearning [Bishop, 1995]. The validation dataset used to evaluate independently the final performance of the MLP is composed of 20% of the entire initial database.
3.2 Developing a MLP to retrieve the vertical distribution of bbp
After multiple tests, the following set of three input components was selected as optimal (see Figure 4): (1) a temporal component, i.e. the day of year; (2) a surface component, defined by the satellite-derived log-transformed particulate backscattering coefficient (bbp_MODIS) and
chlorophyll a concentration (ChlMODIS) (see Sect. 2.2); and (3) a vertical component, i.e. the
the vertical profile, of which three taken at shallow depths and one at depth. The dimensionless depths according to density inputs were chosen using a principal component analysis to minimize redundancy in the selected input data (not shown). The MLP returns simultaneously 10 normalized values of log(bbp) as output according to ten depths taken at
regular intervals within the 0-1.3 𝜁 layer.
The elementary transfer function (sigmoid nonlinear function) that provides outputs when inputs are applied to the MLP varies within the range [-1;1]. Therefore, to take advantage of the nonlinearity of this function, the inputs and outputs of the MLP (xi,j) are centered and
reduced to match the [-1;1] domain as follows:
) ( ) ( 3 2 , , i i j i j i x x mean x x . (7)
with 𝜎 the standard deviation of the considered input or output variable x. Obviously, the outputs need to be “denormalized” using the above equation with appropriate mean and standard deviation for each dimensionless depth of restitution.
With respect to the temporal component, we applied a specific normalization procedure that accounts for the periodicity of the day of the year (i.e. day one of the year is very similar from a seasonal perspective to day 365). Thus, similar to the method developed by Sauzède et al. [2015], the temporal input is transformed in radians using the following equation:
625 . 182 Day Dayrad . (8)
where Dayrad is the day of the year in radian units and the coefficient 182.625 accounts for
half the number of days per year (365.25).
Once the optimal input and output variables were determined, additional tests were performed to establish the best architecture of the MLP: one or two hidden layers with a number of
neurons in each layer varying between 1 and 50 and 1 and 20, respectively. The architecture with minimum error of validation and minimum number of neurons was selected as optimal. The resulting optimal MLP is here composed of two hidden layers with 8 neurons in the first hidden layer and 6 neurons in the second one. In order to evaluate the MLP robustness, different subsets of the training dataset have been tested and no significant difference in the predictive skills of the MLP was observed.
3.3 Evaluation of method performance
The SOCA-BBP method is validated using independent datasets of bbp profiles acquired by
Bio-Argo floats or as part of an AMT field cruise (see Sect. 2.2). For each profile used for the validation of the method, the 10 bbp values simultaneously retrieved by SOCA-BBP
(bbp_SOCA), associated with the 10 dimensionless depths taken at regular intervals within the
0-1.3 𝜁 layer, are compared to bbp values measured by the Bio-Argo floats (bbp_Floats) or
measured during the AMT cruise (bbp_AMT) at each corresponding depth. To evaluate the
performance of SOCA-BBP in inferring the vertical distribution of bbp, several statistical
parameters are considered. First, the determination coefficient (R²) and the slope of the linear regression between the log-transformed values of bbp_SOCA and bbp_Floats (or bbp_AMT) are
computed. Second, we estimate the model error using the Median Absolute Percent Difference (MAPD, %) calculated as follows:
100 ) ( _ _ _ Floats bp Floats bp SOCA bp b b b median MAPD . (9)
Note that bbp_Floats is replaced by bbp_AMT for the validation against bbp profiles from AMT
cruise. We also evaluate the sensitivity of SOCA-BBP to uncertainties in the origin of the satellite data used as input to the MLP. For this purpose, a test is performed which consists in replacing the MODIS-Aqua-derived bio-optical products by VIIRS-derived products.
4 Results and Discussion
4.1 Retrieval of the vertical distribution of the particulate backscattering coefficient
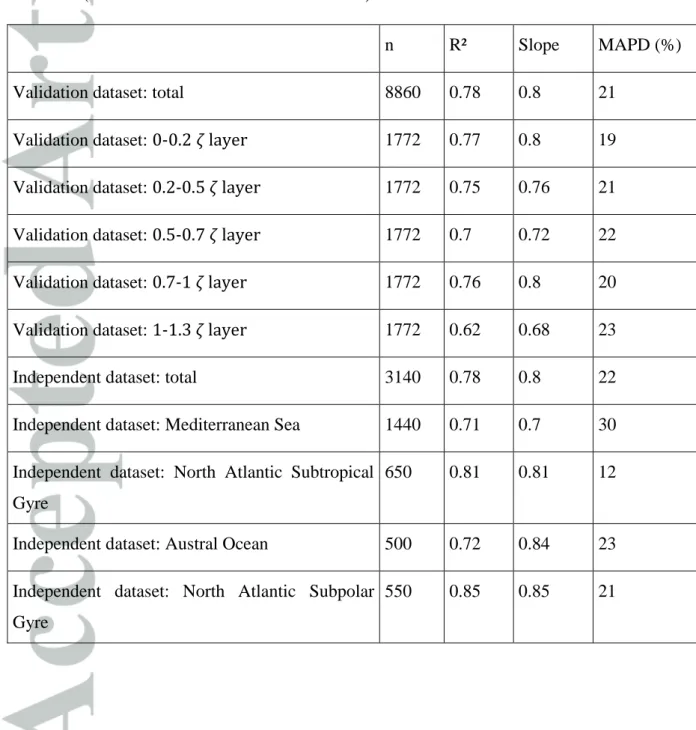
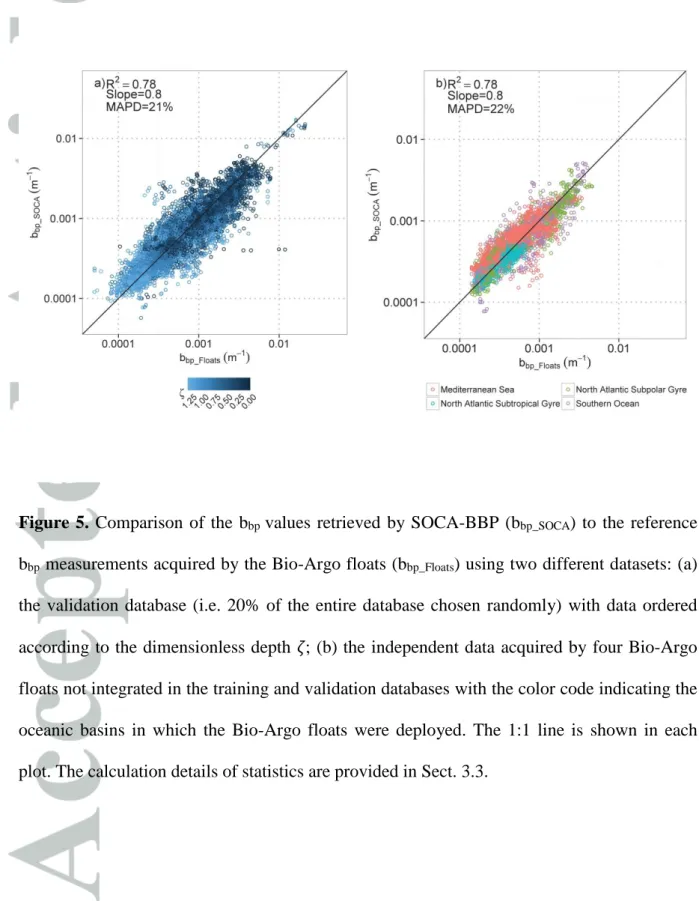
Using the validation database (i.e. 20% of our initial database), the ability of the method is evaluated through a comparison of the 10 values retrieved from SOCA-BBP (bbp_SOCA) with
corresponding values measured by the Bio-Argo floats (bbp_Floats). The scatterplot of bbp_SOCA
versus bbp_Floats reveals that SOCA-BBP predicts bbp without systematic bias (i.e. global error
of retrieval of 21%; see Figure 5a and Table 3). This Figure shows that most of the bbp_SOCA
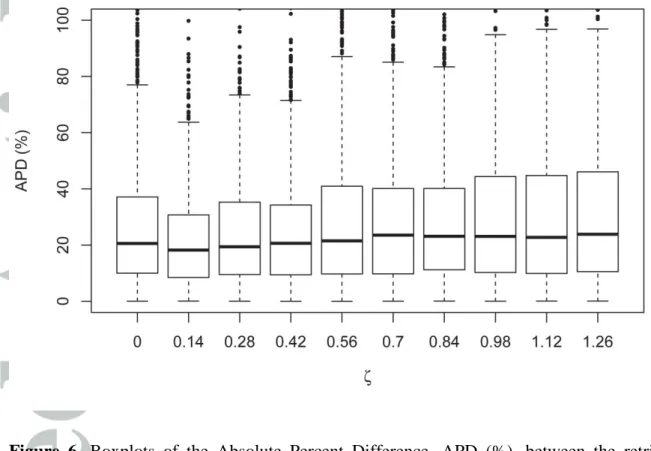
values are retrieved with substantial accuracy and that only a limited number of data points diverge significantly from the 1:1 line (Figure 5a). No bias according to the dimensionless depth of estimation seems to be identified from the Figure 5a. To be more precise, we tested statistically the performance of the method with respect to the vertical dimension (see Figures 6 and S4 and Table 3). The Figure 6 presents the median of APD that is ~20% for each of the ten dimensionless output depths. The APD appears somewhat lower for the 0-0.84 𝜁 layer suggesting that the method performs slightly better for the upper layers. For the deep layers, the bbp values are very low, which may lead to large errors even when the difference between
the predicted and reference values is minor. Nevertheless, the APD remains still low for these deep layers (~22% for the median). Figure S4 presents the scatterplots of bbp_SOCA versus
bbp_Floats for 5 layers of the water column (chosen from the dimensionless depth 𝜁). This
Figure reveals that bbp is predicted without systematic bias according to the vertical dimension
and that the slight deterioration of statistic results (see Table 3) for the deepest layer (1-1.3 𝜁 layer) might come from the lower range of bbp values to predict.
4.2 Sensitivity of SOCA-BBP to satellite input data
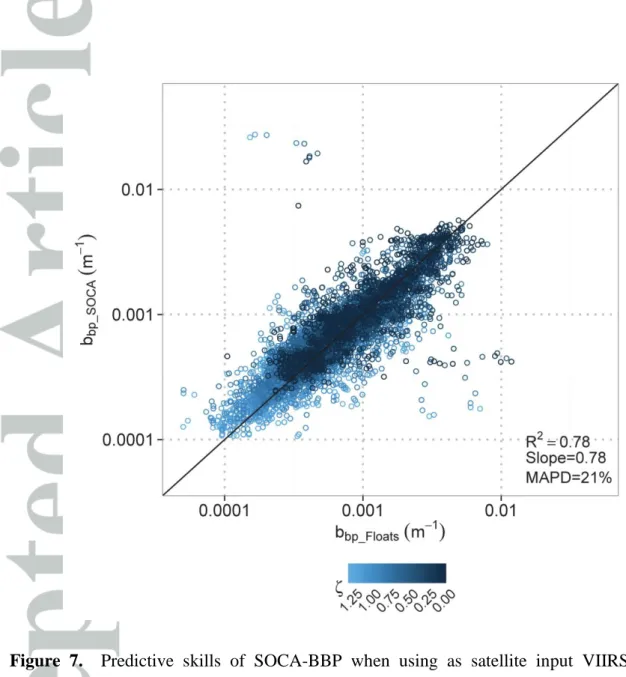
We evaluate the sensitivity of the method to satellite input data by replacing in the validation dataset the MODIS-Aqua products by VIIRS-derived products. It is important to note that the purpose here is not to compare MOIS-Aqua and VIIRS products in term of accuracy but to evaluate the impact to use other satellite input data (e.g. VIIRS estimates rather than MODIS-Aqua) on the performance of the SOCA-BBP method. The VIIRS-to-Argo matchups are computed using standard level 3 VIIRS composites (reprocessing R2014.0) with a 4-km resolution and 8-day binning period (9-km resolution as for MODIS-Aqua not available). Among the 886 Bio-Argo profiles of the validation dataset, 649 profiles had concomitant VIIRS and MODIS-Aqua products available. The sensitivity of the method to both types of satellite input data is therefore evaluated using these 649 profiles (see statistics in Table 4). Obviously, as the neural network was trained using MODIS Aqua products as input data, the use of VIIRS data slightly reduces the skills of the method (i.e. decrease in the determination coefficient by 0.07). However, the scatterplot of bbp_SOCA (using VIIRS data as input) versus
bbp_Floats shows that the data points are still fairly well scattered around the line 1:1 (Figure 7)
and the accuracy of the method remains satisfactory when VIIRS data are used as input (Table 4). Finally, SOCA-BBP appears robust to reasonable noise in the input satellite data. Use of VIIRS- instead of MODIS-Aqua-derived products yield accurate results (global retrieval error of 21%; Table 4) despite a MAPD in the VIIRS products compared to the MODIS-Aqua products of 44% and 15% for bbp and Chl, respectively.
4.3 Additional validation of SOCA-BBP using independent datasets
Time series of the vertical profile of the particulate backscattering coefficient collected from four Bio-Argo profiling floats deployed in several oceanic basins (Southern Ocean, North
Atlantic Subtropical Gyre, North Atlantic Subpolar Gyre, North Western Mediterranean Sea) were removed from the initial database to obtain an independent dataset for further validation of SOCA-BBP (see Sect. 2.2). A comparison of bbp_SOCA with the corresponding bbp_Floats in
each basin is presented in Figure 5b. This comparison suggests that the method has similar accuracy when tested with this independent dataset (Table 3) as with the validation dataset comprising 20% of the initial database. The skill of the method is slightly reduced in the Mediterranean Sea compared to other areas (increase of MAPD by ~ 8%).
To obtain fully depth-resolved vertical profiles of bbp, we applied a linear interpolation
between each of the 10 bbp_SOCA values provided by the MLP. The resulting predicted time
series are compared to their float counterparts for the four basins (Figure 8). We note that the absence of bbp_SOCA data (white bands in Figures 8b, d, f and h) reflect missing
satellite-to-Argo matchups caused by a lack of satellite image in cloudy areas/seasons (i.e. usually high latitude environments in winter). The vertical patterns of bbp predicted by SOCA-BBP are
very consistent with those observed by the profiling floats in the 0-300 m layer. For the North Atlantic Subtropical Gyre, an area with extremely low bbp values, SOCA-BBP reproduces the
seasonal deepening of the bbp maximum in spring and early summer and the shoaling in
June-July (Figures 8a and b). For the Southern Ocean, the bbp_SOCA values are consistent with the
Bio-Argo float measurements with respect to an increase of bbp from December to April in the
0-100 m layer (Figures 8c and d). In the North Atlantic Subpolar Gyre, the retrieved bbp
values agree with float measurements for both years of the time series (i.e. 2013 and 2014, Figures 8e and f). SOCA-BBP seems to underestimate bbp in the Mediterranean Sea,
especially from July to October when a deep bbp maximum developsat ~50 m (Figures 8g and
h). This underestimation is possibly caused by the relatively coarse vertical resolution of the SOCA-BBP outputs. The bbp maximum may be missed by the 10 output depths from which
0-Zm layer estimated from SOCA-BBP and measured by the Bio-Argo floats show good
agreement for the four examined areas (R² of 0.92 and MAPD of 20%; Figure 9a). Yet, this result is not surprising because the four floats used for this additional validation exercise, although not used for the training process, were deployed in the same areas as the floats represented in the training and validation datasets (see Figure 1). The comparison of depth-integrated estimations of bbp allows to smooth errors of estimation due to the noise in the in
situ bbp profiles.
The performance and the good generalization of the method was also evaluated using a totally independent set of data (i.e. different oceanic zone of sampling and different sampling sensors) from a Atlantic Meridional Transect (AMT) cruise conducted in 2009.The geolocation of the 16 profiles of temperature, salinity and bbp with concomitant
MODIS-Aqua-derived products is shown in Figure 1 (dark blue crosses). The SOCA-BBP retrieved bbp values, bbp_SOCA, were compared to the reference bbp ship-based measurements integrated
within the 0-Zm layer, bbp_AMT (Figure 9b). Similar to previous validation tests, the results
appear highly satisfactory (i.e. median absolute percent difference of 18%). In addition, this validation exercise based on totally independent set of data demonstrates that SOCA-BBP may be applicable to conditions/regions not included in the training database (e.g. Atlantic Equatorial Zone, see Figure 1).
4.4 Potential application of the SOCA-BBP method: development of global 3-D climatologies of bbp
Before the emergence and use of profiling floats equipped with backscattering sensors, vertical profiles of bbp in the ocean were quite scarce and highly heterogeneous. SOCA-BBP
provides a way to estimate vertical profiles of bbp using basic ocean color products merged
climatologies. As an example, we develop a 3-D climatology of bbp for the global ocean for
the months of June and December. We use as input satellite-based monthly composites of bbp
and Chl. These data are merged with monthly temperature and salinity data from the Argo global climatologies [Roemmich and Gilson, 2009]. As the Mediterranean sea is not represented in the Argo climatology, we use climatological data from the World Ocean Database [WOD, Levitus et al., 2013] for this basin.
First, we compare the bbp_SOCA surface values with the corresponding satellite estimates, with
the bbp_SOCA surface values defined as bbp averaged within the layer comprised between the
surface and the penetration depth, Zpd = Ze/4.6 [Morel and Berthon, 1989]. This comparison is
conducted at a 1°-resolution (i.e. Argo climatology resolution). Overall, the geographical patterns of the SOCA-BBP retrieved surface bbp values for the months of June and December
(Figures 10a and b) are consistent with those observed by the satellite (Figures 10c and d). In June high values of bbp are consistently recorded in the high latitude regions of the northern
hemisphere. Reciprocally, high values of bbp are recorded in the high latitudes of the southern
hemisphere in December. Unsurprisingly, the equatorial band, the upwelling systems associated with Eastern Boundary Currents and other near-coastal areas (Figure 10a) show high bbp values with weak seasonal variability. SOCA-BBP yields low bbp values compared to
satellite-based estimates in the subtropical gyres (Figure 10e). A general bias between the SOCA-retrieved surface bbp values and the corresponding satellite values can be identified in
Figure S5 that shows a comparison of the surface bbp values retrieved by SOCA-BBP and
derived from MODIS-Aqua climatological products for the month of June. This observation might result either from a global overestimation of the predicted bbp, or from a global
underestimation of bbp_MODIS derived from the QAA model. The SOCA-retrieved bbp versus
VIIRS-estimated climatological bbp for the month of June is displayed in Figure S6 for a
satellite-derived values using the VIIRS matchup data. This suggests that the bias observed in Figure S5 is probably caused by an underestimation of bbp using the QAA algorithm with
satellite MODIS-Aqua products.
Besides the bias between the two estimates of bbp, bbp levels yield by the model are lower than
the satellite-derived values especially in the subtropical gyres (see Figure 10). Using in situ data from the BIOSOPE cruise [Biogeochemistry and Optics South Pacific Experiment;
Claustre et al., 2008], several studies have shown an overestimation of backscattering satellite
estimates in the most oligotrophic conditions of the South Pacific Subtropical Gyre [Brown et
al., 2008; Huot et al., 2008]. In fact, inherent optical properties are very difficult to estimate
from satellite-based measurements in these extremely clear waters and it is now acknowledged that semi-analytical algorithms of bbp retrieval from satellite data lead to a
systematic overestimation [e.g. Brown et al., 2008; Lee and Huot, 2014]. Interestingly, the model improves the retrieval of the surface bbp in the subtropical gyres (Figures 10 and S5),
even though satellite-based surface bbp estimates used as input show overestimation. This is
principally because the learning of the neural network is based on accurate Bio-Argo in situ bbp profiles hence constraining the retrieved bbp surface values. In addition, as the subtropical
gyres are characterized by low Chl, the results shown in this study are consistent with the formulations of Morel and Maritorena [2001] and Huot et al. [2008] that account for a continuous decrease in bbp with decreasing chlorophyll a concentrations for low chlorophyll a
concentrations (< 0.1 mg m-3) instead of the constant bbp with decreasing chlorophyll a
concentrations as reported by Behrenfeld et al. [2005].
Finally, the vertical distribution of the depth-resolved bbp climatologies is presented in Figure
11. This Figure presents sections of bbp for the global ocean at 25 m, 50 m and 100 m depth
values with depth is apparent for most of the oceanographic zones expect in most oligotrophic waters (see Figure 11). Indeed, for instance in the pacific south subtropical gyre, the decrease in bbp levels is barely visible (from ~ 0.0003 m-1 at the surface to ~ 0.0002 m-1 at 100 m depth
in June and from ~ 0.0004 m-1 at the surface to ~ 0.0003 m-1 at 100 m depth in December) because bbp values decrease only at ~ 150 - 200 m depth. Rapid decrease of bbp are recorded in
the high latitude regions of the northern hemisphere in June (from ~ 0.004 m-1 at the surface to ~ 0.001 m-1 at 100 m depth). Reciprocally, rapid decrease of b
bp are recorded in the high
latitude regions of the southern hemisphere in December (from ~ 0.003 m-1 at the surface to ~ 0.001 m-1 at 100 m depth).As for bbp surface estimates, the vertical distribution of bbp shows
weak seasonal variability in the equatorial band, the upwelling systems associated with Eastern Boundary Currents and other near-coastal areas. In Figure 11, bbp levels are shown for
only 3 depths but it is important to note that SOCA-BBP method provides bbp vertical
distribution for the whole productive zone (0-1.3 𝜁 layer). Finally, these depth-resolved bbp
climatologies are an invaluable source of information on the vertical distribution of a key bio-optical property at a global scale with the potential to support investigations dedicated to carbon cycle, including carbon production and export.
5 Conclusion and perspectives
We have demonstrated that, using a Multi-Layered Perceptron method, we can merge ocean color-based products with temperature-salinity Argo data to infer the vertical distribution of a bio-optical property estimated from both satellite and robotic platform measurements. The proposed method, SOCA-BBP, infers the vertical distribution of the particulate backscattering coefficient using three main input components: (1) a surface component, i.e., satellite-derived products; (2) a vertical component derived from temperature and salinity profiles measured by Argo floats; and (3) a temporal component, i.e., the day of the year of the considered satellite-to-Argo matchup. Because the training of the MLP-based method was conducted using a dataset representative of the hydrologic and biogeochemical conditions prevailing in the global open ocean, the method is expected to be applicable to most open-ocean environments. Nevertheless, we note that SOCA-BBP has not been developed for applications on a profile-per-profile basis, where a single satellite-to-Argo matchup associated with a specific day would be used to retrieve an “accurate” vertical profile of bbp. Instead SOCC-BBP should be
considered as a method dedicated to relatively large-scale applications, such as the development of climatological products (see, e.g., Sect. 4.4).
The natural variability of the vertical distribution of bbp makes the prediction of this
bio-optical parameter challenging. Compared to the reference measurements acquired by the Bio-Argo floats from the training dataset (i.e. used to establish the SOCA-BBP underlying relationship), the retrieved bbp_SOCA values from the training dataset (i.e. used to establish the
underlying relationship of the MLP) are retrieved with a median absolute percent difference of 19% (i.e. intrinsic error of the model). Therefore, the error of SOCA-BBP in retrieving the vertical distribution of bbp (i.e. 21%) seems to be essentially induced by the natural variability
generate additional uncertainties in the retrieval of bbp. Our analysis of the sensitivity of
SOCA-BBP to the satellite data used as input indicates limited changes in the prediction of bbp as one uses VIIRS products instead of MODIS-Aqua products (Figure 7 and Table 4).
This suggests that the MLP is relatively insensitive to reasonable noise levels in the input satellite data because noise is accounted for in the training of the MLP. Based on this sensitivity analysis, we expect that the method can be safely used with satellite products other than those derived from MODIS-Aqua (e.g. SeaWiFS, MERIS, VIIRS, OLCI) or with merged products (e.g. GlobColour, CCI-OC).
The present study provides an invaluable source of information on the vertical distribution of the bbp allowing this key bio-optical property to be comprehensively described at a global
scale. A major application of the method is obviously linked to the creation of a depth- resolved global proxy of POC and, possibly, phytoplankton carbon with high space-time resolution. This is a prerequisite for improving the characterization and quantification of key carbon fluxes such as net primary production or export fluxes. In particular, the data resulting from SOCA-BBP are valuable for the initialization or validation of biogeochemical models. The climatological data retrieved from SOCA-BBP also have the potential to serve as benchmarks against which temporal or regional trends could be evidenced.
Several published relationships link POC to bbp eitherregionally or at the global scale[Balch et al., 2001; Cetinić et al., 2012; Loisel et al., 2001, 2002; Stramski et al., 1999, 2008]. A
systematic and routine acquisition of bbp vertical profile has started only recently (a decade
ago) so that the number of concurrent bbp and POC measurements for establishing robust
regional or global bbp-to-POC relationships is still limited. Obviously, the converted POC or
phytoplankton carbon from bbp estimated by SOCA-BBP method will integrate combined
Therefore, collecting systematic measurements of POC and bbp is of critical need for refining
the previously published relationships and, ultimately, exploit in an optimal manner the growing bbp dataset acquired by Bio-Argo floats and the SOCA-BBP climatological products.
Apart from deriving POC, recent studies have highlighted the potential of bbp as a
phytoplankton carbon proxy [Graff et al., 2015]. Actually bbp might be a more reliable proxy
of phytoplankton carbon than Chl or POC. Hence, using the bbp-to-phytoplankton carbon
relationships presently available in the literature in combination with SOCA-BBP, it appears possible to propose global estimates of the vertical distribution of phytoplankton carbon with high space-time resolution. A potential consequence of obtaining improved estimates of the phytoplankton biomass is a possible reassessment of the sources of variability in the Chl. Using phytoplankton carbon estimates derived from satellite-based data of bbp, some studies
have indeed shown that temporal changes in Chl over large oceanic regions may be predominantly caused by physiologically-driven modifications in the cellular Chl-to-carbon ratio rather than by actual changes in phytoplankton biomass [Behrenfeld et al., 2005, 2009;
Mignot et al., 2014; Siegel et al., 2013]. The combination of SOCA-BBP with other methods,
which infer the vertical distribution of Chl from space [e.g. Uitz et al., 2006], could permit the variability in the phytoplankton carbon-to-Chl relationship to be examined over the vertical dimension. This would represent a significant step towards a better understanding of light and nutrient control of phytoplankton biomass and physiological status, a prerequisite for improving the characterization of the distribution and variability in primary production and carbon export.
Along with the progressive development of a global Bio-Argo program and associated float deployments, additional measurements of concurrent density and bbp profiles will help to
currently under-sampled in the Bio-Argo database used in this study (e.g. Indian Ocean Gyre, Arctic Ocean). It is indeed important to stress out the evolving aspect of this database and of the quality of the products that can be retrieved from it. This study has shown that neural network-based methods can link the vertical distribution of a given bio-optical property (i.e. particulate backscattering coefficient) to the corresponding near-surface value merged with vertically resolved physical properties. The development of analogous methods for other bio-optical properties, measured from both Bio-Argo floats and ocean color satellites (e.g. chlorophyll a concentration, CDOM), appears as a natural extension of the present study.
Acknowledgements
This paper is a contribution to the Remotely Sensed Biogeochemical Cycles in the Ocean (remOcean) project, funded by the European Research Council (grant agreement 246777), to the ATLANTOS EU project (grant agreement 2014-633211) funded by H2020 program, to the French Bio-Argo project funded by CNES-TOSCA and to the French “Equipement d’avenir” NAOS project (ANR J11R107-F). This study is a contribution to the international IMBER project and was supported by the UK Natural Environment Research Council National Capability funding to Plymouth Marine Laboratory and the National Oceanography Centre, Southampton. This is contribution number 276 of the AMT program. GDO acknowledges funding from the UK National Centre for Earth Observation. Density and particulate backscattering coefficient profiles acquired by Bio-Argo floats used in this study are freely available (http://www.coriolis.eu.org). Temperature and salinity data were collected
and made freely available by the International Argo Program and the national programs that contribute to it (http://www.argo.ucsd.edu, http://argo.jcommops.org). The Argo Program is part of the Global Ocean Observing System. The authors deeply acknowledge the NASA for MODIS-Aqua and VIIRS imagery. The International Argo Program and the World Ocean Atlas are acknowledged for making freely available data that have allowed computation of the temperature and salinity climatologies used for our application. We are grateful to an anonymous reviewer for his valuable comments and suggestions.
References
Balch, W. M., D. T. Drapeau, J. J. Fritz, B. C. Bowler, and J. Nolan (2001), Optical
backscattering in the Arabian Sea—continuous underway measurements of particulate inorganic and organic carbon, Deep Sea Res. Part I Oceanogr. Res. Pap., 48(11), 2423– 2452, doi:10.1016/S0967-0637(01)00025-5. [online] Available from:
http://www.sciencedirect.com/science/article/pii/S0967063701000255 (Accessed 1 April 2015)
Behrenfeld, M. J., E. Boss, D. A. Siegel, and D. M. Shea (2005), Carbon-based ocean productivity and phytoplankton physiology from space, Global Biogeochem. Cycles,
19(1), n/a–n/a, doi:10.1029/2004GB002299. [online] Available from:
http://doi.wiley.com/10.1029/2004GB002299 (Accessed 21 January 2014)
Behrenfeld, M. J. et al. (2009), Satellite-detected fluorescence reveals global physiology of ocean phytoplankton, Biogeosciences, 6(5). [online] Available from:
http://escholarship.org/uc/item/9fh4s430 (Accessed 28 July 2015)
Bishop, C. M. (1995), Neural Networks for Pattern Recognition, Oxford University Press, Inc. [online] Available from: http://dl.acm.org/citation.cfm?id=525960 (Accessed 20 March 2014)
Bishop, J. K. B. (2009), Autonomous observations of the ocean biological carbon pump,
Lawrence Berkeley Natl. Lab. [online] Available from:
http://escholarship.org/uc/item/1q5530cp (Accessed 10 October 2015)
Bishop, J. K. B., and T. J. Wood (2009), Year-round observations of carbon biomass and flux variability in the Southern Ocean, Global Biogeochem. Cycles, 23(2), GB2019,
doi:10.1029/2008GB003206. [online] Available from:
http://doi.wiley.com/10.1029/2008GB003206 (Accessed 18 March 2014)
Boss, E., and M. Behrenfeld (2010), In situ evaluation of the initiation of the North Atlantic phytoplankton bloom, Geophys. Res. Lett., 37(18), n/a–n/a, doi:10.1029/2010GL044174. [online] Available from: http://doi.wiley.com/10.1029/2010GL044174 (Accessed 4 March 2014)
Boss, E., and W. S. Pegau (2001), Relationship of Light Scattering at an Angle in the Backward Direction to the Backscattering Coefficient, Appl. Opt., 40(30), 5503, doi:10.1364/AO.40.005503. [online] Available from:
http://www.osapublishing.org/abstract.cfm?uri=ao-40-30-5503 (Accessed 11 May 2015) Boss, E., D. Swift, L. Taylor, P. Brickley, R. Zaneveld, S. Riser, M. Perry, and P. Strutton
(2008), Observations of pigment and particle distributions in the western North Atlantic from an autonomous float and ocean color satellite, Limnol. Oceanogr., 53(5, part 2), 2112–2122. [online] Available from:
http://ecite.utas.edu.au/80203/1/boss_labrador_sea_profiling_float.pdf (Accessed 19 March 2014)
De Boyer Montégut, C., G. Madec, A. S. Fischer, A. Lazar, and D. Iudicone (2004), Mixed layer depth over the global ocean: An examination of profile data and a profile-based climatology, J. Geophys. Res., 109(C12), C12003, doi:10.1029/2004JC002378. [online] Available from: http://doi.wiley.com/10.1029/2004JC002378 (Accessed 25 July 2014) Bricaud, A., C. Mejia, D. Blondeau-Patissier, H. Claustre, M. Crepon, and S. Thiria (2007), Retrieval of pigment concentrations and size structure of algal populations from their absorption spectra using multilayered perceptrons., Appl. Opt., 46(8), 1251–60. [online] Available from: http://www.ncbi.nlm.nih.gov/pubmed/17318245
Brown, C., Y. Huot, P. WerdellL, B. Gentili, and H. Claustre (2008), The origin and global distribution of second order variability in satellite ocean color and its potential
applications to algorithm development, Remote Sens. Environ., 112(12), 4186–4203, doi:10.1016/j.rse.2008.06.008. [online] Available from:
http://www.sciencedirect.com/science/article/pii/S0034425708002162 (Accessed 29 June 2015)
Cetinić, I., M. J. Perry, N. T. Briggs, E. Kallin, E. A. D’Asaro, and C. M. Lee (2012), Particulate organic carbon and inherent optical properties during 2008 North Atlantic Bloom Experiment, J. Geophys. Res., 117(C6), C06028, doi:10.1029/2011JC007771. [online] Available from: http://adsabs.harvard.edu/abs/2012JGRC..117.6028C (Accessed 9 February 2015)
Claustre, H., A. Sciandra, and D. Vaulot (2008), Introduction to the special section Bio-optical and biogeochemical conditions in the South East Pacific in late 2004: the BIOSOPE program, Biogeosciences Discuss., 5(1), 605–640. [online] Available from: http://hal.upmc.fr/hal-00330284 (Accessed 29 June 2015)
Claustre, H. et al. (2010a), Bio-optical profiling floats as new observational tools for biogeochemical and ecosystem studies: potential synergies with ocean color remote sensing., in Proceedings of the OceanObs 09: Sustained Ocean Observations and
Information for Society Conference (Vol.2), edited by J. Hall, D. E. Harrison, and D.
Stammer, ESA Publ., Venice, Italy. [online] Available from: http://www.obs-vlfr.fr/LOV/OMT/fichiers_PDF/Claustre_et_al_OceanObs_cwp_10.pdf
Claustre, H. et al. (2010b), Guidelines towards an integrated ocean observation system for ecosystems and biogeochemical cycles, in Proceedings of the OceanObs 09: Sustained
Ocean Observations and Information for Society Conference (Vol.1), edited by J. Hall,
D. E. Harrison, and D. Stammer, ESA Publ., Venice, Italy. [online] Available from: http://www.obs-vlfr.fr/LOV/OMT/fichiers_PDF/Claustre_et_al_OceanObs_10.pdf Dall’Olmo, G., and K. A. Mork (2014), Carbon export by small particles in the Norwegian
Sea, Geophys. Res. Lett., 41(8), 2921–2927, doi:10.1002/2014GL059244. [online] Available from: http://doi.wiley.com/10.1002/2014GL059244 (Accessed 31 March 2015)
Duforêt-Gaurier, L., H. Loisel, D. Dessailly, K. Nordkvist, and S. Alvain (2010), Estimates of particulate organic carbon over the euphotic depth from in situ measurements.
Pap., 57(3), 351–367, doi:10.1016/j.dsr.2009.12.007. [online] Available from:
http://www.sciencedirect.com/science/article/pii/S0967063710000063 (Accessed 31 March 2015)
Falkowski, P. G., T. R. Barber, and V. Smetacek (1998), Biogeochemical Controls and Feedbacks on Ocean Primary Production, Science (80-. )., 281(5374), 200–206, doi:10.1126/science.281.5374.200. [online] Available from:
http://www.sciencemag.org/content/281/5374/200.abstract (Accessed 10 July 2014) Friedrich, T., and a. Oschlies (2009), Neural network-based estimates of North Atlantic
surface pCO 2 from satellite data: A methodological study, J. Geophys. Res., 114(C3), C03020, doi:10.1029/2007JC004646. [online] Available from:
http://doi.wiley.com/10.1029/2007JC004646 (Accessed 18 March 2014)
Gardner, W. D., A. V. Mishonov, and M. J. Richardson (2006), Global POC concentrations from in-situ and satellite data, Deep Sea Res. Part II Top. Stud. Oceanogr., 53(5-7), 718– 740, doi:10.1016/j.dsr2.2006.01.029. [online] Available from:
http://www.sciencedirect.com/science/article/pii/S0967064506000580 (Accessed 9 April 2015)
Graff, J. R., T. K. Westberry, A. J. Milligan, M. B. Brown, G. Dall’Olmo, V. van Dongen-Vogels, K. M. Reifel, and M. J. Behrenfeld (2015), Analytical phytoplankton carbon measurements spanning diverse ecosystems, Deep Sea Res. Part I Oceanogr. Res. Pap., doi:10.1016/j.dsr.2015.04.006. [online] Available from:
http://www.sciencedirect.com/science/article/pii/S0967063715000801 (Accessed 13 May 2015)
Gross, L., S. Thiria, R. Frouin, and B. G. Mitchell (2000), Artificial neural networks for modeling the transfer function between marine reflectance and phytoplankton pigment concentration, J. Geophys. Res., 105(C2), 3483, doi:10.1029/1999JC900278. [online] Available from: http://doi.wiley.com/10.1029/1999JC900278
Hornik, K., M. Stinchcombe, and H. White (1989), Multilayer Feedforward Networks are Universal Approximators, Neural Networks, 2, 359–366.
Huot, Y., A. Morel, M. S. Twardowski, D. Stramski, and R. A. Reynolds (2008), Particle optical backscattering along a chlorophyll gradient in the upper layer of the eastern South Pacific Ocean, Biogeosciences, 5(2), 495–507. [online] Available from: http://hal.ird.fr/hal-00330702/ (Accessed 29 June 2015)
Jamet, C., H. Loisel, and D. Dessailly (2012), Retrieval of the spectral diffuse attenuation coefficient K d ( λ ) in open and coastal ocean waters using a neural network inversion,
J. Geophys. Res., 117(C10), C10023, doi:10.1029/2012JC008076. [online] Available
from: http://doi.wiley.com/10.1029/2012JC008076 (Accessed 19 March 2014) Kokhanovsky, A. A. (2012), Light Scattering Reviews 7: Radiative Transfer and Optical
Properties of Atmosphere and Underlying Surface. [online] Available from:
https://books.google.com/books?hl=fr&lr=&id=Rywhrj2utuAC&pgis=1 (Accessed 11 May 2015)
Kostadinov, T. S., D. A. Siegel, and S. Maritorena (2010), Global variability of phytoplankton functional types from space: assessment via the particle size distribution,
Biogeosciences, 7(10), 3239–3257, doi:10.5194/bg-7-3239-2010. [online] Available
from: http://www.biogeosciences.net/7/3239/2010/bg-7-3239-2010.html (Accessed 10 October 2015)
Krasnopolsky, V. M. (2009), Neural Network Applications to Solve Forward and Inverse Problems in Atmospheric and Oceanic Satellite Remote Sensing, , 191–205.
Lee, Z., and Y. Huot (2014), On the non-closure of particle backscattering coefficient in oligotrophic oceans., Opt. Express, 22(23), 29223–33, doi:10.1364/OE.22.029223. [online] Available from: http://www.osapublishing.org/viewmedia.cfm?uri=oe-22-23-29223&seq=0&html=true (Accessed 10 October 2015)
Lee, Z., K. L. Carder, and R. A. Arnone (2002), Deriving Inherent Optical Properties from Water Color: a Multiband Quasi-Analytical Algorithm for Optically Deep Waters, Appl.
Opt., 41(27), 5755, doi:10.1364/AO.41.005755. [online] Available from:
http://ao.osa.org/abstract.cfm?URI=ao-41-27-5755 (Accessed 8 April 2015) Lee, Z., B. Lubac, J. Werdell, and R. Arnone (2009), An update of the quasi-analytical
algorithm (QAA_v5), Int. Ocean Color Gr. Softw. Rep.
Lek, S., and J. F. Guégan (1999), Artificial neural networks as a tool in ecological modelling, an introduction, Ecol. Modell., 120(2-3), 65–73, doi:10.1016/S0304-3800(99)00092-7. [online] Available from:
http://www.sciencedirect.com/science/article/pii/S0304380099000927 (Accessed 19 March 2014)
Levitus, S. et al. (2013), The World Ocean Database, Data Sci. J., 12(0), WDS229–WDS234. Loisel, H., E. Bosc, D. Stramski, K. Oubelkheir, and P.-Y. Deschamps (2001), Seasonal
variability of the backscattering coefficient in the Mediterranean Sea based on satellite SeaWiFS imagery, Geophys. Res. Lett., 28(22), 4203–4206,
doi:10.1029/2001GL013863. [online] Available from:
http://doi.wiley.com/10.1029/2001GL013863 (Accessed 8 April 2015)
Loisel, H., J.-M. Nicolas, P.-Y. Deschamps, and R. Frouin (2002), Seasonal and inter-annual variability of particulate organic matter in the global ocean, Geophys. Res. Lett., 29(24), 2196, doi:10.1029/2002GL015948. [online] Available from:
http://doi.wiley.com/10.1029/2002GL015948 (Accessed 8 April 2015)
Loisel, H., J.-M. Nicolas, A. Sciandra, D. Stramski, and A. Poteau (2006), Spectral
dependency of optical backscattering by marine particles from satellite remote sensing of the global ocean, J. Geophys. Res., 111(C9), C09024, doi:10.1029/2005JC003367. [online] Available from: http://doi.wiley.com/10.1029/2005JC003367 (Accessed 23 July 2015)
Martinez-Vicente, V., G. Dall’Olmo, G. Tarran, E. Boss, and S. Sathyendranath (2013), Optical backscattering is correlated with phytoplankton carbon across the Atlantic
Ocean, Geophys. Res. Lett., 40(6), 1154–1158, doi:10.1002/grl.50252. [online] Available from: http://doi.wiley.com/10.1002/grl.50252 (Accessed 19 May 2015)
Mignot, A., H. Claustre, J. Uitz, A. Poteau, F. D’Ortenzio, and X. Xing (2014), Understanding the seasonal dynamics of phytoplankton biomass and the deep
chlorophyll maximum in oligotrophic environments: A Bio-Argo float investigation,
Global Biogeochem. Cycles, 28(8), 856–876, doi:10.1002/2013GB004781. [online]
Available from: http://doi.wiley.com/10.1002/2013GB004781 (Accessed 23 January 2015)
Morel, A., and J.-F. Berthon (1989), Surface Pigments, Algal Biomass Profiles, and Potential Production of the Euphotic Layer: Relationships Reinvestigated in View of Remote-Sensing Applications, Limnol. Oceanogr., 34(8), 1545–1562.
Morel, A., and S. Maritorena (2001), Bio-optical properties of oceanic waters: A reappraisal,
J. Geophys. Res., 106(C4), 7163, doi:10.1029/2000JC000319. [online] Available from:
http://doi.wiley.com/10.1029/2000JC000319 (Accessed 20 March 2014)
Niang, a., F. Badran, C. Moulin, M. Crépon, and S. Thiria (2006), Retrieval of aerosol type and optical thickness over the Mediterranean from SeaWiFS images using an automatic neural classification method, Remote Sens. Environ., 100(1), 82–94,
doi:10.1016/j.rse.2005.10.005. [online] Available from:
http://linkinghub.elsevier.com/retrieve/pii/S0034425705003421 (Accessed 18 March 2014)
Palacz, A. P., M. A. St. John, R. J. W. Brewin, T. Hirata, and W. W. Gregg (2013),
Distribution of phytoplankton functional types in high-nitrate, low-chlorophyll waters in a new diagnostic ecological indicator model, Biogeosciences, 10(11), 7553–7574, doi:10.5194/bg-10-7553-2013. [online] Available from:
http://www.biogeosciences.net/10/7553/2013/bg-10-7553-2013.html (Accessed 19 March 2014)
Raitsos, D. E., S. J. Lavender, C. D. Maravelias, J. Haralabous, A. J. Richardson, and P. C. Reid (2008), Identifying four phytoplankton functional types from space: An ecological approach, Limnol. Oceanogr. Ocean., 53(2), 605–613.
Rochford, P. A., A. B. Kara, A. J. Wallcraft, and R. A. Arnone (2001), Importance of solar subsurface heating in ocean general circulation models, J. Geophys. Res., 106(C12), 30923, doi:10.1029/2000JC000355. [online] Available from:
http://doi.wiley.com/10.1029/2000JC000355 (Accessed 7 May 2015)
Roemmich, D., and J. Gilson (2009), The 2004–2008 mean and annual cycle of temperature, salinity, and steric height in the global ocean from the Argo Program, Prog. Oceanogr.,
82(2), 81–100, doi:10.1016/j.pocean.2009.03.004. [online] Available from:
http://www.sciencedirect.com/science/article/pii/S0079661109000160 (Accessed 8 January 2015)
Roemmich, D., G. Johnson, S. Riser, R. Davis, J. Gilson, W. B. Owens, S. Garzoli, C. Schmid, and M. Ignaszewski (2009), The Argo Program: Observing the Global Oceans