HAL Id: hal-00529151
https://hal.archives-ouvertes.fr/hal-00529151
Submitted on 25 Oct 2010HAL is a multi-disciplinary open access archive for the deposit and dissemination of sci-entific research documents, whether they are pub-lished or not. The documents may come from teaching and research institutions in France or abroad, or from public or private research centers.
L’archive ouverte pluridisciplinaire HAL, est destinée au dépôt et à la diffusion de documents scientifiques de niveau recherche, publiés ou non, émanant des établissements d’enseignement et de recherche français ou étrangers, des laboratoires publics ou privés.
Impact of sludge mechanical behaviour on spatial
distribution parameters obtained with centrifugal
spreader
P. Héritier, J.C. Roux, E. Dieudé-Fauvel
To cite this version:
P. Héritier, J.C. Roux, E. Dieudé-Fauvel. Impact of sludge mechanical behaviour on spatial dis-tribution parameters obtained with centrifugal spreader. AgEng 2010, International Conference on Agricultural Engineering, Sep 2010, Clermont-Ferrand, France. p. - p. �hal-00529151�
Impact of sludge mechanical behaviour on spatial distribution
parameters obtained with centrifugal spreader
P. Héritier, J-C. Roux, E. Dieudé-Fauvel*
Cemagref, Domaine des Palaquins, 03150 Montoldre, France *Corresponding author: [email protected]
Abstract
The impact of pasty materials rheological behaviour on spatial distribution parameters obtained with centrifugal spreader, i.e. spinning disc system, was studied. Kaolin suspensions were used. To model their rheological properties, a Herschel-Bulkley equation was used, which is consistent with the literature. Experiments were performed with a specific spreading device (a vane with no disc) and with the CEMOB, a bench dedicated to the analysis of organic fertilisers spreading. Results showed that radial distribution of the 3D spread patterns is clearly dependent on size and density of the particles, both of them being related to the material consistency. Angular distribution also tends to follow similar tendencies. This study presents a new approach to analyse organic spreading and opens the way to more developments.
Keywords: sludge rheological behaviour, centrifugal spreading, radial and angular distributions.
1. Introduction
Wastewater treatment plants produce a large amount of residues which are spread on agricultural fields. This process of sludge reuse is mainly devoted to small and medium wastewater treatment plants and represents approximately 50% of the French annual sludge production. The spatial distribution of those organic fertilisers has a large influence on the growth of the crop. However, because they contain nutrients that can pollute soils or ground and surface waters, excessive application must be avoided. This is all the more important that mineral fertilisers are usually added for enrichment, considering the average composition of the organic matter. Thus, it seems necessary to understand and adjust the spreading process in order to optimize the quality of distribution patterns and consequently to limit their environmental impacts.
The equipments used to spread organic matter depend on its nature and its consistency. For example, liquid slurries are spread with tankers equipped with splash plate nozzles or trailing hoses whereas “solid” manure is spread with spinning systems or beater spreaders. This study focuses on pasty materials, spread with a centrifugal system, equipped with a spinning disc: this technology is similar to the main one used for mineral fertilisers spreading. It was then the most studied (Hofstee, 1995, Persson, 1998).
Globally, spreading equipments are constituted in the same way. They are composed by: - a hopper containing the material to be spread
- a conveying system bringing the material toward the outlet
- a propulsion system providing the energy to spread to material on the field.
On a mechanical point of view, during the entire spreading process, the material is subjected to many stresses. Practically, its flowing behaviour within the machine results from its rheological properties and from the exerted stresses. From the inlet to the outlet, the flow can de divided into three parts: gravitational flow in the hopper, shear flow and centrifugal acceleration along the vane, and ballistic flight and fragmentation in the air. The spreading process generates a distribution map which shapes and properties depend on material characteristics and machine settings. Previous studies showed that, considering centrifugal spreading system, spatial distribution can be resumed as the combination of two distributions: first the angular distribution around the rotation axes of Author-produced version of the paper presented at AgEng 2010 Conference, 6-8 Septembre 2010, Clermont-Ferrand, France
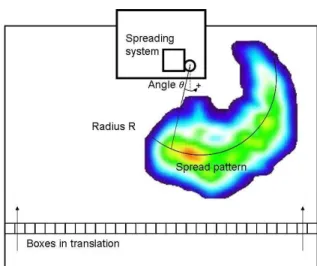
the system, then the range of projection of the material (Piron and Miclet, 2005). Thus, spread pattern can be defined by its average radius R and average angle
θ
: the first one corresponds to the distance between the disc centre and the spread pattern centre, the second states the angle between the travel direction and the straight line passing through the disc centre and the distribution map centre (Koko and Virin, 2009). Considering that the spread pattern is asymmetric, its centre corresponds to the maximum quantity of matter (distribution peak).For organic matter spreading, the main parameters are transverse distribution and longitudinal regularity. Especially, transverse distribution plays an important role due to the superimposition of spread patterns resulting from the tractor trajectory. Thus, sewage sludge spreading was especially studied by Thirion and Chabot (2003) who looked at the global practices with their advantages and problems. Shufa et al. (2009) showed the impact of the spinning disc speed. Tabuteau (2005) focused his work on sludge rheological behaviour on a spinning disc without vanes. However, it seems that the relationships between material properties, distribution patterns and machine settings were scarcely developed, probably because sewage sludge are difficult to handle.
Rheological sludge behaviour was quite studied during those last years (Lolito et al., 1997; Chaari et al., 2003; Seyssiecq et al., 2003; Spinosa and Wichman, 2004). Though their behaviour is more complex than a Herschel-Bulkley one (Baudez, 2008), this model remains appropriated to characterise sludge (Baudez, 2001; Tixier et al., 2003).
However, sludge composition is complex and evolves with time due to ageing and microbial activity. In that paper, we used kaolin which is a material easier to work out. Physical properties of kaolin suspensions are especially studied because kaolin is a natural deposit that is mainly used as paper filler and paper coating pigment (Jepson, 1984). Kaolin has many advantages: (i) its rheological behaviour is similar to sludge one and can be described by a Herschel-Bulkley model (Masalova et al., 2006, Pantet and Monnet, 2007), (ii) modifying samples concentration leads to a large range of consistencies, from liquid to solid, (iii) its white colour makes the video analysis easier to perform, (iv) the material is homogeneous, (v) during spreading test, biohazard risks disappear.
The paper presents the specific devices and protocols we used to perform the experiments. The rheological characterisation of the materials is detailed before analysing spreading patterns. Those results are used to improve our understanding of centrifuge organic spreading.
2. Materials and methods
2.1. Material
Kaolin from Beauvoir (Allier, France) was used. Kaolin suspensions were prepared with an industrial blender, in 0.35m3 batches, by mixing kaolin powder and tap water. Different concentrations were considered: 42%, 52%, 55% and 59% of dry matter content. In order to obtain a mixture as homogeneous as possible, samples were mixed during 2 or 3 hours. The exact concentration was determined by drying at 105°C during 24h.
Water was also used as a reference product and to set the devices.
2.2. Experimental system
Experimental spreader
container in which the material is stored before being transported to the spinning system. A volumetric pump and a volume-flow meter are located under the container. They allow to control and adjust the volume flow during tests. Flow is regulated at 0.67m3.s-1. A pipe (diameter = 0.025m, length = 1.5m) in outlet of flow meter carries the material to the spinning system inlet. The dropping point of the matter is fixed and located at 0.085m of the spinning system centre with a -2.58rad angle.
Figure 1: Overview of the experimental system
During the setting phase, different spinning systems (disc, vane) were tested in order to obtain a spatial distribution as simple as possible (with just one peak). The selected system is a double vane with two borders on the top and the bottom (radius = 0.3m, height = 0.06m, edge width = 0.025m) and with no disc. The system centre is the rotational axis.
For the tests presented here, the spinning system rotational speed was fixed at 67rad.s-1. Spatial distribution determination and spreading map analysis
Tests were realized on a bench named CEMOB (Cemagref Organic Bench), which was developed by the Cemagref a few years ago (Fig.2). This bench allows the determination of the 3D spatial spreading distribution for organics materials.
The test bench is composed by motorized beams on which trays collect the organic matter discharged by the spreader. The spreading system is stationary whereas the measuring trays move. Load cells are placed beneath each tray in order to weigh the matter. A weighbridge with two platforms measures the flow of matter discharged by the spreader. Tests were repeated at least 3 to 5 times. Each test leads to a spreading map or 3D spatial distribution. The analysis was done with a specific application designed on Matlab. It could be noticed that the repeatability is very good, whichever the sample.
According to the literature (especially about granular fertilisers distributed with centrifuge systems), distribution patterns were characterized by the angular distribution and the radial distribution (i.e. the distance to the disc centre). A statistical analysis was performed with Chi-Square
χ
2 tests, to characterize those distributions. The tests were realised on the radius and on lnθ
, i.e. the Logarithm of the outlet angle. If the goodness ofχ
2 fit was satisfying, the law parameters were extracted (mean and standard deviation).Figure 2: Diagram of the experimental system with CEMOB facilities and a spread pattern.
Imaging systems
High speed images were collected thanks to a high speed video camera Photron, APX RS3000 and the software PFV. Pictures acquisition speed is 3,000pictures/s and each picture is one million pixels.
2.3. Rheological measurements
Rheological measurements were performed with two Paar Physica rheometers, a MCR300 one, equipped with a coaxial cylinders geometry with large gap and rough surfaces (inner radius = 0.012.5m, outer radius = 0.0195m, length = 0.07m) and a MCR301 one equipped with a cone/plane geometry (radius = 0.025m, gap = 10-4m). Both rheometers work with Rheoplus software (Paar Physica).
In a Couette geometry, in absence of inertia and edge effects, it may be demonstrated that r r ∂ ∂ − =
ϕ
γ
(and equivalently r r ∂ ∂ − =ω
γ
& ) and 2 2 hr Mπ
τ
= , in which M is the torque applied to the inner cylinder andγ
is the deformation,γ
& the shear rate,ϕ
the rotationangle,
ω
the rotation velocity, andτ
the shear stress, within the material (Coleman et al., 1966). For a cone/plane geometry, shear stress and shear rate as defined as follows:3 2 3 R M
π
τ
= with R the radius andϕ
ω
γ
&= .All the rheological measurements were realized at the same temperature than the spreading test. Samples were pre-sheared then stayed at rest during 1min before each test. Yield stress was measured in Couette geometry by using a torque ramp. The flow curve was obtained with cone/plane geometry. Herschel-Bulkley parameters were determined with Rheoplus software.
Each measurement was repeated at least three times. Average values are given.
3. Results and discussion
3.1. Rheology
Rheological properties of each kaolin suspension (four) were determined. Flow curves were fitted with the Hershel-Bulkley model:
n Y K
γ
τ
τ
= + & (Eq.1)the flow index.
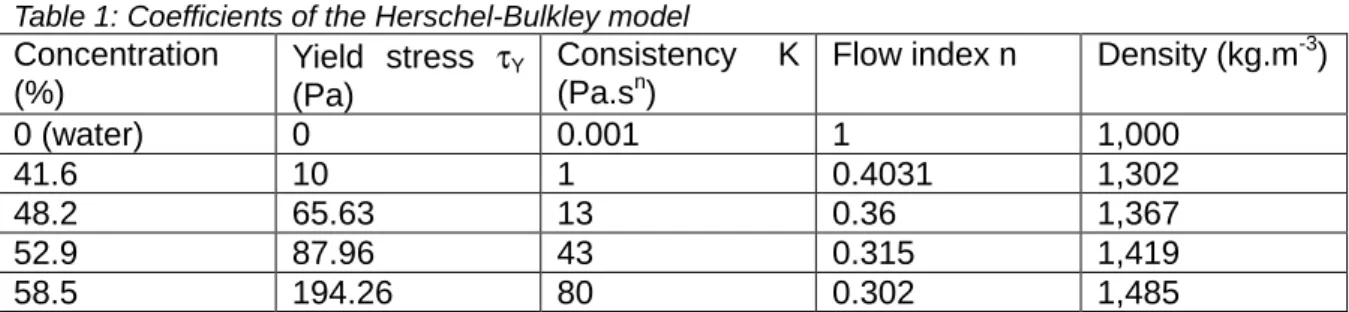
Table 1: Coefficients of the Herschel-Bulkley model
Concentration (%) Yield stress τY (Pa) Consistency K (Pa.sn)
Flow index n Density (kg.m-3)
0 (water) 0 0.001 1 1,000
41.6 10 1 0.4031 1,302
48.2 65.63 13 0.36 1,367
52.9 87.96 43 0.315 1,419
58.5 194.26 80 0.302 1,485
Rheological characteristics evolve with the concentration: the higher the solid content, the higher the yield stress and the consistency. On the contrary, the flow index increases when the kaolin content decreases (Table 1).
Those results tend to be consistent with the literature (Masalova et al., 2006).
Despite the small range of solid content, those suspensions belong to a large range of consistency, from fluid (41.6%) to really pasty (58.5%): one decade for the consistency and yield stress evolutions (Table 1). That will allow us to compare the impact of their rheological behaviour on spreading distribution characteristics.
3.2. Spreading tests
Radial distribution
Material concentration has an impact on radial distribution (Fig.3): projection distance increases with the consistency. Chi-Square
χ
2 test results were good and allowed us to use normal law to fit each curve. Fit parameters were correlated with material properties.Figure 3: Mass percent of spread matter as a function of the projection distance. Each curve represents a different suspension and the average of many experiments.
Same trends can be found regarding the Herschel-Bulkley rheological parameters (Fig.4a, c): projection distance increases with yield stress and consistency index (data not shown) but also with the density (Fig.4d). It decreases with the flow index. Eventually, the average of projection distance appears to be proportional to its standard deviation: the higher the average projection distance the higher the radial map width. In our test conditions, the relationship is linear (Fig.4b).
Figure 4: Relationship between radial distribution and rheological parameters. Average projection distance R is presented as a function of the yield stress, the flow index and also the density. The
relationship between R and its standard deviation σR is also illustrated.
Moreover, the experiments with high speed video camera showed that fragmentation process appears to depend on the material consistency (Fig.5).
Figure 5: Kaolin flow for two different solid contents in outlet of disc: on the left, a suspension with 58% of kaolin, on the right, a suspension with 42%. The material particles are bigger on the left, i.e.
for the highest concentration and the highest consistency whereas the particles are smaller for a less concentrated (fluid) suspension.
Indeed, the higher the consistency, the higher must be the stress to fragment the material. In our protocol, vane speed remains constant. Thus, all the materials are submitted to similar stresses but due to their rheological properties they do not have the same shear rate. Finally, in the air, the samples can not have the same inertia, due to their intrinsic properties and their initial velocity at the outlet of the disc. As a consequence, the fluider ones are more fragmented than the denseones: they have the higher velocities and there are fewer interactions to overcome to fragment the material. Thus, the particles are smaller, which limits the projection distance. These results are in agreement with those of Colin (1997) who studied solid particles spreading and demonstrated that ballistic flight is
notably controlled by the particles size.
Moreover, varying the dry matter content makes the consistency evolve but has also an impact on blend density (kaolin density = 1,928 kg.m-3). Despite the fact that these two parameters have an impact on the distribution, it seems difficult to evaluate the real impact of each of them: kaolin density being almost twice the water one’s, varying the consistency necessarily increases the mixture density.
In order to solve that question, a first attempt was made by doing a simulation with Excel and Visual Basic. A simplified approach of the movement of a particle was considered (Charbonnier, 1927). Newton law was applied to a particle getting out of the vane and submitted to its weight and the braking force, leading to:
dt v d m v Sc g m air x r r r = − 2 2 1
ρ
(Eq.2) Projection on x and y axis results in:α
cos
2 kSv x
m&&=− (Eq.3)
α
sin 2 kSv mg ym&&=− − (Eq.4)
with
m
particle mass,ρ
air air density,v
particle speed,α
angle with the vane, Sapparent section, cx friction coefficient, k air.cx
2 1
ρ
= .
The parameters used to do the simulation are the following: particles are assimilated to regular spheres (radius was determined according to the image analysis), their density being equal to the density of the different kaolin suspensions;
ρ
air = 1,220 kg.m-3; the initial angular speed is determined with the high speed video pictures and v0 = 18m.s-1;x
c = 0.38 and remains constant;
α
= 0 because we considered a horizontal radial vane. First, the sphere radius is constant and their density changes, then, the density is fixed and the radius increases. The results are consistent with the reality (Table 2 and Fig.6).Table 2: Projection distance estimated by simulation in order to determine density impact (radius = 5.10-4m).
Kaolin concentration (%) Density (kg.m-3) Projection distance (m)
0 (water) 1,000 4.02
41.6 1,302 4.52
48.2 1,367 4.61
52.9 1,419 4.68
58.5 1,485 4.76
Figure 6: Projection distance estimated by simulation in order to determine particle size impact (density= 1000kg.m-3) as a function of particle radius.
clearly controlled by both particles size and density and is an increasing function of both of them. It is also more impacted by the particles radius than by their density. Thus, it appears that particle density is not the main parameter impacting their ballistic flight and that their size and weight also have a significant impact. Future experiments, with real sewage sludge, will allow the determination of particles size impact: indeed, whichever their consistency, their density remains almost the same.
Angular distribution
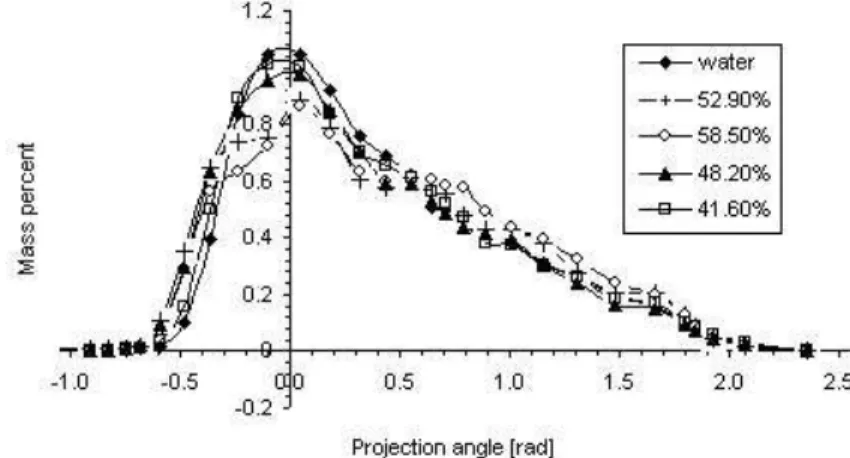
Projection angle increases with the dry matter content (Fig.7). Once again, chi-square tests were good and the distribution was fitted with Log-normal law. The parameters were related to rheological properties (Fig.8).
Figure 7: Angular distribution i.e. mass percent of matter as a function of the outlet angle. Each curve represents a different suspension and the average of many experiments.
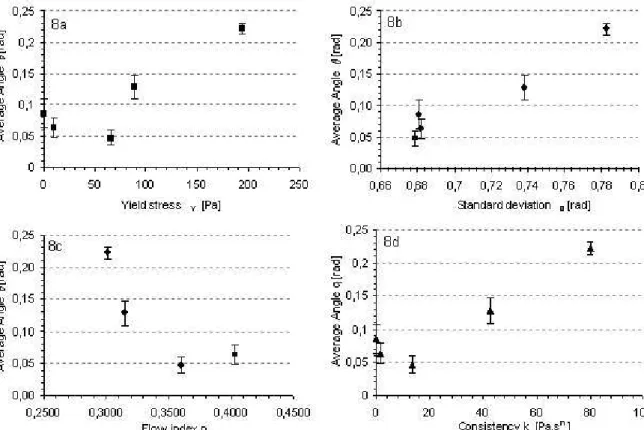
Considering the rheological parameters, the average angle increases slowly with the yield stress and the consistency (Fig.8a, d). Eventually, the average angle appears to be proportional to its standard deviation: the higher the average angle the higher the angular map width (Fig.8b).
Globally, it can be considered that angular distribution is affected by material rheological characteristics. Indeed, when the concentration increases, its apparent viscosity also increases so that the material would need more time to flow along the vane. As a consequence, a delayed action should modify the outlet angle
θ
and the angular map width which is represented by its standard deviationσ
θ. The statistical analysis showed a tendency but the differences between extreme angles were not very large (0.15rad). This hypothesis should be validated with another test that must allow us to discriminate the material flow on the vane (for example by decreasing the rotation speed of spinning system).Figure 8: Relationship between angular distribution and rheological parameters. Average angle θ is presented as a function of the yield stress, the flow index and the consistency. The relationship between θ and its standard deviation σ θ is also illustrated.
4. Conclusion
The purpose of this work was to determine the impact of pasty materials consistency on spatial distribution parameters obtained with a centrifuge spreading system.
Traditionally, organic spreading is characterised by its transverse and longitudinal distributions. In that work, we used an original approach which consists in analyzing the process in the same way as granular mineral spreading. First of all, we used a centrifuge spreading system, initially composed by a disc and a vane, which is the most used for mineral fertilisers spreading. Secondly, it was justified by the matter behaviour: at the outlet of the spinning system, particles are formed and act similarly to granular fertilisers. Then, we looked at the radial and angular distribution of the matter. The results presented here are the first step of this project and were obtained with kaolin suspensions.
Their rheological behaviour can be modelled by a Herschel-Bulkley model, in agreement with the literature. Rheological parameters were related to spread patterns characteristics. The impact of particles size and density on radial distribution was shown. Radial distribution increases when the material consistency parameters increase. However, the experiments did not allow us to determine the part of each of those parameters. More work should be done in that purpose. To do that, different ways may be considered: on the one hand, numeric simulation should be helpful (as illustrated by our first attempt); on the other hand, the device settings could be changed in order to modify the matter fragmentation and consequently to modify their size and weight. Eventually, working with real sludge will bring supplementary information. Material properties also influence angular distribution. Average angle tends to increase with the consistency. Both radial and angular distributions increase with their standard deviation which means that spreading patterns are wider since materials become more concentrated and denser (as illustrated by Herschel-Bulkley model, their consistency increases).
rheological properties and their spatial distribution with a centrifuge system was proved. Thus, this study opens many ways to get a better knowledge about organic spreading and more work will be done to deepen the results.
Acknowledgements
Special thanks are due to T.Humbert, H.Cherasse and G.Brenon for their precious help. The authors also thank E.Piron for his advice. The experiments were realised thanks to mixing material given by Faure Equipements (France).
References
Baudez, J.C. (2001). Rhéologie et physico-chimie de boues résiduaires pâteuses pour l’étude du stockage et de l’épandage. PhD ENGREF, Paris.
Baudez, J.C. (2008). Physical aging and thixotropy in sludge rheology. Applied Rheology. 18(1).
Chaari, F., Racineux, G., Poitou, A., Chaouche, M. (2003). Rheological behavior of sewage sludge and strain-induced dewatering. Rheologica Acta, 42, 273-279.
Charbonnier, P. (1927). Traité de Balistique Extérieure. Volume II. Problème Balistique Principal, Troisième Partie ; Les Théories Balistiques. Paris, Doin, Gauthier-Villars.
Coleman, B.D., H. Markowitz, W. Noll (1966). Viscometric flows of non-Newtonian fluids. Springer-Verlag. Berlin.
Colin, A. (1997). Etude du procédé d’épandage centrifuge d’engrais minéraux. PhD, Université de Technologie de Compiègne.
Jepson ; W.B. (1984). Kaolins: their properties and uses. Philosophical Transactions of the Royal Society of London. Issue A311.
Hofstee, J.W. (1995). Handling and spreading of fertilizers: Part 5, the spinning disc type fertilizer spreader. Journal of Agricultural Engineering Research, 62, 143-162.
Koko, J. and Virin, T. (2009). Optimization of a fertilizer spreading process. Mathematics and Computers in Simulation, 79, 3099-3109.
Lolito, V., Spinosa, L., Mininni, G., Antonacci, R. (1997). The rheology of sewage sludge at different steps of treatment. Water Science and Technology, 36(11), 79-85.
Masalova, I., Malkin, A.Y., Kharatiyan, E., Haldenwang, R. (2006). Scaling in pipeline flow of Kaolin suspensions. Journal of Non-Newtonian Fluid Mechanics, 136, 76-78.
Pantet, A. Monnet, P. (2007). Liquid-solid transition of kaolinite suspensions. Mechanics of Materials, 39, 819-833.
Persson, K. (1998). Physical qualities of fertilisers and variable rate spreading-interactions. Proceedings no. 424. The International Fertiliser Society, York, UK.
Piron, E., Miclet, D. (2005). Centrifugal fertiliser spreaders: a new method for their evaluation and testing. Proceedings no.556. The International Fertiliser Society.
Seyssiecq, I., Ferrasse J.H., Roche N. (2003). State of the art: rheological characterisation of wastewater treatment sludge. Biochemical Engineering Journal, 16, 41-56.
Shufa, C., Jiliang, Z., Jin, Y., Liufang, S., Xingzhao, S. (2009). Kinematic modelling and experiment on spinning disc of centrifugal manure spreader. Proceedings of the 2nd International Conference on Modelling and Simulation, ICSM2009, 4, 236-241.
Spinosa, L., Wichman, K. (2004). Sludge characterization: the role of physical consistency. Water Science and Technology, 49(10), 59-65.
Tabuteau, H., Baudez, J.C., Coussot, P. (2003). La rhéologie au service de l’amélioration des épandages de boues résiduaires pâteuses : résultats d’expériences sur maquette. Ingénieries N° spécial , 49-56.
Thirion, F. and Chabot, F. (2003). Epandage des boues résiduaires et effluents organiques – Matériels et pratiques. Cemagref Editions.
Tixier, N., Guibaud, G., Baudu, M. (2003). Determination of some rheological parameters for the characterization of activated sludge. Bioresource Technology. 33, 292-298.