HAL Id: insu-01371309
https://hal-insu.archives-ouvertes.fr/insu-01371309
Submitted on 31 Jan 2020
HAL is a multi-disciplinary open access
archive for the deposit and dissemination of
sci-entific research documents, whether they are
pub-lished or not. The documents may come from
teaching and research institutions in France or
abroad, or from public or private research centers.
L’archive ouverte pluridisciplinaire HAL, est
destinée au dépôt et à la diffusion de documents
scientifiques de niveau recherche, publiés ou non,
émanant des établissements d’enseignement et de
recherche français ou étrangers, des laboratoires
publics ou privés.
A mini outburst from the nightside of comet
67P/Churyumov-Gerasimenko observed by the OSIRIS
camera on Rosetta
Joerg Knollenberg, Z. Y. Lin, S. F. Hviid, N. Oklay, J.-B. Vincent, Dennis
Bodewits, S. Mottola, M. Pajola, H. Sierks, C. Barbieri, et al.
To cite this version:
Joerg Knollenberg, Z. Y. Lin, S. F. Hviid, N. Oklay, J.-B. Vincent, et al.. A mini outburst from the
nightside of comet 67P/Churyumov-Gerasimenko observed by the OSIRIS camera on Rosetta.
Astron-omy and Astrophysics - A&A, EDP Sciences, 2016, 596, A89 (10 p.). �10.1051/0004-6361/201527744�.
�insu-01371309�
A&A 596, A89 (2016) DOI:10.1051/0004-6361/201527744 c ESO 2016
Astronomy
&
Astrophysics
A mini outburst from the nightside of comet
67P/Churyumov-Gerasimenko observed by the OSIRIS camera
on Rosetta
J. Knollenberg
1, Z. Y. Lin
16, S. F. Hviid
1, N. Oklay
4, J.-B. Vincent
4, D. Bodewits
7, S. Mottola
1, M. Pajola
6,
H. Sierks
4, C. Barbieri
9, P. Lamy
5, R. Rodrigo
21, 22, D. Koschny
17, H. Rickman
3, 20, M. F. A’Hearn
7, M. A. Barucci
10,
J. L. Bertaux
11, I. Bertini
6, G. Cremonese
9, B. Davidsson
3, V. Da Deppo
12, S. Debei
8, M. De Cecco
13, S. Fornasier
10,
M. Fulle
14, O. Groussin
5, P. J. Gutiérrez
15, W.-H. Ip
16, L. Jorda
5, H. U. Keller
1, 2, E. Kührt
1, J. R. Kramm
4,
M. Küppers
18, L. M. Lara
15, M. Lazzarin
9, J. J. Lopez Moreno
15, F. Marzari
9, G. Naletto
19, 6, 12, N. Thomas
23,
C. Güttler
4, F. Preusker
1, F. Scholten
1, and C. Tubiana
41 Institute of Planetary Research, DLR, Rutherfordstrasse 2, 12489 Berlin, Germany
e-mail: joerg.knollenberg@dlr.de
2 Institute for Geophysics and Extraterrestrial Physics, TU Braunschweig, 38106 Braunschweig, Germany 3 Department of Physics and Astronomy, Uppsala University, 75120 Uppsala, Sweden
4 Max-Planck-Institut für Sonnensystemforschung, Justus-von-Liebig-Weg, 3 37077 Göttingen, Germany
5 Aix Marseille Université, CNRS, LAM (Laboratoire d’Astro-physique de Marseille) UMR 7326, 13388 Marseille, France 6 Center of Studies and Activities for Space (CISAS) “G. Colombo”, University of Padova, via Venezia 15, 35131 Padova, Italy 7 Department for Astronomy, University of Maryland, College Park, MD 20742-2421, USA
8 Department of Mechanical Engineering – University of Padova, via Venezia 1, 35131 Padova, Italy
9 University of Padova, Department of Physics and Astronomy, vicolo dell’Osservatorio 3, 35122 Padova, Italy 10 LESIA, Obs. de Paris, CNRS, Univ Paris 06, Univ. Paris-Diderot, 5 place J. Janssen, 92195 Meudon, France 11 LATMOS, CNRS/UVSQ/IPSL, 11 boulevard d’Alembert, 78280 Guyancourt, France
12 CNR–IFN UOS Padova LUXOR, via Trasea 7, 35131 Padova, Italy 13 UNITN, Università di Trento, via Mesiano, 77, 38100 Trento, Italy
14 INAF–Osservatorio Astronomico di Trieste, via Tiepolo 11, 34143 Trieste, Italy 15 Instituto de Astrofísica de Andalucía – CSIC, 18080 Granada, Spain
16 Institute for Space Science, National Central University, 32054 Chung-Li, Taiwan
17 Research and Scientific Support Department, European Space Agency, 2201 Noordwijk, The Netherlands 18 ESA/ESAC, PO Box 78, 28691 Villanueva de la Cañada, Spain
19 Department of Information Engineering – University of Padova, via Gradenigo 6, 35131 Padova, Italy 20 PAS Space Research Center, Bartycka 18A, 00716 Warszawa, Poland
21 International Space Science Institute, Hallerstraße 6, 3012 Bern, Switzerland 22 Centro de Astrobiología, CSIC-INTA, 28850 Torrejón de Ardoz, Madrid, Spain 23 Physikalisches Institut, University of Bern, Sidlerstrasse 5, 3012 Bern, Switzerland
Received 13 November 2015/ Accepted 13 July 2016
ABSTRACT
Context. On 12 March 2015 the OSIRIS WAC camera onboard the ESA Rosetta spacecraft orbiting comet 67P /Churyumov-Gerasimenko observed a small outburst originating from the Imhotep region at the foot of the big lobe of the comet. These mea-surements are unique since it was the first time that the initial phase of a transient outburst event could be directly observed.
Aims.We investigate the evolution of the dust jet in order to derive clues about the outburst source mechanism and the ejected dust particles, in particular the dust mass, dust-to-gas ratio and the particle size distribution.
Methods. Analysis of the images and of the observation geometry using comet shape models in combination with gasdynamic modeling of the transient dust jet were the main tools used in this study. Synthetic images were computed for comparison with the observations.
Results. Analysis of the geometry revealed that the source region was not illuminated until 1.5 h after the event implying true nightside activity was observed. The outburst lasted for less than one hour and the average dust production rate during the initial four minutes was of the order of 1 kg/s. During this time the outburst dust production rate was approximately constant, no sign for an initial explosion could be detected. For dust grains between 0.01−1 mm a power law size distribution characterized by an index of about 2.6 provides the best fit to the observed radiance profiles. The dust-to-gas ratio of the outburst jet is in the range 0.6−1.8. Key words. comets: general – comets: individual: 67P/Churyumov-Gerasimenko – methods: numerical
1. Introduction
The OSIRIS camera onboard ESA Rosetta spacecraft (S/C) observes the nucleus of comet 67P/Churyumov-Gerasimenko (67P) and the surrounding near nucleus coma continuously since the close approach of Rosetta in May 2014 (Sierks et al. 2015). OSIRIS is a two-camera system comprising of a narrow angle camera (NAC) for high resolution imaging of the nucleus and a wide angle camera (WAC) with a field-of-view of 11.3◦× 12.1◦ optimized for coma observations (Keller et al. 2007). Both cam-eras are equipped with a total of 26 filters that allow imaging the comet in different colors between 250 nm and 1000 nm.
Cometary outbursts are characterized by a rapid increase in brightness usually followed by a gradual decay over the next hours or days. They are a common phenomenon in comets (Hughes 1999) but the driving mechanism is still poorly under-stood. They occur on very different scales, from very large events like the giant outburst of comet 17P/Holmes in 2007 (Lin et al. 2009) which are easily accessible by ground based observa-tions down to the mini-outbursts which may only be detected by observing spacecraft. The Deep Impact spacecraft detected ten such mini-outbursts on its approach to 9P/Tempel-1 during a time span of only two months (Farnham et al. 2007), a surpris-ingly large number of such events, especially if one takes into account that the monitoring was not continuous. Tubiana et al. (2015a) reported a mini outburst of 67P which occurred around 30 April 2014 that was observed during the Rosetta approach phase. The OSIRIS observations discussed in the following are for the first time providing information on the initial phase of a mini-outburst and, furthermore, prove unambiguously that outbursts can occur also during night.
2. Observations
The observations discussed below were acquired by the OSIRIS WAC on 12 March 2015 at a heliocentric distance of 2.12 AU. The S/C distance to the comet at that time was 80 km and the phase angle of the observations 50◦. A typical OSIRIS gas obser-vation sequence was run where images in several gas filters and the associated continuum filters are taken in the shortest possible amount of time in order to support the co-registration of images. A list of the images acquired during this sequence and used for this study is given in Table1. All images listed in Table1were acquired in 4 × 4 binning mode which results in a pixel scale of 32 m at the nucleus.
Figure1shows the development of the dust jet in four con-tinuum images, three taken in the UV-375 nm and the last one in the VIS-610 nm continuum filter. The nucleus part of the im-ages has been strongly overexposed in favor of a better signal-to-noise (S/N) ratio in the surrounding coma. The jet shows up for the first time in the image taken at 7:13:08 UTC. It then grows rapidly in brightness during the next few minutes. Besides the rather broad main jet expanding under a position angle of 146◦ with respect to the Sun (Sun is up, position an-gle is counted counter-clockwise from the Sun direction) a sec-ondary highly collimated dust filament is also visible. The next image sequence was taken about 1 h later and showed that the outburst had ceased, although a weak diffuse dust signal above the estimated source region could still represent a remnant of the outburst dust cloud. OSIRIS observations were continued on the next day and we acquired more images at very sim-ilar conditions with respect to rotational phase and illumina-tion condiillumina-tions about 25.5 h (or two comet rotaillumina-tional periods, note that no OSIRIS images were acquired at the next rotational
period following the outburst) after the nightside jet was de-tected. In this case the rotational phase at the start of the cor-responding imaging sequence was slightly shifted by only 9 min compared to the previous sequence but no clear sign of activ-ity from the nightside could be observed. Furthermore, during the following month the OSIRIS observation plan provided fur-ther opportunities (on 23−25 March, and 12/13 Apr 2015) for repeated observations of the source region under comparable illumination conditions, but in neither of these cases activity from Imhotep was detected (for the definition of the regions on 67P seeThomas et al. 2015). These observational facts show that the activity was not related to the diurnal cycle of the comet.
3. Image processing
All images were pre-processed using the OSIRIS calibration pipeline (Tubiana et al. 2015b), which includes bias subtraction, flat fielding, conversion from digital units to radiance, and dis-tortion correction. For the filters used in this analysis the un-certainty of the measured radiance is less than 1.7%. To pre-pare the quantitative analysis of the evolving dust distribution a few additional processing steps were performed. During the five minutes of observation the change in the observing geometry is rather small but not fully negligible for the present purpose. The S/N ratio is only sufficient to detect the jet in the inner part of the coma. Therefore, in a first step a 128 × 128 subframe was ex-tracted from each original image, magnified by a factor of four, and manually cleaned from bright spots due to stars, cosmic rays, or big dust grains. Thereafter, a co-registration of the images was performed by determining the optimum linear shift between im-age pairs and aligning the imim-ages accordingly. Then, in order to eliminate the coma background as much as possible, difference images were computed between the cleaned images taken after the jet started and a reference image acquired in the same filter 1−2 min before the outburst. The resulting three difference im-ages which form the basis of all subsequent analysis are shown in Fig.2.
4. Results
4.1. Illumination conditions
Looking at the images of the developing jet one immediately gets the impression that this jet emanates from a non-illuminated part of the surface. In order to prove this hypothesis we computed the detailed observation geometry at the time of image acquisition by using the best shape model of the comet currently available (a merged shape model combined of the SPG based SHAP4S (Preusker et al. 2015) and the SPC based SHAP5 (Jorda et al. 2016) models) together with the relevant SPICE kernels sup-plied by ESA providing the trajectory and S/C attitude. Using these tools the Sun incidence angle for the whole shape model was computed and displayed in Fig.3. The projection shown on the left of Fig.3is close to the image plane and the Sun is located in the direction of the yellow arrow, upwards and approximately 40◦ out of the image plane corresponding to a phase angle of 50◦. The chosen color table shows increasing incidence angles from red to blue colors, and black corresponds to incidence an-gles>90◦, that is to non-illuminated regions. It is evident that the whole “foot” part of the nucleus (Imhotep and surrounding regions) was in shadow during the relevant period of time, thus the dust jet emanates certainly from the non-illuminated part of the nucleus. Moreover, by considering the sense of rotation of the comet it is evident that the apparent source region has not been
J. Knollenberg et al.: A mini outburst from the nightside of comet 67P Table 1. OSIRIS WAC images used in this study.
Image filename Time [UTC] Filter texp[s] Remarks
WAC_2015-03-12T07.11.20.095Z_ID30_1397549001_F13 07:11:20 UV-375 45 reference image, no jet
WAC_2015-03-12T07.12.10.348Z_ID30_1397549003_F18 07:12:10 VIS-610 0.45 reference image, no jet
WAC_2015-03-12T07.12.13.500Z_ID30_1397549004_F14 07:12:13 CN 52.5 still no jet
WAC_2015-03-12T07.13.08.057Z_ID30_1397549005_F13 07:13:08 UV-375 45 jet detection
WAC_2015-03-12T07.15.18.870Z_ID30_1397549007_F13 07:15:18 UV-375 45 factor 7.7 increase in brightness
WAC_2015-03-12T07.16.09.296Z_ID30_1397549009_F18 07:16:09 VIS-610 0.45
Notes. The times indicated are the start times of the exposures.
Fig. 1.Development of a dust jet emanating from the Imhotep region (indicated by the arrow) on the night side of the comet. The left image was taken in the UV-375 nm filter on 12 March 2015 at 7:11:20 UTC before the outburst, the second image from the left shows the first appearance of the new jet at 7:13:08 (UV-375 nm), and images 3 and 4 were acquired at 7:15:08 and 7:16:09 in the UV-375 nm and VIS-610 nm filters, respectively. A logarithmic scaling was applied to enhance the visibility of the faint structures. The projected Sun direction is upwards and the FOV is 16.4 × 16.4 km. The broad bright feature in the right part of the images is an artefact due to the primary ghost of the WAC.
Fig. 2.Co-registered, cleaned and magnified (factor 4) difference images. The image taken before the outburst (left panel in Fig.1) has been sub-tracted from the three continuum images acquired after the outburst started (panels 2−4 in Fig.1). The polygonal area is defined as the jet region used to evaluate the brightness evolution of the outburst. MJ indicates the main jet, F stands for filament.
illuminated since several hours, hence it can be concluded that this jet is an example of real nightside activity.
With images only taken from one viewing direction where the jet can be unambiguously identified a stereoscopic recon-struction of the source region on the comet is obviously not possible. Nevertheless, some geometrical and gas dynamic ar-guments can be made to provide an estimate where the source could be located. Due to the specific geometry at the time of ob-servation it is highly probable that the source lays somewhere in the shadow above the area where the dust jet is seen in the image. That the broad main jet and the collimated dust filament appear at the same time is a strong indication that both features are connected and originate from the same source region. More-over, assuming that the outflow is nearly radial from the origin the source point can be determined geometrically by intersection of the two axes of the main jet and the filament, respectively.
It should be understood that the triangulation provides a vir-tual source point only, meaning that all dust outflow seems to come from this point, which does not necessarily need to be lo-cated on the nucleus surface.
4.2. Determination of the source region
To determine the direction (position angles) of the jet and filament axes and their respective uncertainties the following method was applied. Starting with an initial guess for the source location the angular positions of the brightness maxima of jet and filament were determined as a function of distance from the source. Then a linear least squares fit was used to esti-mate the position angles of jet and filament and new axes di-rections were derived. An updated source location was then de-termined by computing the intersection point of the two axes. A89, page 3 of10
Fig. 3.Sun incidence angle (red: 0◦
, blue: 90◦
) at the time of outburst on 12 March 2015 07:13:08. Left side: projection approximately corre-sponding to the image geometry, Sun upwards. The whole foot of the big lobe of the nucleus is in shadow (incidence angle>90◦
) including the possible jet source regions. Right side: side view, red arrow indicates direction to the observer, yellow arrow direction to the Sun.
Fig. 4.Difference image between the exposures taken at 7:11:20 (before the outburst) and 7:16:09 (after the outburst) in the UV-375 nm filter clearly showing the broad main jet and a secondary narrow filament. The red cross shows the suspected source point constructed under the assumption that the two jets originate from the same location and the ellipse gives the 2σ uncertainty. The half circles indicate the distances used for the angular radiance distributions plotted in Fig.5.
This procedure converges after 2−3 iterations for a given range of distances from the source. Numerical tests revealed that the choice of the distance range used for fitting has an influence on the results due to some systematic deviations between data and model. For example, a slight systematic curvature of the main jet for distances larger than about 1000 m was found which is prob-ably caused by the rotation of the nucleus. Therefore, a Monte carlo approach was used to estimate the uncertainty of the tri-angulation. The minimum and maximum distances used for fit-ting were sampled from a random uniform distribution between 300−400 m and 800−1000 m, respectively. The resulting val-ues for the position angle are 146.5◦+/−1.2◦for the main jet and 181.0◦+/−1.0◦for the filament where the given uncertainties cor-respond to 1σ. These numbers translate into an uncertainty of the triangulation of 10 m in x-direction and 30 m in y-direction in the
Fig. 5.Normalized angular radiance distribution as a function of po-sition angle on circles around the estimated source point. The angu-lar profile resembles a Gaussian and for distances between 300 m and 1000 m from the source the FWHM of the jet is approximately constant at about 30◦
.
image plane. Further uncertainties of the projected source loca-tion are due to the finite extension of the source, the unknown depth of the virtual source point below the surface, and the im-perfect correction of the motion (mainly due to rotation) of the nucleus between images. Note that due to the observation geom-etry (the average surface normal of Imhotep and the line-of-sight form an angle of about 75◦) and the associated projection effects the source diameter gives basically an uncertainty in x-direction whereas the source depth contributes mostly to the uncertainty in y-direction. Since typical dimensions of small jet sources and the depth of the virtual sourcepoint of a dust jet below the surface are both of the order of a few tens of meters the combined effect of these uncertainties was modeled by a uniform probability distri-bution with σ= 25 m/
√
3 in both directions. The factor √
3 stems from the computation of the standard deviation of a uniform dis-tribution in accordance with theGUM (2013). The uncertainty caused by the imperfect co-registration of the images due to the nucleus movement within the considered time frame was esti-mated to σ= 10 m/
√
3. All uncertainties mentioned above were then added quadratically to provide the combined uncertainties in the x- and y-directions in the image plane. The best fit of the jet axes, the resulting location of the source in the image, and the 2σ uncertainty ellipse are shown in Fig.4.
The plausibility of the above solution for the location of the source can further be checked by the following gas dy-namic consideration. Since the source of the jet is located on the not illuminated part of the nucleus it can be assumed that the jet expands either into a vacuum or into a very low pres-sure background gas. The brightness distribution of the main jet is nearly symmetric with respect to the direction of max-imum brightness, thus resembling closely what would be ex-pected from an axisymmetric flow projected onto the image plane. It is known in gas dynamics (Koppenwallner et al. 1986) that the stationary solution of the expansion of a free axisymmet-ric supersonic gas jet into a vacuum can well be approximated in the far field by a so called virtual source flow, where all stream-lines are directed radially away from a common source point. This description applies in the far field, at distances larger than ~10 times the source diameter and here the density distribution as a function of the angle with the jet axis can well be described by a Gaussian. Though this is strictly true only for gas jets, this rule is also a good approximation for the dust component of a dusty gas jet as shown byKnollenberg (1994). Therefore, in a steady state, one would expect that the angular width of the jet
J. Knollenberg et al.: A mini outburst from the nightside of comet 67P
Fig. 6. Synthetic image of 67P where the location of the esti-mated source region is marked by the white cross. The 2σ uncertainty is indicated by the ellipse. Note that an artificial light source was used to show the otherwise not illuminated region.
is independent of the distance from the virtual source point. That this is indeed the case can be seen in Fig.5where the normal-ized angular brightness distributions at different distances from the source (as indicated by the half circles in Fig.4) are plotted. Clearly, the shape of the azimuthal profile resembles a Gaussian. Furthermore, between 300 m and 1000 m distance from the es-timated source the full-width-half-maximum (FWHM) of the jet is about 30◦and nearly constant, for larger distances the width of the jet decreases slightly. The latter fact can be explained by the transient nature of the phenomenon, the jet has not yet estab-lished steady state at larger distances.
The probable source region on the nucleus can be made vis-ible in a synthetic image (Fig. 6) which was computed for the observational geometry at the time when the nightside activity occurred, but with an additional artificial light source that il-luminates also the shadowed regions. One sees that the source is located inside a depression with rougher terrain close to the smooth plain of the Imhotep region.
4.3. Properties of the source region
The determined location of the source area at a latitude of 12.1◦ and a longitude of 168.5◦ in the Cheops reference frame (Preusker et al. 2015) and its regional context on the nucleus is given in Fig.7. Here, a simulated WAC image provides the global overview and NAC images acquired during a color map-ping sequence from 5 September 2014 (months before the out-burst; acquired at an altitude of 43 km with a pixel scale of 0.8 m) provide high resolution information of the source region. The NAC image presented in the middle panel of Fig. 7 is an RGB-like image where three individual NAC images taken in the filters IR, Hydra and Green are coded to the RGB channels of the image, respectively. The bottom panel of Fig.7displays the zoom-in of our source region. Roundish features are surrounded by brighter green material, while the rest of the surface is in gray-brown color. The red cross indicates the best estimate of
Fig. 7.Simulated WAC view of the image taken on 5 September 2014 around 06:36:14 UTC (months before the outburst) with the NAC FOV marked in gray square (top panel), NAC image in RGB (middle panel) with the source region in RGB (bottom panel). R: IR, G: Hydra, B: Green. The best estimate of the jet source point is marked by the red cross and the ellipse provides the 2σ uncertainty of the source location.
the jet source point and the ellipse provides the 2σ uncertainty of the source location.
The source region consists mainly of rocky terrain (Auger et al. 2015) but some smooth parts are also visible. The constructed virtual source point of the jet itself lies inside a frac-tured part of rocky terrain in the close vicinity of roundish fea-tures of different sizes. The roundish feafea-tures are ranging in di-ameter from 2−60 m and were interpreted byAuger et al.(2015) as ancient degassing conduits.
Oklay et al.(2016) investigated large parts of the Imhotep re-gion using spectral techniques and the potentially active rere-gions are detected based on spectral slopes. The detected source region of the outburst (bottom panel of Fig.7) was one of the potential activity sources detected by Oklay et al. in the images taken on 5 September 2014, long before the outburst was observed. In this study, we extract the source Fig.7) and investigate the spec-tral properties of the region separately. Details of the specspec-tral analysis methods and the definitions can be found in Oklay et al. (2016).
The source region detected in this study is displayed as a decorrelation stretched image in Fig.8a) which emphasizes the variety in colors in the region. Variegation is clear in the vicin-ity of the roundish features once compared with the rest of the visible surface. Spectral slopes are presented in Fig.8b) show-ing that these regions belong to the active regions group de-fined by Oklay et al. (2016), due to their lower spectral slopes (10−12%/100 nm between 536 nm and 882 nm) than their vicin-ity (12−15%/100 nm), which is in the group of mixed regions. The latter correspond to either surfaces partially covered by material ejected from active spots or inactive areas peppered with small bright spots, which are currently interpreted as mi-nor ice deposits. The best estimate of the source point is located in the active region class although the uncertainty in the determi-nation of the source cannot exclude that the jet comes from the mixed regions.
Fig. 8. Detected outburst region, a) decorrelation stretched image, b) spectral slope, the white cross indicates the best estimate of the jet source point and the ellipse provides the 2σ uncertainty.
4.4. Dust cross section and mass
The specific radiance received from the optically thin dust coma can be expressed as:
Lλ= fcoma pλ π φ(α) φ0 fθ,λ r2h (1)
where pλis the geometric albedo of the dust particles at wave-length λ, φ(α) is the phase function at phase angle α, f (θ,λ) is the specific solar flux (in W m−2nm−1 at 1 AU) and r
h is the heliocentric distance in AU, and fcoma is the dust filling fac-tor, that is the fraction of a pixel covered by dust. The assump-tion of neglectable optical thickness is justified by the observa-tion that even the maximum coma brightness at the base of the most prominent jets is only about 3% of the average nucleus brightness.
By integrating the radiance over an image area containing all dust from the jet (polygonal area in Fig.2) the total cross section of the dust jet can be determined. Assuming that the geomet-ric albedo of the dust particles is similar to that of the nucleus we use p375 nm = 0.039 (Fornasier et al. 2015), the ratio of the flux at 50◦ phase to the backscattered flux is φ(α)/φ(0) = 0.4 (Kolokolova et al. 2004), f375 = 1.06 W m−2nm−1, and rh = 2.12 AU one finds a dust cross section of 35 m2in the first (dif-ference) image showing the new jet, which then increased by a factor of 7.7 (269 m2) in the next image acquired about 130 s later.
In order to convert the cross section to a dust mass assump-tions about the size distribution of the dust grains are required. A close flyby of Rosetta at 67P was performed in March 2015. The evaluation of the combined data acquired be GIADA and OSIRIS on single dust grains during this flyby (Fulle et al. 2016) confirmed qualitatively the result already found at larger he-liocentric distances byRotundi et al.(2015), the mass distribu-tion seems to be flat for sizes larger than ∼500 µm (correspond-ing to a power law differential size distribution n(rd) ∼ r
−g d with an index of g = 4) whereas the size distribution index is shal-lower than 3 for the smaller grains. If the jet particles follow the same law (here we assumed g= 2.5 for the small particles, a minimum particle radius of 1 µm, and a maximum particle radius of 3 cm) and using a constant bulk density of 1000 kg m−3 for all particles a total dust mass of about 300 kg was produced dur-ing the first three minutes after the outburst became visible. The mass estimate is little dependent on the chosen minimum size, by varying the minimum radius between 100 nm and 10 µm the total dust mass in the outburst varies only between 293 kg and 321 kg. The influence of the upper cut-off size is somewhat larger, by in-creasing the maximum radius from 1 cm to 10 cm the dust mass increases from 233 to 374 kg. It should also be noted that the true
Fig. 9.Dust mass in jet as a function of time assuming a size distribution according to Rotundi et al. (2015).
mass might be larger than the estimates given above because a fraction of the dust might still be hidden in the shadow and some fast moving dust might have alreay left the field-of-view. The dust production of the outburst in absolute terms is rather small, it corresponds to about 1−3% of the total dust production of the comet at this heliocentric distance (Fulle et al. 2016).
The evolution of the total jet mass over time is depicted in Fig.9. Here, t = 0 is the start of the exposure of the first im-age where the outburst was visible, the time of the data points are taken as the midpoint of the exposures. A linear increase of dust mass as a function of time provides a good approximation to the data which could be interpreted as a continuous constant activity of the source during this time interval. A caveat has to be made here because the 3rd data point was acquired with the VIS-610 nm filter instead of UV-375 nm. To make this observa-tion comparable with the others an assumpobserva-tion about the optical properties of the dust is required. Here, we assumed that the ge-ometric albedo of the nucleus is also representative for the dust at 610 nm (p610 nm = 0.057) and that the backscatter peak is the same as for UV-375 nm, too.
The development of the radial brightness profiles on the axis of the main jet is shown in Fig. 10 which can be used to derive clues about the expansion velocity of the dust. The main source of uncertainty in this case is the remaining offset due to the imperfect background coma subtraction. This offset was quantified by evaluation of the remaining background in re-gions outside of the jet but located in the lower part of the dif-ference images. The background uncertainty was determined to 2.1×10⁻⁸W m−2nm−1sr−1and this value is indicated by the hor-izontal dotted line in Fig.10. The two vertical dotted lines show how far the dust has travelled (at least) for the two first di ffer-ence images acquired in the UV-375 nm filter giving values of d= 1.0 km for the first and d = 2.1 km for the second image. The distance of 1.1 km between the two subsequent exposures was travelled by the dust within 130 s giving a minimum projected dust speed of 8.5 m s−1. Of course, this estimate does not exclude the presence of a certain amount of faster particles which could be hidden in the noise. That there are indeed also faster particles in the jet becomes clear when looking more closely at the bright-ness profile in the first exposure. Although the exact start of the outburst and the precise location of the source are not known we know that the dust has travelled at least the distance between the point where it becomes visible in the image and d= 1.0 km during the 45 s long exposure (note that the CN image taken im-mediately before does not show any signs of the outburst). This
J. Knollenberg et al.: A mini outburst from the nightside of comet 67P
Fig. 10.Radial radiance profiles on the axis of the main jet. The hor-izontal line indicates the uncertainty level in the background subtrac-tion and the vertical dotted lines indicate the minimum travel distance of dust for the first two exposures. For the 3rd image the much higher noise level is too high for useful analysis. Note that for the 3rd image (blue) acquired in VIS-610nm filter the brightness has been multiplied by p375* f375/p610* f610to make the data comparable in terms of the dust
cross section.
Fig. 11.Normalized radiance of a simulated dust jet as a function of position angle and viewing geometry at a distance of 800 m from the origin. FWHM increases with decreasing viewing angle (measured be-tween jet axis and observer) and takes values of 29◦, 32◦, 42◦
for view-ing angles of 90◦
,75◦
,and 60◦
, respectively.
consideration results in a velocity of some fraction of the dust vd> 16 m s−1.
4.5. Dust outflow modeling
A coupled gas/dust continuum model (Knollenberg 1994) has been applied to further support the interpretation of the above described observations. The time dependent Euler equations for coupled gas and dust flow have been solved using a second or-der Godunov-type method (Harten et al. 1983) on a fixed grid in axisymmetric polar coordinates (Kitamura 1986). A homoge-nously active region of 1◦ angular width has been assumed on the spherical model nucleus of 2 km radius and a reservoir out-flow boundary condition (Knollenberg 1994) has been specified here assuming an initial Mach number of M0 = 1. Free super-sonic outflow has been assumed on the outer boundary set at a cometocentric distance of 20 km. The dust particles are assumed to be initially at rest and the standard equation of motion for a spherical particle in a free molecular flow has been used to
model the gas-dust interaction (Kitamura 1986). After the com-putation of the dust and gas flow field integration along a line of sight was executed to calculate dust column densities for a more meaningful comparison with the images. Because the ac-tivity was observed on the nightside we assumed that a gas more volatile than H2O is the driver, and, therefore, we chose CO2 described by a molecular mass of 44 AMU and an adiabatic ex-ponent of 5/3 for the gas species. For the simulation of the dust up to 30 sizes with radii ranging between 10 µm and 1 cm with a constant bulk density of 1000 kg m−3 were used. Because for the interesting particle size distribution the mass loading effect on the gas flow can be neglected, the results of a single model run could be rescaled for different size distributions.
The use of a continuum model for the gas flow in this case is justified by the rather strong production rates and associ-ated small mean free path values for gas collisions which are required to produce the necessary gas from a small source re-gion. In the models discussed below we are using gas production rates of 1022−1023 m−2s−1giving mean free path values of the order of 1−10 cm and a comet source region of approximately 70 m diameter resulting in initial Knudsen numbers of the order of Kn = 10−4−10−3 . These are sufficiently small for a contin-uum treatment of the flow. Of course, the Knudsen numbers will increase further away from the source and the gas flow will enter a rarefied transition regime, but the strongest acceleration of the dust particles takes place rather close to the surface. For these reasons, no strong influence is expected on the results for the dust outflow by the use of the hydrodynamic approximation.
Figure11shows the normalized column density of a dust jet with a power law size distribution and a differential size index of g = 2.6 and a maximum particle size of 1 mm emanating into a vacuum as a function of position angle in the image plane and viewing angle (defined as the angle between the jet axis and the observer) at a radial distance of 800 m from the source. The characteristic shape approximately resembling a Gaussian is clearly seen and the width of the jet is about 30◦when viewed from the side (jet axis in the image plane, viewing angle=90◦), but increasing with decreasing viewing angle. The width of the modeled dust jets is compatible with the observations for view-ing angles>70◦, meaning that the axis of the jet is close to the image plane. This is also consistent with dust ejection approxi-mately normal to the surface given that the average surface nor-mal vector of the Imhotep region in inclined by about 75◦with respect to the line-of-sight. There also exists a slight dependence of the jet width on the size distribution index (because smaller particles are better coupled to the gas and show stronger lateral expansion) but for the considered grains with rd > 10 µm the effect is minute.
An interesting point which could be investigated by ex-ploiting the time-dependent capabilities of the code is the ef-fect of a stationary source function compared with a time de-pendent source function on the observable column density as a function of time. Typical results of these model runs are given in Fig.12. On the left side the simulated brightness dis-tribution of the jet at times corresponding to the UV-375 nm images are shown for the case of a constant production rate of 5 × 10²¹ m−2s−1 or 1.4 kg s−1 total gas production rate at the source. To account for the long exposure times the simu-lation results were also integrated between t = 0−45 s for the first and t= 130−175 s for the second image. As above, a power law differential size distribution characterized by an exponent of g = 2.6 was chosen for this run. This boundary condition let the outer edge of the dust cloud move at an average veloc-ity of about 9 m s−1while the inner part slowly evolves towards A89, page 7 of10
Fig. 12.Simulated images integrated between t= 0−45 s and t = 130−175 s (to simulate the long exposures of the UV-375 nm images) for two different source functions. In the left panels a) and b) the production rate is kept constant during the whole simulation, on the right (c) and d)) the production was stopped at t= 5 s. In this case the moving dust cloud has detached from the source at t = 130−175 s and a rather flat brightness distribution can be seen.
a steady state. On the right, we show for comparison the case with a short strong production pulse of 28 kg s−1which is lasting for a duration of about 5 s. In the beginning the simulated image is qualitatively similar except for the higher column density due to the larger production rate but after 150 s the picture is com-pletely different. The expanding dust cloud has clearly detached from the source and the whole brightness distribution is much flatter than for the constant production case. It should be noted that this general behavior is not dependent on the size distribu-tion, only the distance of the brightness maximum and the degree of flatness changes. Comparing these results with the OSIRIS images it is obvious that the constant production case matches the observations much better.
Since the outflow speed of the dust is a function of parti-cle size, the simulation of the dust cloud can also be used to de-rive clues about the size distribution. This was achieved by sys-tematically varying the size distribution exponent and the dust production rate and fitting the observed radiance on the axis of the main jet (see Fig.4where the jet axis is shown as a white line). Here, we only used the two UV-375 nm difference images for the analysis because these are not dependent on assumptions about the reddening of the dust and have a superior S/N ratio compared to the 610 nm image. Furthermore, the last VIS-610 nm image was taken immediately after the long UV-375 nm expose and thus provides little additional information about the transient development of the jet. Another important point that has to be taken into account is that the dust travels for some time in the shadow cast by the nucleus before it becomes vis-ible in the images (see right side of Fig.3). The consequence is that the true start time of the event is uncertain. Therefore, the start time was used as another free parameter and also deter-mined simultaneously by the fitting procedure. In the following examples we always used a viewing angle of 75◦ which corre-sponds to a case where the jet leaves its source normally to the average orientation of Imhotep. The distance range chosen for the fit is between 0.4 km and 2.0 km from the source, because for shorter distance the dust cloud is partially in shadow whereas
for larger distance the measured brightness drops below the un-certainty limit of the observation.
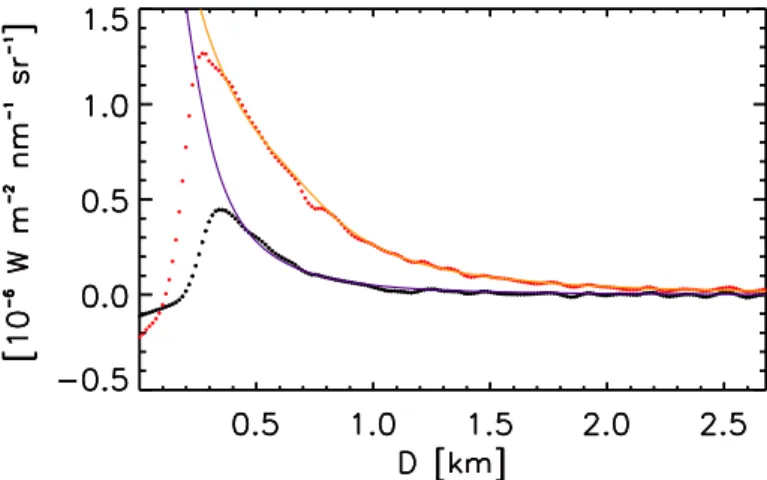
We first tried to match the observations assuming that the size distribution could be described by a single exponent over the whole size range from 10 µm to 1 cm, but no good fit was possible with these assumptions. Then we varied the maxi-mum dust radius between 0.5 mm and 1 cm. Good fits could be achieved with these assumptions for a narrow size range around amax = 1 + /0.1 mm (Fig. 13), a size distribution exponent of 2.6+/−0.2, a dust production rate of 0.9+/−0.1 kg s−1 , and a jet start time at t = −65+/−10 s. This means that the out-burst started between 7:11:53 and 7:12:13 UTC and the corre-sponding dust-to-gas ratio is D/G = 0.66+/−0.07. With these parameters both radiance profiles of the UV-375 nm difference images acquired at t= 0−45 s and t = 130−175 s, respectively, are fitted well within the 1-sigma uncertainty of the difference images as shown in Fig.13.
The fit parameters determined above are not unique, and ac-cording toRotundi et al.(2015) the size distribution of the coma grains of 67P is better described by a “knee”-like distribution which is characterized by two different exponents, g < 3 for the small grains and g ∼ 4 for the larger grains. Therefore, we also tried to fit the observations with such a size distribution. Here, we kept g = 4 for the large size range constant, but var-ied the corner grain radius, the exponent of the small grains, and the maximum grain radius. It was found that good fits are indeed possible and that the fit quality is very sensitive to the chosen cor-ner size, only corcor-ner sizes close to 0.5 mm provided fits within the uncertainty range of the observations. Furthermore, the fit quality was not strongly dependent on the maximum dust size. Maximum dust radii between 3 mm and 1 cm all match the data equally well. This is due to the low velocity of about 2−4 m s−1 of the large particles. This means that most of them have not yet entered the region with a distance d > 0.4 km where reliable data exists which is not affected by shadowing from the nucleus and, therefore, was used for the analysis. Because of the limited influence of the maximum grain radius on the quality of the fit
J. Knollenberg et al.: A mini outburst from the nightside of comet 67P
Fig. 13.Model fits of radiance distribution along the jet axis (orange and blue lines) with the data (red and black dots) for the first two (UV-375 nm) difference images. Fit parameters are the size distribution exponent, the dust production rate, and the start time of the outburst. The best fit shown was achieved for an exponent of g= 2.6 and a start time of t= −75 s (zero time defined as start of exposure of first image).
the dust-to-gas ratio is less well constrained and varies between D/G = 1 for rmax= 2 mm and D/G = 1.8 for rmax= 1 cm. The best fit exponent for the grains with radius<0.5 mm varies be-tween g= 1.7 and g = 2.4 whereas the offset time is again in the range 55−75 s, the same as found for the simple power law size distribution with rmax= 1 mm.
In principle, the viewing angle has also an influence on the derived fit parameters but within the probable range be-tween 70−90◦ that is compatible with the observed angular width of the jet the effect of the viewing angle was found to be rather small and within the uncertainties due to the assumptions about the size distribution.
5. Discussion and conclusion
The root cause for cometary outbursts is currently not known but several mechanisms are proposed in the literature. Amongst the suggested mechanisms are fluidization of a weakly bound mixture of ice and dust initiated by a phase change boundary be-tween amorphous and crystalline ice (Belton & Melosh 2009), cryovolcanism (Belton 2008) and impacts of small meteorites (Hughes 1999). They are usually thought to be initiated by a kind of “explosion” (e.g. the conceptual model inBelton 2008) possibly followed by a more or less extended phase of con-stant or gradually fading activity. In this respect it should be noted that a hypervelocity impact or an explosion on the sur-face or shallow subsursur-face produce very similar phenomena (Holsapple 1993), and, therefore, could hardly be distinguished from each other. Both would generate an initial fireball followed by fast ejecta. Thereafter, the considerably longer excavation of a crater produces an ejecta cone which moves from the source lo-cation radially outwards, thereby producing ejecta with decreas-ing speed until the process stops either due to the strength of the material or due to gravity. In our case we have a small event equivalent to a crater diameter of approximately 1 m (based on the estimate of the produced mass of a few 100 kg) which would mean that cratering should happen in the strength domi-nated regime (even if the strength is only a few 10 Pa) and the formation of the crater of approximately 1 m diameter should be finished in less than 1 s.
Although the onset of the observed small outburst in the Imhotep region of 67P is indeed rather fast and the observed relatively low speeds of the outflowing dust could be compati-ble with an explosion in a low strength medium, the appearance of the jet and its evolution in time are not compatible with an explosive origin. The best comparison here can be made with the “Deep Impact” (DI hereafter) on comet 9P/Tempel-1 where a 370 kg artificial impactor impacted the comet at a speed of 10.2 km s−1causing an impressive ejecta plume (A’Hearn et al. 2005). Although this event was much larger than the one consid-ered here, the impact speed, the target properties, and the crater-ing regime are applicable.
Although our main jet is quite broad with a FWHM of ~30◦, the DI impactor on comet 9P/Tempel-1 generated a much broader plume. This is also typical for cratering in a wide range of materials where ejection angles (measured from the horizon-tal) between 30−60◦ are found (Richardson et al. 2007). This corresponds to full opening angles of typically 90◦ which is hardly compatible with our observation. Furthermore, in the modelling section we have shown that the expansion of a dust cloud that is ejected approximately instantaneously and moving with the relevant speeds would result in a considerably flattened brightness distribution in the jet and that the maximum of bright-ness at the end of the observation sequence should have already detached from the source. This is not compatible with the ob-servations which are instead in accordance with a constant pro-duction model. Therefore, we can conclude that the origin of the observed mini outburst was no explosion.
On the contrary, the results of the dust outflow computations presented above, clearly favor a mechanism which is triggered at some point and then produces gas and dust at a more or less constant production rate for some time (at least 4 min and prob-ably less than 30 min in our case) until the production ceases again. One possibility to create such process involves release of a volatile gas (CO or CO2) trapped in water ice during the pas-sage of a crystallization front changing the phase of the water ice from amorphous to crystalline. According to Prialnik et al. (1993) this can lead to internal pressure build-up which may be large enough to widen the pores, and, dependent on the mechan-ical material properties of the ice/dust mixture, the final result could be either the opening of large vents with typical diameters of the order of 1 m which extend from the interior to the surface, or, in extreme cases even lead to catastrophic run-away growth manifesting itself in an explosive outburst. The latter scenario was favored byBelton(2008) to explain mini-outbursts observed in 9P/Tempel-1 but since we found a non-explosive outburst the former mechanism might apply in our case. Recent work on ther-mal comet evolution models using lower therther-mal conductivity values as usually employed in the past find that the crystalliza-tion front may be located at rather shallow depths of the order of 0.5 to several meters (Marboeuf & Schmitt 2014) and also might be locally inhomogeneous dependent on the initial composition and structure of the nucleus (Rosenberg & Prialnik 2010). These findings make this explanation more attractive in our case be-cause it is difficult to imagine that such a small event has its origin deep inside the nucleus as would be required by older cal-culations of the depth of the crystallization front.
Another possible mechanism found byRosenberg & Prialnik (2010) is that erratic activity and outbursts which occur more or less randomly distributed over the orbit and local time may be the consequence of internal inhomogeneity of the nucleus struc-ture and composition. Although the diverse interactions of their different inhomogeneities are very complex it seems that a low conductivity layer blocking further penetration of the heat wave A89, page 9 of10
beneath an ice rich upper layer could promote small outbursts. Here, we may have a relation to the areas with low spectral slopes and classified as active byOklay et al.(2016) which are found in our source region because the low spectral slopes may be indicative of a larger ice content at or close to the surface. It is also remarkable that the suspected source region contains a number of circular features which may be dormant gas conduits and that circular features were also suggested as sources of the outbursts of 9P/Tempel-1 byBelton(2008).
The size distribution exponent found by the dust flow mod-eling lies in the expected range for 67P although we can-not definitely be sure about the true size range. This becomes clear by inspection of the equation of motion for the dust particles (Kitamura 1986). The acceleration of a dust parti-cle is proportional to the product of the gas density and the cross section over mass ratio of the particle. This implies that a 10 times smaller particle than used in our simulation would fol-low exactly the same trajectory if the gas production rate and the corresponding gas density would also be 10 times smaller. Since we have no measurement of the amount of gas ejected we can only derive information about the size dependence but not about the true size. On the other hand, the assumptions made about the albedo variations of the dust between the 375 nm and the 610 nm filters are compatible with normally found dust colors in the coma of 67P (Cremonese et al. 2016) which is an indication that the ejected particles are typical for the comet. It is worth noting that the observed brightness distribution cannot be fitted with the assumption of a single characteristic size, the power law size dis-tribution works considerably better. The best estimate for the size distribution exponent is g = 2.6+/−0.2 if a power law distribu-tion with a maximum grain radius of 1 mm is assumed, but the observations are also compatible with a size distribution with a “knee” characterized by two different exponents for the smaller and the larger particles, as found byRotundi et al.(2015) for the coma of 67P at heliocentric distances>3.4 AU. The dust-to-gas ratio is about 0.7 for amax= 1 mm but increases up to D/G = 1.8 if the jet has a Rotundi-like size distribution with a maximum grain radius of 1 cm. It is worth noting that in contrast to the real grain size (which scales with the unknown gas production of the outburst) the determined D/G ratios are not dependent on the assumptions about the gas production rate. The derived D/G ra-tio for the outburst is remarkably lower than the value of 2−6 found byRotundi et al.(2015) for the average coma dust, espe-cially if one considers that a nightside outburst is most probably driven by higher volatile species like CO2or CO. This points to the existence of localized pockets with an enriched abundance of ices including highly volatile species in the shallow subsurface of Imhotep.
Acknowledgements. OSIRIS was built by a consortium of the Max-Planck-Institut für Sonnensystemforschung, in Göttingen, Germany, CISAS-University of Padova, Italy, the Laboratoire d’Astrophysique de Marseille, France, the In-stituto de Astrofísica de Andalucia, CSIC, Granada, Spain, the Research and Scientific Support Department of the European Space Agency, Noordwijk, The Netherlands, the Instituto Nacional de Técnica Aeroespacial, Madrid, Spain, the Universidad Polite?hnica de Madrid, Spain, the Department of Physics and Astronomy of Uppsala University, Sweden, and the Institut für Datentech-nik und KommuDatentech-nikationsnetze der Technischen Universität Braunschweig, Ger-many. The support of the national funding agencies of Germany (DLR), France (CNES), Italy (ASI), Spain (MEC), Sweden (SNSB; Grant No. 74/10:2), and the ESA Technical Directorate is gratefully acknowledged. H. Rickman was also supported by Grant No. 2011/01/B/ST9/05442 of the Polish National Sci-ence Center. We thank the ESA teams at ESAC, ESOC and ESTEC for their work in support of the Rosetta mission.
References
Auger, A. T., Groussin, O., Jorda, L., et al. 2015,A&A, 583, A35, 13
A’Hearn, M. F., Belton, M. J. S., Delamere, W. A., et al. 2005,Science, 310, 258
Belton, M. J. S. 2008,Icarus, 200, 280
Belton, M. J. S., & Melosh, J. 2009,Icarus, 198, 189
Cremonese, G., Simioni, E., Ragazzoni, R., et al. 2015,A&A, 588, A59, 8
Farnham, T. L., Wellnitz, D. D., Hampton, D. L., et al. 2007,Icarus, 187, 26
Fornasier, S., Hasselmann, P. H., Barucci, M. A., et al. 2015,A&A, 583, A30
Fulle, M., Marzari, F., Della Corte, V., et al., 2016,AJ, 821, 1, 19
Harten, A., Lax, P. D., & van Leer, B. 1983,Soc. Indus. Applied Math. Rev., 25, 35
Holsapple, K. A. 1993,Ann. Rev. Earth Planet. Sci., 21, 333
Hughes, D. W. 1999, Possible mechanisms for cometary outbursts, eds. R. L. Newburn Jnr., M. Neugebauer, J. Rahe, Comets in the Post-Halley Era, 2, (Dordrecht: Kluwer Academic Publishers), 825
Jorda, L., Gaskell, R., Capanna, C., et al. 2016,Icarus, 277, 257
JCGM 2013, Evaluation of measurement data – Guide to the expression of un-certainty in measurement and supplements, ed. J. C.f.G.i. Metrology (Sèvres, France: BIPM)
Keller, H. U., Barbieri, C., Lamy, P., et al. 2007,Space Sci. Rev., 128, 433
Kitamura, Y. 1986,Icarus 66, 241
Knollenberg, J. 1994, Ph.D. Thesis, Georg-August Universität Göttingen, Germany
Kolokolova, L., Hanner, M., Levasseur-Regourd, A. C., & Gustafson, B. A. S. 2004, in Comets II, eds. M. C. Festou, H. U. Keller, H. A. Weaver (University of Arizona Press), 577
Koppenwallner, G., Boettcher, R. D., Detleff, G., & Legge, H. 1986, ESA-ESTEC ESA-SP 265
Lin, Z. Y., Lin, C. S., Ip, W.-H., et al. 2009,AJ, 138 2, 625
Marboeuf, U., & Schmitt, C. 2014,Icarus, 242, 225
Oklay, N., Vincent, J.-B., Fornasier, S., et al. 2016,A&A, 586, A80
Preusker, F., Scholten, F., Matz, K. D., et al. 2015,A&A, 583, A33
Prialnik, D., Egozi, U., Bar-Nun, A., Podolak, M., & Greenzweig, Y. 1993,
Icarus, 106, 499
Richardson, J. E., Melosh, H. J., Lisse, C. M., et al. 2007,Icarus, 190, 357
Rotundi, A., Sierks, H., della Corte, V., et al. 2015,Science, 347, Iss. 6220
Rosenberg, E. D., & Prialnik, D. 2010,Icarus, 209, 753
Sierks, H., Barbieri, C., Lamy, P., et al. 2015,Science, 347, Iss. 6220
Thomas, N., Sierks, H., Barbieri, C., et al. 2015,Science, 347, Iss. 6220
Tubiana, C., Snodgrass, C., Bertini, I., et al. 2015a,A&A, 573, 11