HAL Id: hal-00317901
https://hal.archives-ouvertes.fr/hal-00317901
Submitted on 14 Oct 2005
HAL is a multi-disciplinary open access
archive for the deposit and dissemination of
sci-entific research documents, whether they are
pub-lished or not. The documents may come from
teaching and research institutions in France or
abroad, or from public or private research centers.
L’archive ouverte pluridisciplinaire HAL, est
destinée au dépôt et à la diffusion de documents
scientifiques de niveau recherche, publiés ou non,
émanant des établissements d’enseignement et de
recherche français ou étrangers, des laboratoires
publics ou privés.
The accuracy of using the spectral width boundary
measured in off-meridional SuperDARN HF radar
beams as a proxy for the open-closed field line boundary
G. Chisham, M. P. Freeman, T. Sotirelis, R. A. Greenwald
To cite this version:
G. Chisham, M. P. Freeman, T. Sotirelis, R. A. Greenwald. The accuracy of using the spectral width
boundary measured in off-meridional SuperDARN HF radar beams as a proxy for the open-closed
field line boundary. Annales Geophysicae, European Geosciences Union, 2005, 23 (7), pp.2599-2604.
�hal-00317901�
SRef-ID: 1432-0576/ag/2005-23-2599 © European Geosciences Union 2005
Annales
Geophysicae
The accuracy of using the spectral width boundary measured in
off-meridional SuperDARN HF radar beams as a proxy for the
open-closed field line boundary
G. Chisham1, M. P. Freeman1, T. Sotirelis2, and R. A. Greenwald2
1British Antarctic Survey, Natural Environment Research Council, High Cross, Madingley Road, Cambridge, CB3 0ET, UK 2Applied Physics Laboratory, Johns Hopkins University, 11100 Johns Hopkins Road, Laurel, MD 20723, USA
Received: 10 December 2004 – Revised: 21 June 2005 – Accepted: 30 June 2005 – Published: 14 October 2005
Abstract. Determining reliable proxies for the ionospheric
signature of the open-closed field line boundary (OCB) is crucial for making accurate measurements of magnetic re-connection. This study compares the latitudes of spectral width boundaries (SWBs) measured by different beams of the Goose Bay radar of the Super Dual Auroral Radar Net-work (SuperDARN), with the latitudes of OCBs determined using the low-altitude Defense Meteorological Satellite Pro-gram (DMSP) spacecraft, in order to determine whether the accuracy of the SWB as a proxy for the ionospheric projec-tion of the OCB depends on the line-of-sight direcprojec-tion of the radar beam. The latitudes of SWBs and OCBs were identi-fied using automated algorithms applied to 5 years (1997– 2001) of data measured in the 1000–1400 magnetic local time (MLT) range. Six different Goose Bay radar beams were used, ranging from those aligned in the geomagnetic meridional direction to those aligned in an almost zonal di-rection. The results show that the SWB is a good proxy for the OCB in near-meridionally-aligned beams but be-comes progressively more unreliable for beams greater than 4 beams away from the meridional direction. We propose that SWBs are identified at latitudes lower than the OCB in the off-meridional beams due to the presence of high spec-tral width values that result from changes in the orientation of the beams with respect to the gradient in the large-scale ionospheric convection pattern.
Keywords. Ionosphere (Instruments and techniques; Plasma convection) – Magnetospheric physics (Magne-topause, cusp and boundary layers)
1 Introduction
Many large-scale processes in the magnetosphere are best measured remotely from the ionosphere. An important
ex-Correspondence to: G. Chisham
ample is magnetic reconnection at the magnetopause or in the magnetotail, and the associated addition and removal of open magnetic flux from the magnetospheric system (Baker et al., 1997; Milan et al., 2003; Pinnock et al., 2003; Chisham et al., 2004b). Reconnection analyses typically require accu-rate measurements of the boundary between closed geomag-netic field lines with both foot points on the Earth, and open geomagnetic field lines with one end connected to the In-terplanetary Magnetic Field (IMF). This boundary is known as the Open-Closed field line Boundary (OCB), although its ionospheric projection is also known as the polar cap bound-ary.
Various observational signatures have been used to iden-tify the OCB. A widely used proxy for the OCB is the Spec-tral Width Boundary (SWB) measured by the Super Dual Auroral Radar Network (SuperDARN) (Baker et al., 1995, 1997; Chisham et al., 2001, 2002). The Doppler spectral width is thought to be a measure of the spatial and temporal structure of the ionospheric electric field. The SWB is a lat-itudinal transition between radar backscatter with high and variable Doppler spectral width values, typically observed at high latitudes, and that with low Doppler spectral width values, typically observed at low latitudes (Chisham et al., 2001). This SWB is readily observed at all magnetic local times, during all geomagnetic conditions (Chisham and Free-man, 2004), and can be identified using objective automated algorithms (Chisham and Freeman, 2003).
A significant advantage of the SWB is that it has the po-tential to provide measurements of the OCB at good resolu-tion and with extensive coverage in time and space, in con-trast to localised and infrequent identifications by spacecraft. The maximum possible spatial coverage would be achieved if the SWB was a reliable proxy for the OCB at any posi-tion within the radar field of view. However, comparisons between SWBs and OCBs identified in precipitating parti-cle observations made by the low-altitude Defense Meteo-rological Satellite Program (DMSP) spacecraft have mainly used spectral width data from SuperDARN beams closely
2600 G. Chisham et al.: Off-meriodional SuperDARN spectral width boundaries
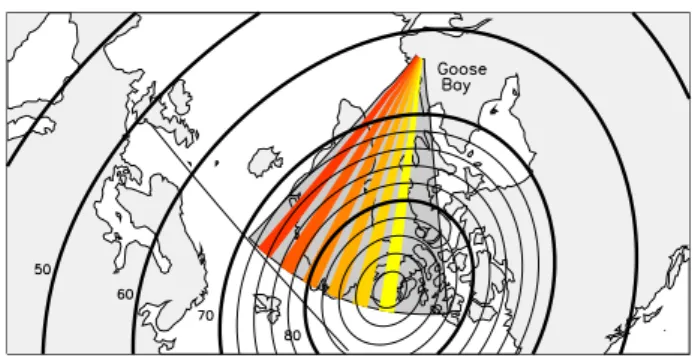
Fig. 1. Map showing the field of view of the Goose Bay radar as
used in this study. Highlighted are the 6 beams used - beam 4 (yel-low), through beams 6, 8, 10, and 12, to beam 14 (red). The thick black lines represent contours of constant Altitude-Adjusted Cor-rected GeoMagnetic (AACGM) latitude at 10◦intervals (latitudes as shown). The thinner black lines represent contours of constant AACGM latitude at 2◦intervals.
aligned with a geomagnetic meridian (Baker et al., 1990, 1995; Chisham et al., 2004a, 2005). For meridional beams, the SWB has been shown to be a reliable proxy for the OCB in the noon (cusp) sector (Baker et al., 1995; Chisham et al., 2005) and in the pre-midnight sector (Chisham et al., 2004a), but it is shifted ∼3◦–4◦equatorward of the OCB across much of the morning sector (∼02:00–08:00 magnetic local time (MLT)) (Chisham et al., 2005).
The SuperDARN radars each operate with 16 different beam directions, each separated from the next by an angle of 3.26◦at the point of origin. Across the SuperDARN net-work, beams are oriented in a range of directions from being meridionally aligned to zonally aligned. Some studies have used measurements of the SWB in off-meridional beams as a proxy for the OCB (Woodfield et al., 2002; Hosokawa et al., 2003, 2004; Parkinson et al., 2004). However, it is unknown if these measurements are reliable. In a modelling study, Vil-lain et al. (2002) showed that regions of high spectral width can occur equatorward of the OCB in off-meridional beams. They argued that the orientation of a beam with respect to the large-scale ionospheric convection pattern results in sig-nificant differences between the spectral width measured on meridional and off-meridional beams. They modelled the in-crease in spectral width expected to occur due to these geo-metrical effects for beam 4 (meridional) and beam 12 (off-meridional) of the Goose Bay radar. Whereas the increase in spectral width due to these effects on beam 4 was always less than 100 m/s, that on beam 12 was much larger, increasing to
∼300 m/s at the furthest range gates. As high spectral width values on these off-meridional beams may be observed far equatorward of the OCB, this suggests that SWBs on these beams may also be observed far equatorward of the OCB, and hence, that SWBs may be an unreliable proxy for the OCB for some off-meridional beams.
This paper compares SWBs from 6 different beams of the Goose Bay radar, oriented at various angles to the meridional direction, with OCBs measured by the DMSP spacecraft in
the noon-sector (cusp) ionosphere where it has been shown that the SWB from the meridional beam is a reliable proxy for the OCB. The objective of this analysis is to determine if the SWB determined in off-meridional beams is also a reli-able proxy for the OCB.
2 Technique
In this paper we make use of reliable algorithms which make automated objective identifications of the SWB (in Super-DARN radar data) and the OCB (in DMSP particle precip-itation data). We employ the “C-F threshold technique” to identify the SWB (Chisham and Freeman, 2003, 2004). The application of this technique is fully detailed in Chisham et al. (2004a, 2005). In brief, the technique involves choos-ing a spectral width threshold value above which the spectral width values are more likely to originate from the distribu-tion of spectral width values typically found poleward of the SWB than from the distribution typically found equatorward of the SWB, and searching poleward along a radar beam un-til this threshold is exceeded. Previous work (Chisham and Freeman, 2004; Chisham et al., 2004a, 2005) has shown that spectral width thresholds in the range 150–200 m/s provide the best estimates of the SWB. The spectral width data are preprocessed before the application of the identification al-gorithm by spatially and temporally median filtering the data. This preprocessing increases the accuracy of the estimation of the SWB location.
We have applied the C-F threshold technique to 5 years of spectral width data (1997–2001 inclusive) from 6 different beams of the Goose Bay SuperDARN radar. The method of compilation of the boundary databases is described in detail in Chisham et al. (2005). The Goose Bay radar was chosen for this study as it has beam directions ranging from merid-ional to zonal within the latitude range where the OCB is typically observed. In Fig. 1 we present the field of view of the Goose Bay radar, highlighting the beams used in this study-beams 4 (yellow), 6, 8, 10, 12, and 14 (red). The thick black lines present contours of equal Altitude-Adjusted Cor-rected GeoMagnetic (AACGM) latitude, separated by 10◦. The thinner black lines represent similar contours separated by 2◦intervals between 70◦and 90◦AACGM latitude. Fig-ure 1 shows that beam 4 is aligned approximately perpendic-ular to the lines of constant AACGM latitude, whereas beam 14 is aligned at more oblique angles, becoming aligned ap-proximately parallel to a line of constant AACGM latitude at the furthest ranges. The more zonal beams never reach the higher latitude regions. The maximum latitude sampled by the radar beams decreases with increasing beam number, be-ing 90◦, ∼87◦, ∼84◦, ∼81◦, ∼78◦, and ∼75◦for beams 4, 6, 8, 10, 12, and 14 respectively. This is important as it con-strains the maximum possible SWB latitude for each beam.
In this study we make use of OCB measurements from 5 DMSP spacecraft (F11-15), identified in particle measure-ments from the same 5-year interval (1997–2001). The boundaries we use are based on the automated dayside region
identification algorithms outlined by Newell et al. (1991) and are determined using the method outlined in Sotirelis and Newell (2000). In brief, the OCB is located where there is an unambiguous transition between open and closed field line precipitation regions. Central plasma sheet, boundary plasma sheet, and the low-latitude boundary layer (LLBL) are taken to be closed, and cusp, mantle, open LLBL, polar rain, and void are considered to be open. If a transition is not clear, because of ambiguities in the region locations, then the transition is not added to the data set.
The data comparison technique is outlined in full detail in Chisham et al. (2004a, 2005). In brief, taking the SWBs for each beam in turn, each OCB observation was matched with the closest SWB obtained within ±10 min UT of the OCB observation. The SWB observation must also have been within ±1 h of MLT of the OCB observation to produce a matched boundary pair. For each matched pair, the dif-ference between the two boundary latitudes was determined. Distributions of these latitude differences were determined for each beam by combining the results from all the matched pairs observed within the 5-year interval.
3 Results
In Fig. 2 we show the occurrence distributions of the lati-tude differences between the OCB and the 150 m/s threshold SWB for the 6 beams from the Goose Bay radar, from data measured in the 1000–1400 MLT region. We have chosen the 1000–1400 MLT region for this analysis as the SWB on meridional beams has been shown to be a good OCB proxy here, there is good overlap in coverage between the Goose Bay SWBs and the DMSP OCBs in this region (Chisham et al., 2005), and also because the SWB is well defined in this region and has a minimal dependence on the spectral width threshold used. The distributions are presented in the form of a stackplot ranging from beam 4 in the top panel a (yellow), to beam 14 in the bottom panel f (red). The distributions have a latitudinal resolution of 2◦to provide reliable statistics in most bins for each beam. Latitude differences are measured as the OCB latitude minus the SWB latitude (given by the blue vertical line at zero latitude difference). The figure also details the number of matched pairs that make up the differ-ence distributions for each beam (n) and the percentage of difference values that are within 3◦of zero difference (p).
A clear pattern is evident in the results presented in Fig. 2. The distributions for beams 4, 6, and 8 (panels a to c) peak very close to the zero latitude difference. The median val-ues of the distributions are highlighted by the vertical green dashed lines in each panel, and are located within 0.5◦of zero latitude difference for these three beams. The widths of the distributions do show that there is an appreciable amount of scatter around the 0◦latitude difference. However, there are a number of aspects of the identification and analysis pro-cesses which introduce random errors in the measurements and which can account for this spread, as explained in detail
Fig. 2. Occurrence distributions of latitudinal differences between
the DMSP OCBs and the 150 m/s threshold SWB for a number of different beams from the Goose Bay radar for the 1000–1400 MLT region. The distributions come from (a) beam 4, (b) beam 6, (c) beam 8, (d) beam 10, (e) beam 12, and (f) beam 14. The verti-cal blue line at 0◦latitude difference represents the location of the 150 m/s threshold SWB. The vertical green dashed lines represent the median values for each distribution. Also shown are the number of matched pairs that make up the difference distributions for each beam (n), and the percentage of the difference values that are within 3◦of zero difference (p).
by Chisham et al. (2005). Hence, these distributions suggest that the SWBs are statistically co-located with the OCB.
2602 G. Chisham et al.: Off-meriodional SuperDARN spectral width boundaries
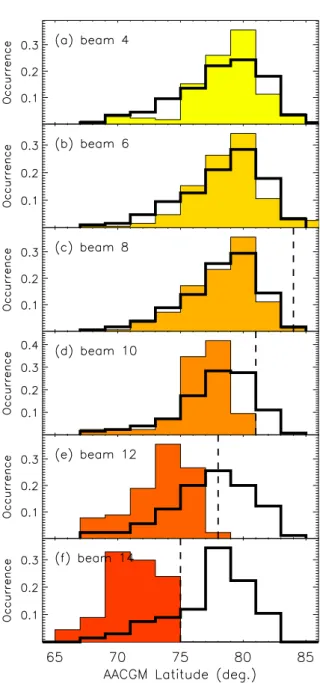
Fig. 3. Percentage occurrence distributions of the latitudinal
lo-cations of the SWB determinations (shaded histograms) and the DMSP OCB determinations (bold black histograms) for the dif-ferent beams from the Goose Bay radar for the 1000–1400 MLT region. The distributions come from (a) beam 4, (b) beam 6, (c) beam 8, (d) beam 10, (e) beam 12, and (f) beam 14. The dashed vertical lines represent the maximum possible SWB latitudes for beams 8–14.
For beams 10, 12, and 14 (panels d to f), the centre of the latitude difference distribution (the median value shown by the green dashed line) becomes increasingly shifted away from zero with increasing beam number. For beam 14, the SWBs are being identified, on average, 6.4◦equatorward of the true OCB. The latitude difference distribution has also become more spread. For beams 4–8 more than 75% of
the latitude difference values were located between −3◦and 3◦. For beams greater than beam 8 this percentage decreases until only 18% of latitude difference values are located be-tween −3◦ and 3◦for beam 14. The figure also shows that for beams greater than beam 8, increasingly fewer SWBs are identified with increasing beam number (reducing from 180 SWBs for which a latitude difference value could be calcu-lated for beam 8, to 67 for beam 14). Overall, the results in Fig. 2 suggest that SWBs measured in beams ≥10 of the Goose Bay radar cannot be relied upon to be co-located with the OCB.
In Fig. 3 we present the results in an alternative way to pro-vide more information about the distribution of the bound-ary locations measured in each of the beams. The panels in Fig. 3 are ordered from a (beam 4) to f (beam 14), as in Fig. 2. Each panel presents the latitudinal probability distri-bution of the observed SWBs for which a latitude difference value could be calculated (shaded histograms with 2◦ latitu-dinal resolution), and the latitulatitu-dinal probability distribution of the OCBs that the SWBs were matched with (bold black-lined histograms, again with 2◦latitudinal resolution). The dashed vertical lines represent the maximum possible SWB latitudes for beams 8–14, as discussed in Sect. 2.
From the results in Fig. 3 we note the following points: 1. For beams 4, 6, and 8, the distributions of SWB
loca-tions are similar to the distribuloca-tions of OCB localoca-tions. This suggests that the SWBs and OCBs are well corre-lated for these beams as suggested from Fig. 2.
2. The distributions of the OCB latitudes are similar for all beams, and are also similar to the total distribution of the OCB latitudes measured by the DMSP spacecraft during the 5-year interval (not shown). This implies that the distributions of OCBs at the times that SWBs were measured represent an approximately unbiased sample of the OCB distribution, for all beams.
3. If the SWBs measured in beams 10, 12, and 14 were accurately identifying the OCB then we would expect the OCB and SWB distributions to be the same but to be both cut off at the dashed lines. For the instances when the OCB was poleward of this line no SWB would be detected on this beam. This is not the case and hence, in these instances, an erroneous SWB determination has certainly been made.
4. The latitudinal distribution of the SWB locations moves to increasingly lower latitudes for the higher beam num-bers and the number of observed SWBs at low lati-tudes increases relative to the number of corresponding OCBs. For beam 14, most of the corresponding OCBs at these times are located poleward of the maximum ob-serving latitude for SWBs. Hence, the SWBs identified in these off-meridional beams are due to high spectral width values occurring far equatorward of the OCB.
4 Discussion
Enhancements in the spectral width measured by the Super-DARN radars can generally be viewed as originating from 1) velocity structure (either spatial or temporal) on the sub-range gate scale, and 2) velocity structure (either spatial or temporal) on a larger (global) scale. We propose that the high spectral width values that occur equatorward of the OCB in off-meridional beams are a result of geometrical effects as-sociated with the radar beam orientation with respect to the global-scale ionospheric convection pattern, as suggested by Villain et al. (2002), and are not due to structure on scales less than the radar sampling scales, as is thought to be the case with large spectral width values poleward of the OCB. The dimension of a range gate cell in the beam-aligned direc-tion is 45 km during intervals of SuperDARN common mode operation. The angular width of the beam is constant and hence the width of the range gate cells is proportional to the range. The width also varies with the frequency of the radar operation but typically varies from ∼50 km at low ranges to
∼200 km at far ranges. Thus, generally, the dimension of a range gate cell is greater in the direction perpendicular to the beam. For much of the polar ionospheres the global-scale convection velocity gradient has its largest component in the meridional direction. For meridional beams, the smallest di-mension of the range gate cell is aligned in this direction and so any increase in spectral width due to the global-scale lat-itudinal velocity gradient within the range gate cell is min-imised. As beams become increasingly off-meridional the latitude range covered by the range gate cells increases (a zonally-aligned beam would have its largest range gate cell dimension aligned in the meridional direction). Hence, these range gate cells will measure a larger portion of the latitudi-nal velocity gradient and hence, this contribution to the mea-sured spectral width will be greater. Since the C-F threshold technique searches poleward up a beam, and identifies the first SWB that it encounters, any grouping of high spectral width values at latitudes equatorward of the OCB due to this effect will result in the SWB being an erroneous proxy for the OCB.
It is possible for us to make a rough comparison of our results with the modelling results of Villain et al. (2002) that were discussed in the introduction. Villain et al. (2002) modelled the increase in spectral width expected to occur in different Goose Bay radar beams as a result of veloc-ity gradients in the large-scale ionospheric convection pat-tern. Considering a model ionospheric convection pattern they predicted that the increase in spectral width in beam 4 (meridional) would be approximately constant at all ranges, whereas that in beam 12 (more zonal) would be greater at the further ranges. Villain et al. (2002) showed that the in-creases in spectral width became greater in the 70◦–75◦ lati-tude range for beam 12 and peaked between 75◦and 78◦ lat-itude (the maximum latlat-itude for this beam). Our results for beam 12 (Fig. 3e) show a clear increase in erroneous SWB determinations in the 71◦–77◦latitude range, clearly agree-ing with the predictions of Villain et al. (2002).
Our study has concentrated on the measurement of dayside SWBs only. There are several factors which preclude a sim-ilar study on SWBs measured in the nightside ionosphere. Due to aspects of the DMSP spacecraft orbits, as explained in Chisham et al. (2005), it is only possible to perform a com-parative DMSP and SuperDARN study on the nightside us-ing data from one of the southern hemisphere SuperDARN radars. Unfortunately, there is no radar that meets both the criteria of 1) having a wide range of beam orientations from the meridional to zonal, and 2) overlapping with the DMSP observations in the crucial 2000 MLT to 0200 MLT range. However, there is no reason to suspect that the results that we have presented from Goose Bay on the dayside should not be applicable to measurements made in the nightside ionosphere as well.
Finally, it is important to discuss how our results affect our ability to use measurements of SWBs as proxies for the OCB on a case-to-case basis. It is clear that only SWBs from meridionally-pointing radars should be used as OCB proxies. For those SuperDARN radars whose central beams are meridionally-aligned (such as Halley and CUTLASS Fin-land), there is the potential for using SWBs measured across almost all the field-of-view of the radars. The spread of the latitude difference distributions between the SWB and the OCB in Fig. 2 might suggest that, although there is a good statistical relationship between the two boundaries, the SWB might not be totally reliable on a case-to-case basis. How-ever, these difference distributions are misleading and the true spread of the latitude difference distributions is smaller than these distributions imply. Most of the observed spread in the distributions is due to the use of a finite (1-h) MLT win-dow in the data comparisons (this is needed to have enough matched pairs to achieve a reliable statistical result). Re-ducing the size of this MLT window decreases the width of the difference distributions, as discussed in Chisham et al. (2004a). Hence, the spread in the distributions can be as-sumed to be predominantly a result of random errors in the data comparison. The uncertainty in the measurement of the location of the SWB is ∼1–2 range gates (∼0.5–1◦latitude) (Chisham and Freeman, 2003). We would propose that this also represents a good estimate for the uncertainty of the OCB determined from the SWB measurements.
5 Conclusions and Summary
We conclude that, in the 1000–1400 MLT region, the SWB is a good proxy for the OCB in near-meridionally-aligned beams. For Goose Bay this represents beams 0–8. In gen-eral, for other SuperDARN radars, we would suggest that this extends up to ∼4–5 beams either side of the meridional beam. The usage of SWB proxies on beams aligned further away from the meridional direction becomes increasingly more suspect for increasingly zonal beams. High spectral width values at low latitudes on these beams, which proba-bly result from the orientation of the beam with respect to large-scale ionospheric convection velocity gradients, result
2604 G. Chisham et al.: Off-meriodional SuperDARN spectral width boundaries in SWBs which are unrelated to the OCB. We expect that
these rules will apply to other MLT sectors where it has been shown that the SWB is a good proxy for the OCB in merid-ional beams.
Acknowledgements. Support for the Goose Bay radar is provided in part by the NSF (USA), and in part by NASA (USA). The DMSP particle detectors were designed by D. Hardy of AFRL (USA), and data obtained from JHU/APL (USA). We thank D. Hardy, F. Rich, and P. T. Newell for their use.
Topical Editor T. Pulkkinen thanks K. Kauristie and W. Bristow for their help in evaluating this paper.
References
Baker, K. B., Greenwald, R. A., Ruohoniemi, J. M., Dudeney, J. R., Pinnock, M., Newell, P. T., Greenspan, M. E., and Meng, C.-I.: Simultaneous HF radar and DMSP observations of the cusp, Geophys. Res. Lett., 17, 1869–1872, 1990.
Baker, K. B., Dudeney, J. R., Greenwald, R. A., Pinnock, M., Newell, P. T., Rodger, A. S., Mattin, N., and Meng, C.-I.: HF radar signatures of the cusp and low-latitude boundary layer, J. Geophys. Res., 100, 7671–7695, 1995.
Baker, K. B., Rodger, A. S., and Lu, G.: HF-radar observations of the dayside magnetic merging rate: A Geospace Environment Modeling boundary layer campaign study, J. Geophys. Res., 102, 9603–9617, 1997.
Chisham, G., Pinnock, M., and Rodger, A. S.: The response of the HF radar spectral width boundary to a switch in the IMF By
direction: Ionospheric consequences of transient dayside recon-nection? J. Geophys. Res., 106, 191–202, 2001.
Chisham, G., Pinnock, M., Coleman, I. J., Hairston, M. R., and Walker, A. D. M: An unusual geometry of the ionospheric sig-nature of the cusp: Implications for magnetopause merging sites, Ann. Geophys., 20, 29–40, 2002,
SRef-ID: 1432-0576/ag/2002-20-29.
Chisham, G. and Freeman, M. P.: A technique for accurately deter-mining the cusp-region polar cap boundary using SuperDARN HF radar measurements, Ann. Geophys., 21, 983–996, 2003,
SRef-ID: 1432-0576/ag/2003-21-983.
Chisham, G., Freeman, M. P., and Sotirelis, T.: A statistical com-parison of SuperDARN spectral width boundaries and DMSP particle precipitation boundaries in the nightside ionosphere, Geophys. Res. Lett., 31, L02804, doi:10.1029/2003GL019074, 2004a.
Chisham, G. and Freeman, M. P.: An investigation of latitudinal transitions in the SuperDARN Doppler spectral width parameter at different magnetic local times, Ann. Geophys., 22, 1187–1202, 2004,
SRef-ID: 1432-0576/ag/2004-22-1187.
Chisham, G., Freeman, M. P., Coleman, I. J., Pinnock, M., Hairston, M. R., Lester, M., and Sofko, G.: Measuring the dayside recon-nection rate during an interval of due northward interplanetary magnetic field, Ann. Geophys., 22, 4243–4258, 2004b,
SRef-ID: 1432-0576/ag/2004-22-4243.
Chisham, G., Freeman, M. P., Sotirelis, T., Greenwald, R. A., Lester, M., and Villain, J.-P.: A statistical comparison of Su-perDARN spectral width boundaries and DMSP particle precip-itation boundaries in the morning sector ionosphere, Ann. Geo-phys., 23, 733–743, 2005,
SRef-ID: 1432-0576/ag/2005-23-733.
Hosokawa, K., Woodfield, E. E., Lester, M., Milan, S. E., Sato, N., Yukimatu, A. S., and Iyemori, T.: Interhemispheric comparison of spectral width boundary as observed by SuperDARN radars, Ann. Geophys., 21, 1553–1565, 2003,
SRef-ID: 1432-0576/ag/2003-21-1553.
Hosokawa, K., Yamashita, S., Stauning, P., Sato, N., Yukimatu, A. S., and Iyemori, T.: Origin of the SuperDARN broad Doppler spectra: simultaneous observation with Oersted satellite magne-tometer, Ann. Geophys., 22, 159–168, 2004,
SRef-ID: 1432-0576/ag/2004-22-159.
Milan, S. E., Lester, M., Cowley, S. W. H., Oksavik, K., Brittnacher, M., Greenwald, R. A., Sofko, G., and Villain, J.-P.: Variations in the polar cap area during two substorm cycles, Ann. Geophys., 21, 1121–1140, 2003,
SRef-ID: 1432-0576/ag/2003-21-1121.
Newell, P. T., Burke, W. J., Sanchez, E. R., Meng, C.-I., Greenspan, M. E., and Clauer, C. R.: The low-latitude boundary layer and the boundary plasma sheet at low altitude: Prenoon precipitation regions and convection reversal boundaries, J. Geophys. Res., 96, 21 013–21 023, 1991.
Parkinson, M. L., Chisham, G., Pinnock, M., Dyson, P. L., and Devlin, J. C.: Magnetic local time, substorm, and particle precipitation-related variations in the behaviour of SuperDARN Doppler spectral widths, Ann. Geophys., 22, 4103–4122, 2004,
SRef-ID: 1432-0576/ag/2004-22-4103.
Pinnock, M., Chisham, G., Coleman, I. J., Freeman, M. P., Hairston, M., and Villain, J.-P.: The location and rate of dayside recon-nection during an interval of southward interplanetary magnetic field, Ann. Geophys., 21, 1467–1482, 2003,
SRef-ID: 1432-0576/ag/2003-21-1467.
Sotirelis, T. and Newell, P. T.: Boundary-oriented electron precipi-tation model, J. Geophys. Res., 105, 18 655–18 673, 2000. Villain, J.-P., Andr´e, R., Pinnock, M., Greenwald, R. A., and
Hanuise, C.: A statistical study of the Doppler spectral width of high-latitude ionospheric F-region echoes recorded with Su-perDARN coherent HF radars, Ann. Geophys., 20, 1769–1781, 2002,
SRef-ID: 1432-0576/ag/2002-20-1769.
Woodfield, E. E., Hosokawa, K., Milan, S. E., Sato, N., and Lester, M.: An inter-hemispheric, statistical study of nightside spectral width distributions from coherent HF scatter radars, Ann. Geo-phys., 20, 1921–1934, 2002,