HAL Id: hal-01868871
https://hal.archives-ouvertes.fr/hal-01868871
Submitted on 18 Nov 2020
HAL is a multi-disciplinary open access
archive for the deposit and dissemination of
sci-entific research documents, whether they are
pub-lished or not. The documents may come from
teaching and research institutions in France or
abroad, or from public or private research centers.
L’archive ouverte pluridisciplinaire HAL, est
destinée au dépôt et à la diffusion de documents
scientifiques de niveau recherche, publiés ou non,
émanant des établissements d’enseignement et de
recherche français ou étrangers, des laboratoires
publics ou privés.
Distributed under a Creative Commons Attribution - NonCommercial| 4.0 International
License
Bed flow photoreactor experiments to assess the
photocatalytic nitrogen oxides abatement under
simulated atmospheric conditions
F. Mothes, S. Ifang, M. Gallus, B. Golly, A. Boreave, R. Kurtenbach, J.
Kleffmann, C. George, H. Herrmann
To cite this version:
F. Mothes, S. Ifang, M. Gallus, B. Golly, A. Boreave, et al.. Bed flow photoreactor experiments to
assess the photocatalytic nitrogen oxides abatement under simulated atmospheric conditions. Applied
Catalysis B: Environmental, Elsevier, 2018, 231 (—), pp.161-172. �10.1016/j.apcatb.2018.03.010�.
�hal-01868871�
Contents lists available atScienceDirect
Applied Catalysis B: Environmental
journal homepage:www.elsevier.com/locate/apcatb
Bed
flow photoreactor experiments to assess the photocatalytic nitrogen
oxides abatement under simulated atmospheric conditions
F. Mothes
a, S. Ifang
b, M. Gallus
b, B. Golly
c, A. Boréave
c, R. Kurtenbach
b, J. Kle
ffmann
b,
C. George
c, H. Herrmann
a,⁎aLeibniz-Institute for Tropospheric Research (TROPOS), Atmospheric Chemistry Department (ACD), Permoserstraße 15, 04318 Leipzig, Germany bInstitute for Atmospheric & Environmental Research, Bergische Universität Wuppertal (BUW), Gaußstr. 20, 42119 Wuppertal, Germany cUniv Lyon, Université Claude Bernard Lyon 1, CNRS, IRCELYON, F-69626, Villeurbanne, France
A R T I C L E I N F O Keywords: Heterogeneous photocatalysis Titanium dioxide Cement-based material NOx
Bedflow reactor
A B S T R A C T
Small scale bedflow photoreactor experiments were performed to assess the photocatalytic performance of cement-based TiO2-containing materials for NOxreduction through the determination of kinetic parameters
under variation of the experimental conditions (relative humidity,flow rate, mixing ratio and light intensity) and monitoring of potential reaction products in the gas phase and the aqueous extract of the surface.
The results clearly demonstrated the general potential of the tested material to photocatalytically remediate gas phase NOxby conversion into nitrite and nitrate as identified reaction products at the surface. The measured
uptake coefficients for NO and NO2under atmospheric relevant conditions were in the range of 5 × 10⁻⁵with a
corresponding surface deposition velocity of about 0.5 cm s−1. However, it became also clear that the photo-catalytic activity is in part significantly dependent on the experimental conditions. The relative humidity and the mixing ratio of the air pollutant were identified as the most important parameters. In addition, under certain conditions, a renoxification process can occur.
The comprehensive results of the present study are discussed in detail to develop recommendations for a possible future application of this technique to improve urban air quality.
1. Introduction
Clean air is essential to human health and for the intactness of the environment. Since the industrial revolution, however, the quality of the air that people breathe has deteriorated considerably as a result of human activities. The need to deliver cleaner air has been recognized for several decades with action having been taken at national, EU-level and world-wide levels, not at least through multilateral international conventions and activities. Despite significant reduction of pollutant emissions, serious air pollution problems still persist [1]. Against this backdrop, the EU adopted in 2013 the“New Clean Air Package”, cluding the update of legal monitoring of pollutant emissions by in-dustry, transport, power plants and agricultural activities [2]. The long-term objective is to achieve levels of air pollution that do not lead to unacceptable harm to human health and the environment until 2050. EU-action has therefore focused on establishing minimum air quality standards for ambient air to tackle the problems of particulate matter (PM) and ground level ozone (O3). In this context, nitrogen oxides (i.e.,
NOx= NO + NO2) play an important role, since they contribute, in
combination with volatile organic compounds (VOCs), to the formation of these most problematic secondary air pollutants. Sources for NOxare
high temperature combustion processes, mainly emitted by power plants (21% by energy industry) and combustion engines (47% by the transport sector) [2]. To protect human health, the EU Air Quality Di-rective (EU, 2008c, DiDi-rective 2008/50/EC) introduced a threshold value for NO2(annual mean 40μg m−3) which is often exceeded by the
accumulated car emissions at traffic hotspots in urban areas. In 2014, 94% of the measuring stations with values above the limit were traffic related [1].
Among new technical“solutions” designed for large dissemination over the public space, new photocatalytic building and coating mate-rials have been proposed as a“green” remediation technology for NOx
and VOCs in the polluted urban environment [3,4]. These commercial products are based on the photocatalytic properties of a thin layer of the semiconductor titanium dioxide (TiO2) deposited at the surface of the
material (such as glass, pavement, etc.) or embedded in the substrate e.g., in paints or concrete and their depollution performance has al-ready been assessed in numerous studies [5–21].
https://doi.org/10.1016/j.apcatb.2018.03.010
Received 6 February 2018; Accepted 3 March 2018
⁎Corresponding author.
E-mail address:herrmann@tropos.de(H. Herrmann).
Available online 04 March 2018
0926-3373/ © 2018 The Author(s). Published by Elsevier B.V. This is an open access article under the CC BY license (http://creativecommons.org/licenses/BY/4.0/).
The interaction of the TiO2 based photocatalyst and light of
ap-propriate wavelength (UV-light, ≤400 nm, [22]) results in a charge separation according to Hoffmann, et al. [23]:
+ → + + −
TiO2 hν hvb ecb fs range (R-1)
Here, an electron from the valence band of the semiconductor is pro-moted into the conduction band (ecb−), leaving a hole in the valence
band (hvb+). Both at the surface, or, through their diffusion through the
particle bulk, both photogenerated charge carriers might recombine (null cycle) while only at the surface they can react with adsorbed re-actants creating radicals. For example, the reaction with oxygen and water lead to the formation of highly reactive radicals such as O2−/HO2
and OH proven by measurements using, e.g., electron paramagnetic resonance (EPR) [24], cavity ring down spectroscopy (CRDS) [25] or laser-inducedfluorescence (LIF) [26–29]. These reactive oxygen species (ROS) enable irradiated TiO2, especially in its most active form Anatase
[30], to degrade adsorbed NOxand VOCs [31,32].
Based on laboratory studies, it is generally concluded that NOxis
quantitatively converted into nitrate anions [6,11,33–35], which re-main adsorbed on the surface until washed off, for example by rain, whereas the VOCs are mostly mineralized to carbon dioxide and water [36,37]. However, some recent studies on pure photocatalysts and on self-cleaning window glass also observed the formation of harmful in-termediates, for example nitrous acid (HONO) [6,38,39], which is even more harmful than the primary reactants NO and NO2. In addition,
renoxification originating from adsorbed nitrate, proposed by the photocatalytic formation of the nitrate radical (NO3) on TiO2, was
re-cently observed in laboratory experiments [40–44]. Both results are dependent on the material used and the applied experimental condi-tions, but would potentially contradict the application of photocatalytic surfaces to improve urban air quality. Accordingly, these materials are still under controversial discussion and there is an urgent need for a better characterization of such surfaces at atmospheric relevant con-ditions.
Therefore, the present study focuses on the reaction of NOxwith a
photocatalytically active cement-based material under simulated at-mospheric conditions using bed flow photoreactor experiments. Kinetics and observed products are studied under variation of the ex-perimental conditions (carrier gas, relative humidity (RH), mixing ratio,flow rate and light intensity) and a mechanism according to the experimental results is derived. Furthermore, the obtained kinetic parameters, experimental dependencies and observed reaction products are evaluated in the context of improving urban air quality and re-commendations for a future application of this technique are discussed.
2. Experimental 2.1. Sample preparation
Two different photocatalytically active cement-based coating ma-terials prepared by the manufacturer CTG Italcementi Group (based on the TX Active®technology, [45]) have been investigated and compared with an inactive reference material (Ri), which had the same
compo-sition as the active materials but without the photocatalyst TiO2. The
photocatalytically active materials contained different amounts of TiO2
(approximate composition: A = 0.3% and B = 1.0% wt.) and approxi-mately 1.0 ± 0.3% of organic carbon (measuring protocol given in SI 1) as organic additive/binding material. To investigate the cement-based coating material it was mixed with ultra-pure water (Milli‐Q gradient A 10, 18.2 MΩ cm, 3 ppb TOC, Millipore) using a water to solid ratio of w/s = 0.175 and subsequently applied on sand blasted glass plates (dimensions: 5 × 40 cm) with afinal surface thickness of about 3-4 mm. After a curing period of approximately one month, the coated glass plates were cleaned with ultra-pure water and dried under clean air conditions to avoid a surface contamination due to adsorption of chemical compounds or dirt/dust particles from ambient air.
2.2. Experimental set-up and procedure
For the qualitative and quantitative assessment of the photocatalytic efficiency of such materials, different standard methods (UNI, ISO) re-quest different types of small laboratory scale photoreactors. In the present study, the photocatalytic experiments were performed using small horizontal bed pluggedflow reactors related to ISO 22197-1 [46]. However the experimental conditions and the data evaluation were different to ISO 22197-1, which is explained below in detail. Fig. 1 gives an overview about the experimental set-up.
Three different types of bed flow reactors were used, which slightly differed by their sizes, gas flow and light conditions, hereby ensuring that the reported data are not system dependent. The rectangular photoreactors are made out of chemically inert polytetrafluoroethylene e.g., one with a volume of 2.4 × 10⁻⁴m3 without any sample (di-mensions 0.410 m × 0.059 m × 0.010 m). For the photocatalytic ex-periments, the sample plate is placed inside and the reactor is subse-quently air tight closed on top with a quartz glass plate resulting in a free space of approximately 4 mm between the surface of the sample and the glass plate. This free space could be varied (2–10 mm) in order to assess the importance of diffusion limitations in the kinetics reported
below. Generally, UV-lamps, i.e. 2 BL Quantum F20 (Havells Sylvania) are placed in a light-tight cover encasing the photoreactor. However, other types of lamps were also used such as those having an emission maximum at 370 nm (Phillips TL/05, 20 W, 300–500 nm). Light in-tensity was measured either via an optical fiber (M26L02, Thorlabs) connected to a gated ICCD camera (PI-MAX ICCD 1024 SB 25GenII, Princeton Instruments) coupled with a grating spectrograph (Spectra Pro®-300i, Acton Research Corporation, calibration procedure ex-plained in Mothes, et al. [44]) or a calibrated spectral radiometer (Metcon). Measured irradiance spectra are given as Supporting in-formation (SI 2 and SI 3). By varying the distance to the sample plate, the light intensity at the surface could be varied in a range of 3–48 W m–2 (300–400 nm). During the experiments (except for the
variation of the carrier gas), the reactor was flushed with zero air (compressed air in combination with a zero air supplier NGA19S (MCZ Umweltchemie)), or using synthetic air (5.0 from a cylinder) with a gas flow between 2-7 L min–1controlled by massflow controllers. The
re-lative humidity (RH) was adjusted by using a controlled stream of zero air passing a humidifier tube half filled with ultra-pure water (RH 0-88%). For the experiments with NOx, mixtures of NO (0.3 vol.-% in
nitrogen, Air Liquide) and NO2(1% in synthetic air, Linde) were diluted
with zero air to the desired starting mixing ratio, typically of atmo-spherically relevant 100 ppb NO/NO2. An overview about the analytical
instruments connected to the experimental set-up is given in Section 2.3.
Generally, an experiment started with a preconditioning phase, in-cluding the irradiation of the clean sample in the reactor under zero air and the desired experimental conditions (RH andflow rate) over night. After that, the photocatalytic experiment started by adding the gas phase reactant to the experimental set-up, howeverfirst via the bypass (no contact to the materials surface) to adjust the desired mixing ratio. By switching valve 1, the gas flow passes through the reactor (see Fig. 1), butfirst without UV-light to study any dark reaction between NOxand the materials surface. After stable conditions are reached the
UV-lamps are switched on to study the photocatalytic effect. To clearly identify the real photocatalytic influence and not to measure for ex-ample just photolysis, the results of the inactive material are always considered.
2.3. Instrumentation
For the photocatalytic experiments in the present study different analytical devices were connected to the experimental system. Unless otherwise stated, NO and NO2 were measured using a NOx-analyzer
(APNA-370, Horiba or Modell 42i, Thermo Scientific) based on che-miluminescence detection and molybdenum converter. Additionally, ozone was determined using an ozone monitor (ML 9811, Monitor Labs). HONO was measured by the sensitive LOPAP instrument (Long Path Absorption Photometer) which is explained in detail elsewhere [47,48]. For experiments with pure HONO a commercial HONO source was used (QUMA) the working principle of which is explained else-where [49].
To investigate the formation of the inorganic reaction products ni-trite (NO2−) and nitrate (NO3−) on the surface of the material, the
coated glass plate was extracted in 100 mL ultra-pure water for 1 h subsequently after an experimental run. The extract wasfiltered using a 0.45μm polyethersulfone syringe filter (Wicom) and finally analyzed by ion chromatography (Compact IC 761, Metrohm). The separation was carried out isocraticly on a Metrosep A Supp 5– 250/4.0 column using a mixture of NaHCO3(1.0 mM) and Na2CO3(3.2 mM) and aflow
rate of 0.7 mL min−1. The limit of detection was 0.05 mg L−1NO2−and
0.04 mg L−1NO3−.
The errors given later in Section3always represent the 1σ standard deviation for n measurements.
2.4. Kinetic parameters
The experimental set-up in this study enables the determination of first order rate constantskrxn(s–1), following the decay of the reactants
as a function of time, according to: = −
( )
k t ln rxn c c rxn t 0 (E-I) with the reactant concentration at the inlet c0and the outletctand trxn(s) as reaction time. To be independent on the geometry of the reactor, uptake coefficients γgeom.are further calculated according to:
=
(
)
γ k v 4 · · geom rxn S V . active (E-II) with the geometric surface areaSactive(m2), the reactor volume V abovethe sample (m3) and the molecular velocity of the reactant v (m s−1)
given by the gas-kinetic theory: =
v R T
π M
8 · ·
· (E-III)
for which R, T and M represent the ideal gas constant (8.314 J mol−1K−1), the absolute temperature T (K) and the molecular mass of the reactant M (kg mol–1), respectively. To avoid uncertainties by determining the reactor volume and trxn, due to the rough sample
surface, γgeom. was finally calculated using the gas flow rate ϕgas
(m3s−1): = −
( )
γ ϕ v S 4 ·ln · · ( ) geom c c gas active . t 0 (E-IV) It should be noted here that γgeom. will be derived for differentmea-suring periods with Light OFF and Light ON, where Light ON means the sum of dark and light influence and is therefore always indexed by (Light ON = total).
To calculate depositionfluxes in atmospheric models the surface resistance (Rc) is calculated from the inverse of the surface deposition
velocity vsurf (m s−1): = v γ ·v 4 surf geom. (E-V) Detailed information on the reaction kinetic parameters are given elsewhere [50].
3. Results and discussion
The impact of a photocatalytically active cement-based material on NOx to improve urban air quality is assessed, first by plugged flow
photoreactor experiments with pure NO, NO2and HONO in Section3.1.
Then, the influence of the experimental conditions on the photo-catalytic performance is discussed in Section3.2. Finally the formation of reaction products in the aqueous extract of the active surface and potentially in the gas phase is evaluated in Section3.3.
3.1. Photocatalytic experiments with NO, NO2and HONO
Sample plates coated with both materials (A or B), have been in-vestigated and always compared to the inactive reference material (Ri).
The obtained results in the following subsections are typically ex-plained using material A and Ri as example. However, the derived
uptake coefficients for all tested materials are summarized inTable 1. 3.1.1. NO
The results of the photoreactor experiments with 100 ppb NO and material A compared to the inactive reference are shown inFig. 2.
100 ± 2 ppb NO during the bypassing period. The injection of this gas phaseflow into the reactor under dark conditions did not led, for both materials, to any sustained loss of NO, indicating that only adsorption with no further dark reaction of NO at the surface is taking place, in agreement with studies on pure TiO2[51–53]. However, the active and
reference samples did shown contrasting behaviors when the lamps were switched on. Whereas almost no difference is observed using material Ri, the values for NO decreased significantly to below 20 ppb
while NO2increased up to 10 ppb. Finally, NO and NO2values reached
about 10 ppb inFig. 2a) under steady state conditions, clearly empha-sizing the photocatalytic ability of material A to remove NO from the gas phase. These steady state values were used to derive the uptake coefficient γgeom.(NO) during Light ON in Fig. 2a) that is
(5.1 ± 0.7) × 10−5and < 5.0 × 10⁻⁷for material RiinFig. 2b). For
comparison γgeom.(Light OFF) is more than two orders of magnitude
smaller (seeTable 1) demonstrating the photocatalytic activity, that is mostly explained in the literature by the following reactions (R-2)-(R-11) resulting in nitrate as final reaction product at the surface [42,51,54]. + → + + ∙ + hVB H O2 (ads) OH(ads) H (R-2) + → − ∙− eCB O2(ads) O2(ads) (R-3) + → ∙− + ∙ O2(ads) H HO2(ads) (R-4) +∙ →
NO(ads) OH(ads) HONO(ads) (R-5)
+ ∙ → +∙
NO(ads) HO2(ads) NO2(ads) OH(ads) (R-6)
+ − → −
NO2(ads) eCB NO2(ads) (R-7)
+ ∙− → − +
NO2(ads) O2(ads) NO2(ads) O2 (R-8)
+ ⇄
− +
NO2(ads) H HONO(ads) (R-9)
+ → +
− ∙ −
NO2(ads) 2OH NO3(ads) H O2 (R-10)
+∙ → ⇄ − + +
NO2(ads) OH(ads) HNO3(ads) NO3(ads) H (R-11)
The production of NO2during Light ON using material A inFig. 2a)
clearly indicates that NO2is an intermediate reaction product during
the photocatalytic NO-oxidation as given by reaction (R-6). Since NO2
is the air quality controlled pollutant, this process has to be considered. However, it has to be noted here, that the molybdenum based NOx
-analyzer is subject to interferences and therefore not really specific to NO2. Therefore, an interference of so called NOy-reaction products, like
HONO, cannot be excluded [50]. However, direct HONO measurements using the LOPAP instrument demonstrated no significant photocatalytic HONO production in the gas phase during the experiments with pure NO, minimizing the interference issue.
3.1.2. NO2
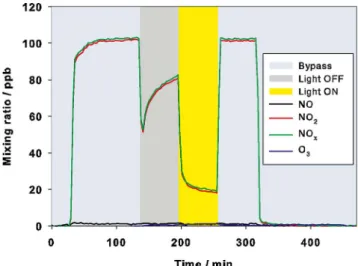
Similar experiments were also performed using a gas flow con-taining 100 ppb NO2, but here a decrease of the NO2concentration was
already observed in the dark, with a slow passivation of the surface, see Fig. 3.
This is significantly different to the behavior observed for NO in Fig. 2and demonstrates that NO2 already interacts with the surface
under dark conditions as a result, for example, of the reaction with water (50% RH) present at the surface [55], as given by reaction (R-12)
+ → +
NO H O HONO HNO
2 2(ads) 2 (ads) (ads) 3(ads) (R-12)
or after adsorption of NO2on TiO2surface by intra- and intermolecular
disproportionation reaction of the formed N2O4 as discussed by
Si-vachandiran, et al. [56] for NO2on pure TiO2. Due to this, γgeom.(Light
OFF) is 3–4 × 10⁻⁶ for both materials and has to be considered for
further evaluation of the photocatalytic activity of the tested material. However, as can be seen by comparingFig. 3a) and b) the results for the Light ON periods are significantly different. NO2decreased to values
Table 1
γgeom.Light OFF and Light ON for the experiments with NO, NO2and HONO using the
active materials A and B compared to the inactive reference material Ri.
Air pollutant Material γgeom.(Light OFF) γgeom.(Light ON = total)
NO A < 5 × 10⁻⁷ (5.1 ± 0.7) × 10−5 B (9 ± 5) × 10−7 (5.7 ± 0.8) × 10−5 Ri < 5 × 10⁻⁷ < 5 × 10⁻⁷ A - Ri < 5 × 10⁻⁷ (5.1 ± 0.7) × 10−5 B - Ri (9 ± 5) × 10−7 (5.7 ± 0.8) × 10−5 NO2 A (4.3 ± 0.6) × 10−6 (4.7 ± 0.7) × 10−5 B (8.4 ± 1.2) × 10−6 (6.0 ± 0.8) × 10−5 Ri (3.1 ± 0.5) × 10−6 (4.1 ± 0.6) × 10−6 A - Ri (1.2 ± 1.0) × 10−6 (4.3 ± 0.8) × 10−5 B - Ri (5.3 ± 1.6) × 10−6 (5.6 ± 0.9) × 10−5 HONO A (7.1 ± 1.1) × 10−5 (7.0 ± 1.1) × 10−5
B Not measured Not measured
Ri (7.1 ± 1.1) × 10−5 (6.8 ± 1.1) × 10−5
A - Ri < 2 × 10⁻⁶ < 2 × 10⁻⁶
B - Ri Not measured Not measured
Fig. 2. NO, NO2and NOxmixing ratios during the different measuring phases i.e., bypass, Light OFF and Light ON for the exp. conditions: 3 L min−1, 50% RH, 21 W m−2and 100 ppb NO
below 20 ppb using the active material A when the UV-light is switched on. But this effect is, in contrast to the results for NO, not directly and solely related to photocatalysis as presented by reaction (R-7)-(R-11). As shown inFig. 3b) using material Ri, gas phase and adsorbed NO2is
photolyzed under irradiation with UV-light (λ < 424 nm) resulting in the formation of NO (and subsequently O3) which has to be taken into
account for the assessment of γgeom.Light ON using the active material A. Therefore, the real uptake coefficient is given by the difference of the active and the inactive material. The obtained γgeom.(Light ON = total)
of NO2is (4.3 ± 0.8) × 10−5for material A and thus in a similar range
as measured for NO.
Similar to the experiments with NO only small HONO formation was observed, which was even smaller compared to the blank formation in the empty reactor resulting e.g., by reaction (R-12) on the Teflon and glass surfaces. This smaller HONO concentration in the presence of the cement-based samples indicate efficient uptake of HONO on the alka-line samples.
Since surface adsorbed oxygen is one reactant proposed to be in-volved in the photocatalytic oxidation of NO and NO2(see reaction
(R-3), (R-4) and (R-8)) the carrier gas composition was varied to in-vestigate the influence of oxygen on the photocatalytic reactivity of the
cement-based material.Fig. 4shows the results for NO and NO2using
clean air (20% O2) in comparison to pure nitrogen as carrier gas.
The results inFig. 4a) demonstrate the significant impact of O2on
the photocatalytic activity of material A to decompose NO. Whereas no difference is observed without light, a clear change in the shape of the NO-signal appears after switching on the UV-light. The values of NO decreased from 97 ppb to 12 ppb (γgeom. 4.6 × 10⁻⁵) and remained constant under steady state conditions using clean air. Taking the for-mation of NO2into account, the overall difference for NOxbetween
Light OFF and Light ON is about 75 ppb. In contrast, the NO-values show only a small drop (probably due to residual O2adsorbed on the
surface) and increase back to the values under dark conditions within 30 min with pure N2as carrier gas. The derived uptake coefficient in the
absence of O2is therefore two orders of magnitude smaller (< 5 × 10 -7
) compared to clean air, demonstrating that the often proposed oxi-dation of NO with OH radicals (R-5) is only a very minor reaction path for the tested cement-based surfaces. Also the missing formation of NO2
emphasizes an O2dependent photocatalytic NO-oxidation pathway for
the tested material. Thus, the results inFig. 4a) prove that the dom-inating initial step has to be the reaction of the conduction band elec-tron with adsorbed O2(see reaction (R-3)), thereby preventing charge
Fig. 3. NO, NO2and NOxduring the different measuring phases i.e., bypass, Light OFF and Light ON for the exp. conditions: 3 L min−1, 50% RH, 21 W m−2and 100 ppb NO2with a)
material A and b) material Ri.
Fig. 4. Carrier gas dependence of the degradation of NO, NO2and NOxon material A: clean air (solid lines) vs. nitrogen (N2, dashed lines) for the measuring phases Bypass, Light OFF and
recombination as previously observed in studies on other substrates, like pure TiO2[51], a photocatalytic paint [6] or TiO2-coated mortars
[11]. The formation of the hydroperoxyl radical (HO2·) and the
sub-sequent oxidation of NO as presented by reaction (R-4) and (R-6) is an often proposed mechanism on TiO2-containing surfaces [6,42,52]. Due
to the alkaline surface of the cement-based material (pH 10) and a pKs-value of 4.8 for HO2[57] the equilibrium given in (R-13) is fully on the
left side.
+ ⇌ +
∙− ∙ −
O2 H O2 HO2 OH (R-13)
Therefore, reactions (R-4)–(R-6) can be excluded for the experi-ments in this study. Instead, the oxidation of NO occurs probably di-rectly by O2−via peroxynitrite as intermediate product (R-14) as
sug-gested by former studies on pure TiO2 [58,59] and TiO2containing
concrete [17].
+ ∙− → −
NO(ads) O2(ads) ONOO(ads) (R-14)
All studies on the photocatalysis of NOxpropose the formation of
nitrate as the final reaction product. However, due to the alkaline surface in the present study a direct formation is excluded. The pKs for HOONO is 6–8 and results in 99% of the peroxynitrite anion at the surface that require further reactions to form the observed NO2
inter-mediate and nitrate as thefinal reaction product. Internal conversion [60] or homolysis of HOONO and recombination in the solvent cage [61] can be neglected due to the alkaline surface properties. Possible pathways, however are reactions (R-15) and (R-16) based on laboratory studies of aqueous phase radical chemistry [62,63] in agreement with the experimental results in the present study.
+ → + +
∙OH ONOO− H+ O∙− NO−
ads ads ads ads
( ) ( ) 2( ) 2( ) (R-15)
+ − → + −
NO(ads) ONOO(ads) NO2(ads) NO2(ads) (R-16)
Adsorbed nitrite can further react either with a hole (hvb+) or other
hydroxyl radicals (OH) (R-10) to form the observedfinal product ni-trate.
Although the shape of the time dependent NO2uptake curve on the
surface in the dark is slightly different for clean air and pure nitrogen, the final steady state uptake is similar for both buffer gases. The stronger initial uptake of NO2in the dark in N2indicates a stronger
competition of O2 with NO2 compared to N2for adsorption on free
active sites at the surface and influences consequently also the differ-ence during the Light ON period shown inFig. 4b). The competition of O2and NO2for the conduction band electrons is obviously an important
process step for the photocatalytic activity of the tested material, in-dicated by the slower decrease of NO2and the much later achievement
of the steady state conditions using clean air compared to pure ni-trogen. The derived uptake coefficient during Light ON therefore is a factor 1.5 higher for N2than for clean air. A renoxification process of
the reaction product nitrate at the surface [44] explains the increasing formation of NO as observed during irradiation using nitrogen as carrier gas inFig. 4b. In addition, because of the necessity of O2for the
pho-tocatalytic decomposition of NO, the continuously increasing NO level only in N2is explained by the increasing nitrate on the surface by
(R-11) and its consecutive renoxification. In contrast, when using pure air a much faster photocatalytic oxidation of NO (R-6) compared to a slower renoxification, suppress its formation. The photolysis of the sometimes proposed intermediate product HONO [39,41,64] can be neglected as NO-source, because the alkaline surface of the used ma-terial (pKsHONO= 3.29) shifts the equilibrium (R-9) to the more stable
nitrite. In addition the potential HONO-source reaction (R-5) was ex-cluded above by the experiments with NO in N2. With that, it becomes
clear that the dominating initial step of the photocatalytic NO2
-de-composition is the reaction with the hydroxyl radical (R-11) which is independent on O2(see above and [6]). According to this reaction
ni-trate is expected asfinal photocatalytic reaction product. This is further discussed in Section3.3.
3.1.3. HONO
The uptake of HONO was studied using a pure HONO source [49] on material A. The results inFig. 5clearly demonstrate a significant uptake of HONO on the investigated sample already in the dark with
γgeom.(Light OFF) 7.0 × 10⁻⁵. This behavior can be explained by the very alkaline surface properties of the cement-based material, for which the equilibrium HONO⇌NO2−(R-9) is shifted to the highly soluble
nitrite. However, as can be seen for Light ON inFig. 5, no additional HONO reduction was observed under irradiation resulting in γgeom.
(Light ON = total) again 7.0 × 10⁻⁵. In conclusion, there is no mea-surable photocatalytic activity of the tested material A for HONO under the used simulated atmospheric conditions (seeTable 1). The missing formation of NO2during UV irradiation (seeFig. 5) also confirms that
an oxidation of HONO/NO2−to NO2as an intermediate step during
oxidation to thefinal product nitrate (see (R-10)), as often proposed in many other studies, is of minor importance and not further considered in the mechanism ((R-1)–(R-11)). presented above. This reaction was also excluded in another study [6], in which the photocatalysis of HONO was explicitly studied, in contrast to most former studies which proposed NO2intermediate formation from HONO oxidation.
For a comprehensive overview, the derived uptake coefficients for NO, NO2and HONO using material A, B and Riare summarized in
Table 1.
As can be seen fromTable 1, material B with the higher amount of the photocatalyst TiO2shows also slightly higher uptake coefficients for
NO and NO2, although the differences are near the accuracy errors of
the measurements. Thus, the present plugged flow photoreactor ex-periments in summary of Section 3.1have proven the ability of the tested cement-based materials A and B to depollute air contaminated with NO and NO2(γgeom.(Light ON = total) =∼5 × 10⁻⁵). In contrast
no photocatalytic degradation was observed for HONO. The alkaline surface properties of the cement samples can already efficiently trap this harmful pollutant with an uptake coefficient γgeom.=∼7 × 10
−5.
Depending on the surface acidity and with respect of the pH-dependent equilibrium (R-9), HONO can either be trapped as nitrite (present study) or released as HONO to the gas phase on acidic or neutral sur-faces (e.g., Langridge, et al. [39]).
It should be highlighted that the activity of material A for its pho-tocatalytic reaction was slightly but continuously increasing over the course of the extensive use (number of experimental runs including the cleaning procedure during the three years lab measurements). Thus, some of the data shown in the different plots of the present study are not directly comparable and reflect the changing activity of material A. In contrast, material B was much less used and showed the expected
Fig. 5. HONO, NO, NO2and NOxduring the uptake of pure HONO on material A. Exp.
higher activity (with respect to its higher TiO2content) only compared
to freshly prepared material A, while to the end of the study both materials (A fully activated, B much less used) showed similar reactivity (seeTable 1).
The differences between the freshly prepared material A and the “fully activated” are explained by side reactions of photocatalytically formed OH radicals (R-2) with organic additives in the cement-based material. The tested material (A, B and Ri) contained about 1.0 ± 0.3%
of organic carbon. Details on the measuring procedure are given in SI 1. The photocatalytic self-degradation process of organics in the coating was proven by experiments with material B with and without the ad-ditive and in comparison with material Ri(see SI 4–6). The emission of
formaldehyde is only observed if the organic additive and the photo-catalyst TiO2are present at the irradiated surface. The formation of
C1-C5 aldehydes was also confirmed in chamber studies by Mothes, et al. [44]. Long-term experiments were not directly performed in the present study. However, when all hours of irradiation are summed up the emission of formaldehyde decreases with time but is still present after more than 500 h (cf. SI 7). Since HO2/O2−-radicals show much lower
reactivity against organics compared to the OH-radical [65–72] the organics at the surface were mainly in competition with the air pollu-tants for the OH-radicals. For freshly prepared surfaces the OH radicals reacted with the organic additive, leading to a lower activity. When the amount of additives at the surface was decreasing in response of the photocatalytic side reaction (see decreasing aldehyde formation), the activity increased caused by the increasing levels of free active surface sites and surviving OH-radicals.
These results have several important consequences. First, photo-catalytic materials including binders and additives should be optimized for high stability against the photocatalytic oxidation to minimize un-desired formation of harmful aldehydes from the coating alone, as ob-served also in other studies (e.g., Auvinen and Wirtanen [8]). Second, before testing photocatalytic surfaces for their activity, they should be activated by UV-irradiation as long as those undesired side reactions diminish. However, for the material used in the present study sig-nificant activation time of the order of at least several weeks of full irradiation is necessary. Thus other additives leading to less aldehyde formation might be used in the future. Andfinally, the use of only NO in standard tests of the photocatalytic activity (see e.g., ISO 22197-1) is not recommended. Since NO is the only main trace gas which is oxi-dized by HO2/O2−radicals, while other main pollutants (e.g., VOCs,
NO2, HONO,…) are oxidized by OH-radicals on photocatalytic surfaces,
the use of NO2is highly recommended here (for details see also Ifang,
et al. [50]). NO2is not only a more important urban pollutant, but its
activity is also a much better measure for the general activity of pho-tocatalytic surfaces against main urban pollutants.
3.2. Impact of experimental conditions on the photocatalytic effect To assess the impact of the photocatalytically active material on urban air quality, it is necessary to characterize in detail the influence of the variable ambient conditions. Therefore, the relative humidity, flow rate, starting mixing ratio and light intensity have been varied. The results are again discussed for material A. Only in the event of different results obtained for material B it is highlighted and discussed in the respective subsection.
3.2.1. Dependence on RH
The impact of RH on the photocatalytic activity of pure TiO2 or
embedded in different substrates applied to NOxabatement is under
controversial discussion in the scientific community [11,73]. The effect is based on two contrary contributions of water. H2O can interact with
the active surface either increasing the reactivity due to the formation of reactive radicals (see reactions (R-2) and (R-4)) or lowering the ac-tivity by blocking the adsorption of the target compounds to the active sites [31].
In this study, the derived uptake coefficients γgeom.(NO) and
γgeom.(NO2) for Light ON decreased from 6.0 × 10⁻⁵to 1.1 × 10⁻⁵with
increasing humidity as given in SI 8. However, the results imply two separated sections. Under consideration of the 1σ standard deviation
γgeom.NO and NO2are in a similar range for RH between 0 and 25%,
whereas further increase of RH up to 87% results in a constant decrease of the uptake coefficients. When extrapolating these curves to 100% RH no significant photocatalytic activity is expected for a multilayer water surface layer. Thesefindings confirm the two contrary contributions of H2O to the photocatalytic performance of the tested material. The
ob-served dependence on RH indicates that the competition for the active surface sites is the dominating and therefore limiting process for typical atmospheric humidities (> 25% RH).
For pure nitrous acid (HONO) no significant variation of the uptake kinetics with humidity (20%–85% RH) was observed, which is ex-plained by the simple physical adsorption of HONO in the form of ni-trite on the highly alkaline cement-based surface as mentioned before. 3.2.2. Dependence on gasflow rate
To prove that the determination of the uptake coefficients for this photoreactor study is valid and appropriate for the assessment of the photocatalytic effect under real atmospheric conditions, the flow rate was varied in the range of 2–7 L min−1whereas all other parameters
were kept constant. The derived uptake coefficients for NO and NO2
during Light ON given in SI 9 showed no dependence on this experi-mental parameter, as expected for theflow rate independent uptake coefficients, confirming 1st order kinetic (see Section2.4) in contrast to, e.g., degradation rates often used in the literature to quantify the photocatalytic degradation of NOx. Thus, uptake coefficients – as
re-commended by IUPAC– should be used in the future for better com-parison of experimental results in different reactors under different experimental conditions (flow rate, mixing ratio, Sactive/V, etc.).
However, flat bed photoreactor experiments may be subject to transport limitations due to the supposed laminarflow behavior of the gas. Diffusion limitation as the result would lead to an underestimation of the real photocatalytic activity. However, caused by the in-dependence of the uptake coefficient on the flow rate no significant diffusion limitation is expected [6]. In addition, experiments using turbulence barriers along the reaction chamber according to Ifang, et al. [50] were performed to exclude that issue for the ISO 22197-1 [46] requestedflow rate of 3 L min–1. In contrast to the study by Ifang, et al.
[50], the results demonstrated that a transport limitation for the pho-toreactor experiments in the present study can be excluded (data not shown). Possible reasons are a higherflow rate and the high roughness of the cement-based sample surface both inducing turbulences for the appliedflow rate of 3 L min−1in contrast to the veryflat paint samples and the lower gasflow rate used in Ifang, et al. [50].
3.2.3. Dependence on the initial mixing ratio
The initial mixing ratio of NO and NO2was varied in a range of
50–900 ppb, whereas the other experimental conditions were kept constant. As expected, the derived uptake coefficients for NO and NO2
given in SI 10 decreased clearly for material A with increasing the starting mixing ratio of the air pollutant. Taken the 1σ standard de-viations into account, γgeom.(NO) for material A can be considered as
almost similar only up to 200 ppb. This means that the reaction order changes to < 1 and an evaluation by 1st order kinetic is not valid for the entire tested range of pollutant concentration. The results indicated also that the higher amount of the photocatalyst TiO2in material B
change the active surface properties leading to higher photocatalytic activity compared to the results for material A (cf. Table 1). Never-theless, also γgeom.(NO2) using material B showed a slightly negative
dependence on the mixing ratio. Although it was not tested in detail as for NO, due to the formerly observed similarity, a limit of about 200 ppb is also assumed to be valid for NO2. That means, when testing
be applied under whichfirst order kinetics are valid [50] not to un-derestimate the activity of the material, e.g., when using the ISO-norm recommended NO mixing ratio of 1 ppm.
Different theories exist to explain this change of the reaction order with air pollutant mixing ratio as observed in the present and previous studies on the photocatalytic performance of pure TiO2 [51,74–76],
mineral dust proxies [41], paints [6] or construction materials similar to the one in this study [11,14,33,50,54,77–81]. The most probable explanation based on the applied experimental conditions in the pre-sent study is the competition of the charge carrier recombination with diffusion to the surface followed by the photocatalytic reaction [82]. In contrast, a Langmuir-Hinshelwood-type mechanism, which is typically used to explain the saturation is more unlikely, since monolayer ad-sorption is typically observed at much higher reactant levels compared to those when zero order kinetics is observed in photocatalysis. This is also confirmed by the typical non-linear light intensity dependence of the photocatalytic degradation of NOx(see SI 11).
In addition to NO and NO2, the uptake of HONO was also studied for
different starting mixing ratios in the range of 4–15 ppb on material A. In agreement with the results presented in Section3.1only strong dark uptake of HONO was observed on the alkaline surface of the cement-based material independent on the starting mixing ratio confirming 1st order kinetics (data not shown).
3.2.4. Dependence on light intensity
The measured dependence of the uptake coefficients for NO and NO2under variation of the light intensity in the range of 3–48 W m−2
(300–400 nm) clearly shows an increase of γgeom.(NO) and (NO2) with
increasing the light intensity (see SI 11). However, this is only valid until approx. 20 W m−2for the given experimental conditions. A higher light intensity do not result in a further increase of γgeom., but rather reach a maximum andfinally staying constant until the highest tested value of 48 W m−2. The observed non-linear response of the activity with light intensity is in agreement with other photocatalytic studies on NO and NO2 using different types of materials
[14,33,51,54,76,77,80,83–85]. Although the measured limit value for material A was approx. 20 W m−2a light intensity of 21 W m−2was often used due to technical issues in this study.
3.3. Product studies
Testing in detail the formation of reaction products is an essential part to assess the overall performance of the cement-based photo-catalytically active material prior any real atmosphere application.
Therefore, the formation of the expectedfinal reaction products at the surface, in the aqueous extract of the surface, respectively and poten-tially in the gas phase has been examined.
3.3.1. Reaction products in the aqueous runoff and their dependence on the experimental conditions
The expectedfinal reaction product of the photocatalytic NOx
-de-composition is the nitrate anion (NO3−) at the cement-based surface
(see reactions (R-1)–(R-16)). The results of the ion chromatography analysis of the aqueous surface extract subsequently to experimental runs with NO as target pollutant are summarized inFig. 6.
Nitrite (NO2−) and nitrate (NO3−) anions were identified as
reac-tion products of the photocatalytic NO-decomposireac-tion using material A, as expected due to previous studies on pure TiO2[52,58,74,86] and
other photocatalytically active construction materials [6,11,33–35]. Plotting the sum of NO2−and NO3−produced versus the consumption
of gaseous NOx(Fig. 6a)) enables the assessment of the recovery rate.
The amount of NO2(constantly) formed during the Light ON period (cf.
Fig. 2) is considered for the gaseous NOx-consumption. As can be seen,
an almost 100% recovery rate is observed for values up to 0.4μmol NOx, excluding further nitrogen containing reaction products. The
distribution is about 20% NO2−and 80% NO3−(seeFig. 6b)).
How-ever, the amount of nitrate in studies using pure TiO2or photocatalytic
paints is typically > 90%, whereas nitrite is only observed in traces [6,74]. Only one study [87] on the photocatalytic oxidation of NO2on
TiO2showed, under high RH (80%), similar values for nitrite as in the
present study. The measured 20% NO2−are therefore obviously related
to the present material properties. Most likely, the pH 10 measured for the cement-based surface, which is in contrast to the studies on pure TiO2(pH 4–5 [74]) or paints (pH 8 [6]), promotes such formation of
NO2−due to the thermodynamic stability of the oxidation states at the
alkaline surface [34,35]. Furthermore, as can be seen inFig. 6a), in-creasing the amount of NOxremoved from the gas phase results, despite
constant uptake coefficients, in a clear deviation of the observed ni-trite + nitrate values from the 1:1 line, indicating the formation of non-detected reaction products. However, extensive experimental tests on the extraction procedure (variation of the extraction time, application of different automatic shaking devices, etc.) proved its validity and excluded any negative influence of the extraction procedure on the decrease of the recovery rate. Therefore, the most probable reason is related to the influence of the material surface properties. Here, with increasing the reaction time it is likely that the reaction products can deeply enter the porous structure of the cement-based surface and in-teract with the current matrix that would explain the observed
Fig. 6. NO2−and NO3−determined in the aqueous extract dependent on the amount of NOxremoved from the gas phase after the experiments with NO and material A: a) sum of NO2−
and NO3−inμmol (the 1:1 line represents 100% recovery rate) and b) part of NO2−and NO3−in % of the total recovered amount in the aqueous extract (+ γgeom.(NO) Light ON). The
deviation of the nitrite + nitrate values from the 1:1 line. The de-creasing fraction of nitrite with the amount of NOxremoved (Fig. 6b)) is
explained by the slow oxidation of the intermediate nitrite to nitrate by different oxidants with increasing reaction time, since the amount of NOxremoved was simply varied by the duration of the experiment. A
further detailed investigation of the product formation mechanisms was, however, not in the focus of the present study. Moreover, for the application under real atmospheric conditions, it is more important to assess the impact of different applied conditions on the distribution of the reaction products at the surface.
Therefore for the reaction of NO2, the influence of the most
im-portant experimental parameters RH and the starting mixing ratio (see Sections 3.2.2and3.2.4) on the product distribution was examined. The part of NO2−and NO3− on the total recovered amount in the
aqueous extract in dependence of both parameters is shown inFig. 7 (error bars represent an estimated uncertainty of 15%). The corre-sponding uptake coefficients for these experiments with NO2and
ma-terial A are added on the respective right y-axes.
The results inFig. 7a) show a clear dependence of the measured amounts of NO2−and NO3−on RH for afixed starting mixing ratio of
100 ppb NO2. The distribution was about 40/60% under dry conditions,
changing to almost 100% NO3−at 50% RH and stayed constant when
further increasing RH up to 88%. This behavior is explained similar to results obtained with a photocatalytic paint, for which also the oxida-tion of nitrite was increasing with humidity [6]. The formation of the intermediate nitrite is explained by reactions (R-7) and (R-8) which is further oxidized by the reaction with OH radicals (R-10) to nitrate. At low humidity nitrite will be present in the form of adsorbed HONO, while higher humidities will shift the equilibrium (R-9) to nitrite. Since only nitrite is efficiently oxidized by photocatalysis [9] the fraction of the intermediate nitrite will decrease with increasing humidity. In ad-dition, increasing humidity may result in a higher quantity of available hydroxyl radicals promoting the photocatalytic oxidation of NO2and
NO2−, respectively, to NO3− as thefinal reaction product, given by
reactions (R-2), (R-10) and (R-11).
Fig. 7b) shows that also the starting mixing ratio of the target pol-lutant had an influence on the product distribution. Whereas for NO2< 100 ppb almost 100% NO3−were detected, the part of NO2−
on the total recovered amount in the aqueous extract increases up to 10% for starting mixing ratios of about 900 ppb NO2. This is again due
to the previously discussed competition of NO2and water molecules for
the active sites. Thus, at higher NO2 mixing ratios the available OH
radicals are all consumed by the NO2, resulting in the observed higher
amounts of nitrite that cannot be further oxidized by OH (R-10). In general, less available hydroxyl radicals result in a decrease of the complete photocatalytic NO2-oxidation (see reaction (R-11)), in
agreement with the overall observed dependence of γgeom.(NO2) on the
starting mixing ratio.
3.3.2. Extraction after the HONO experiments with material B
For the dark uptake of pure HONO only NO2−was observed
con-firming a simple physical adsorption. In contrast, when the photo-catalytic uptake of HONO was studied under UV irradiation a near 100% NO3−yield demonstrates the secondary oxidation of NO2−by
reaction (R-10) on material B. This confirms again that a direct pho-tocatalytic oxidation of HONO can be excluded as the rate limiting step, see Section3.1andFig. 5. The observed photocatalytic oxidation only of NO2−and not of HONO is in excellent agreement with a study on
photocatalytic paints [6].
These results demonstrate the necessity to characterize the forma-tion and distribuforma-tion of reacforma-tion products in dependence on the mate-rial and the conditions of the planned application. A deactivation of the materials photocatalytic activity due to extensive product accumulation was never observed for the tested experimental conditions. However, the impact of accumulated reaction products on the formation of fur-ther products that can be released back to the gas phase will be dis-cussed in the following Section3.3.3.
3.3.3. Gas phase reaction products
For the photocatalytic reaction of NO, only NO2and non-significant
traces of HONO were detected in the gas phase (see Section3.1). Since NO2is an intermediate in the consecutive conversion NO→ NO2→
ni-trate and since the further oxidation of NO2was found to be quite
ef-ficient (γ ≈ 5 × 10⁻⁵) the intermediate formation of NO
2is not a
sig-nificant issue against the application of the used cement-based surfaces in the atmosphere. Besides this, NO2is the main NOxspecies in a typical
European urban daytime atmosphere further highlighting the need for efficient photocatalytic conversion of NO2. This should be also
con-sidered in standard tests procedures of photocatalysis, for which up to now mainly the less important NO is considered, e.g. in ISO 22197-1.
For the other two investigated gas phase reactants NO2and HONO,
no significant yields of gas phase products were observed.
However, gas phase renoxification through photocatalytic reaction of surface NO3−and subsequently formation of O3was recently
pro-posed for photocatalytic active surfaces in chamber studies [43,44]. Thus, studies on this possible renoxification process were another focus of the present laboratory photoreactor experiments using the cement-based materials A and B.
Therefore, O3was measured in parallel to the photocatalytic NOx
-experiments.Fig. 8shows the results for an experiment with 100 ppb NO2and material A.
In addition to the confirmation of the results presented in Section
Fig. 7. NO2−and NO3−determined in the aqueous extract after the experiments with NO2and material A (+ γgeom.(NO2) Light ON) dependent on a) RH with 100 ppb NO2and b) the
3.1the measured O3values are≤ 1 ppb during all measuring periods as
shown in Fig. 8. Thus, the photoreactor experiments with NO2
fol-lowing the experimental conditions of the ISO 22197-1 [46] do not indicate any significant renoxification process leading to a formation of O3. This is, at least in part, explained by the typical short duration of the
experiments leading only to small amounts of adsorbed nitrate. Nevertheless, despite these experimental results, the observed O3
-formation using an almost identical cement-based material in photo-catalytic chamber experiments with NOxin Mothes, et al. [44] indicates
an obviously crucial impact of the applied experimental setup and procedure. In these static simulation chamber experiments reaction times of several hours were applied, while in the presentflow experi-ments the reactants are in contact to the photocatalytic surfaces for only approx. 1–2 s. Thus, any slow secondary O3-formation may not be
visible here.
Therefore, another test procedure using photoreactor experiments was applied to investigate a possible renoxification. For this purpose nitrate was added by an aqueous solution directly to the photo-catalytically active surface and was dried by flushing with clean air. When the surfaces exposed to high levels of nitrate (approx. 1 g m−2) were irradiated at high UV–light intensities (approx. 55 W m−2) only a
small formation of 2 ppb NO2and 0.5 ppb HONO, but no O3(< 1 ppb
detection limit) were observed on the cement-based surface of material A. However, both species NO2and HONO are expected as byproducts of
O3from the photocatalysis of nitrate and thus confirm a renoxification
process for the tested complex photocatalytic material. That means, still more experiments are necessary to investigate for which experimental conditions and surface nitrate loadings the renoxification is an im-portant atmospheric issue during typical rain wash-off periods and for typical atmospheric NOxdoses. In addition, possible high uptake of O3
on the cement-based coating which might explain the missing O3
for-mation during renoxification should be confirmed in the future. In conclusion, the performed laboratory photoreactor experiments on the used cement-based material showed no additional atmospheric relevant formation of undesired gas phase reaction products like O3and
HONO under the simulated atmospheric conditions. The low HONO yields are explained by the highly alkaline surface properties. 3.4. Remediation potential under realistic atmospheric urban condition
In the following section, upper limit photocatalytic NOx
-degrada-tion is estimated in a typical urban main street canyon situa-degrada-tion based on the laboratory results of the present study. Here, a street canyon with a cross section of 20 m × 20 m with the wind direction parallel to the canyon is considered (pluggedflow situation). Next, it is assumed
that the average wind speed (WS) in the canyon is WS = 1 m s−1and that emitted NOxwill on average stay inside the canyon for 200 m until
it escapes the canyon by vertical turbulent mixing, leading to an average NOxreaction time of 200 s as an upper limit. For other wind
directions, e.g. perpendicular to the canyon, higher turbulent mixing of the canyon air with the overlying atmosphere is expected, which would shorten the NOxresidence time in the canyon. To further maximize the
degradation of pollutants, all the canyon surfaces (ground and walls) are assumed to be photocatalytically active with a surface reactivity similar to the present study. Total uptake coefficients under 20 W m−2
UV-A irradiation of 5 × 10⁻⁵were thus used for both NO and NO2, see
Table 1. To calculate afirst order rate coefficient inside the canyon, transport limitations have to be considered, for which typically re-sistance models including the turbulent mixing (rere-sistance Ra), quasi
molecular diffusion (Rb) and the surface activity (Rc) are considered
(see e.g., VDI 3782, 2006 [88]) to calculate the uptake on surfaces in deposition models [50,89]. In the present study only the surface de-position velocity (1 / Rc) was used (E-V), see Section 2.4. To again
calculate an upper limit remediation, transport limitations were ne-glected here (Ra, Rb= 0) and thus a well-mixed canyon situation and
the absence of any concentration gradients towards the active surfaces were assumed. However, it should be stressed that the estimated NOx
uptake will be significantly overestimated by this simplification. Using e.g. the method described in VDI 3782 [88] to estimate Raand Rb, the
real uptake would decrease by 56% at a WS of 1 m s−1and a surface deposition velocity of 0.5 cm s−1by the transport limitation, i.e., more than a factor of two. On contrary, turbulences induced by moving ve-hicles (piston effect) may again decrease transport limitations.
Using the uptake coefficients of NO and NO2from the present study
and a surface to volume ratio Sactive/V = 0.15 m−1of the canyon (see
above),first order rate coefficients for NO and NO2degradation of k
(NO) = 8.6 × 10⁻⁴s−1 and k(NO2) = 7.0 × 10⁻⁴s−1 are calculated
using Eqs. (E-I)–(E-IV), see Section2.4. For simplicity we further used an average value k(NOx) = 7.8 × 10⁻⁴s−1. With the above specified
upper limit reaction time of the air mass of trxn= 200 s and the
iden-tified first order reaction kinetics at atmospheric relevant concentra-tions (see Section 3.2.4), the NOx-degradation is calculated by
re-arrangement of Eq. (E-I): = − c c e( ) t k t 0 · NOx rxn (E-VI) leading to a maximum estimated photocatalytic NOxuptake of 14.4% at
noontime conditions. Since the photocatalytic degradation will be zero during nighttime and assuming a) a 12 h day/night cycle and b) similar day- and nighttime NOx-levels, half the average upper limit day and
night NOxremediation of ca. 7% is obtained. This value is more
re-presentative with respect to the active discussion about how to reach the annual average NO2 threshold limit of 40μg m−3 under urban
conditions in Europe. However, it should be stressed that almost all variables were chosen here to obtain an upper limit remediation. For example, if reasonable transport limitations are considered according to VDI 3782 [88] and assuming only a 100 s mean NOxresidence time
inside the canyon, an average reduction of only 1.7% is obtained. Here more detailed micrometeorological model studies including windfield, turbulence levels and transport limitations are required for the future. In addition, typically photocatalytic surfaces are not applied both, on the walls and on all ground surfaces as considered here, reducing the Sactive/V ratio and accordingly the expected NOx reduction.
Further-more, there are certain conditions under which photocatalytic surfaces will not work at all, e.g. on wetted surfaces (during/after rain events), in winter with snow and ice covered surfaces or when surfaces are exposed to salt solutions. In conclusion, an average NOxremediation of
only a few % is expected for a typical urban application of the studied photocatalytic surfaces, which is in good agreement with results from a recent model canyon study using similar surfaces in which an average NOxreduction of approx. 2% was estimated [13].
Fig. 8. NO, NO2, NOxand O3dependent on the measuring phases Bypass, Light OFF and
As mentioned above, NOxabatement, at the level of a few %, is
achievable with efficient photocatalytic material. However, assessing its efficiency requires a few testing under specific conditions in order to be able to extrapolate to real atmospheric conditions. As highlighted by Ifang et al. [50], special attention has to be given to transport limita-tions and NO2gas phase photolysis in various type of reactors, leading
to under- or over-estimations of activities, in addition to perform those tests under realistic atmospheric conditions. For instance, as NO2
ex-hibit a much more relevant photochemistry, as compared to NO, those tests should involve this compound at atmospheric concentration (i.e., tens of ppb levels) and humidity (including higher RH). Under those circumstances, the impact of secondary processes can be investigated to ensure a proper assessment of the efficiency of the tested material. Only under such conditions are the uptake coefficients independent of the concentration level and the results can be extrapolated to any atmo-spheric conditions.
Acknowledgement
The authors gratefully acknowledge the financial support of the European Commission through the Life + grant LIFE 08 ENV/F/ 000487 PHOTOPAQ.
Appendix A. Supplementary data
Supplementary material related to this article can be found, in the online version, at doi:https://doi.org/10.1016/j.apcatb.2018.03.010. References
[1] EEA Air Quality in Europe - 2016 Report No 28, (2016).
[2] C.B.B. Guerreiro, V. Foltescu, F. de Leeuw, Air quality status and trends in Europe, Atmos. Environ. 98 (2014) 376–384.
[3] J. Chen, C.-s. Poon, Photocatalytic construction and building materials: from fun-damentals to applications, Build. Environ. 44 (2009) 1899–1906.
[4] S. Lacombe, F. Fresno, U.L.Štangar, Photocatalysis: new highlights from JEP 2013, Environ. Sci. Pollut. Res. 21 (2014) 11111–11115.
[5] A.H. Aïssa, E. Puzenat, A. Plassais, J.-M. Herrmann, C. Haehnel, C. Guillard, Characterization and photocatalytic performance in air of cementitious materials containing TiO2. Case study of formaldehyde removal, Appl. Catal., B 107
(2011) 1–8.
[6] S. Laufs, G. Burgeth, W. Duttlinger, R. Kurtenbach, M. Maban, C. Thomas, P. Wiesen, J. Kleffmann, Conversion of nitrogen oxides on commercial photo-catalytic dispersion paints, Atmos. Environ. 44 (2010) 2341–2349. [7] J. Ângelo, L. Andrade, A. Mendes, Highly active photocatalytic paint for NOx
abatement under real-outdoor conditions, Appl. Catal., A 484 (2014) 17–25. [8] J. Auvinen, L. Wirtanen, The influence of photocatalytic interior paints on indoor
air quality, Atmos. Environ. 42 (2008) 4101–4112.
[9] A. Gandolfo, V. Bartolomei, E. Gomez-Alvarez, S. Tlili, S. Gligorovski, J. Kleffmann, H. Wortham, The effectiveness of indoor photocatalytic paints on NOxand HONO
levels, Appl. Catal., B 166–167 (2015) 84–90.
[10] T. Martinez, A. Bertron, G. Escadeillas, E. Ringot, V. Simon, BTEX abatement by photocatalytic TiO2-bearing coatings applied to cement mortars, Build. Environ. 71
(2014) 186–192.
[11] T. Martinez, A. Bertron, E. Ringot, G. Escadeillas, Degradation of NO using pho-tocatalytic coatings applied to different substrates, Build. Environ. 46 (2011) 1808–1816.
[12] M. Gallus, V. Akylas, F. Barmpas, A. Beeldens, E. Boonen, A. Boréave, M. Cazaunau, H. Chen, V. Daële, J.F. Doussin, Y. Dupart, C. Gaimoz, C. George, B. Grosselin, H. Herrmann, S. Ifang, R. Kurtenbach, M. Maille, A. Mellouki, K. Miet, F. Mothes, N. Moussiopoulos, L. Poulain, R. Rabe, P. Zapf, J. Kleffmann, Photocatalytic de-pollution in the Leopold II tunnel in Brussels: NOxabatement results, Build.
Environ. 84 (2015) 125–133.
[13] M. Gallus, R. Ciuraru, F. Mothes, V. Akylas, F. Barmpas, A. Beeldens, F. Bernard, E. Boonen, A. Boréave, M. Cazaunau, N. Charbonnel, H. Chen, V. Daële, Y. Dupart, C. Gaimoz, B. Grosselin, H. Herrmann, S. Ifang, R. Kurtenbach, M. Maille, I. Marjanovic, V. Michoud, A. Mellouki, K. Miet, N. Moussiopoulos, L. Poulain, P. Zapf, C. George, J.F. Doussin, J. Kleffmann, Photocatalytic abatement results from a model street canyon, Environ. Sci. Pollut. Res. 22 (2015) 18185–18196. [14] J.K. Sikkema, S.K. Ong, J.E. Alleman, Photocatalytic concrete pavements:
labora-tory investigation of NO oxidation rate under varied environmental conditions, Constr. Build. Mater. 100 (2015) 305–314.
[15] C.H. Ao, S.C. Lee, C.L. Mak, L.Y. Chan, Photodegradation of volatile organic com-pounds (VOCs) and NO for indoor air purification using TiO2: promotion versus
inhibition effect of NO, Appl. Catal. B 42 (2003) 119–129.
[16] M.M. Ballari, M. Hunger, G. Hüsken, H.J.H. Brouwers, Modelling and experimental
study of the NOxphotocatalytic degradation employing concrete pavement with
titanium dioxide, Catal. Today 151 (2010) 71–76.
[17] M.M. Ballari, M. Hunger, G. Hüsken, H.J.H. Brouwers, NOxphotocatalytic
de-gradation employing concrete pavement containing titanium dioxide, Appl. Catal. B 95 (2010) 245–254.
[18] C.L. Bianchi, S. Gatto, C. Pirola, A. Naldoni, A. Di Michele, G. Cerrato, V. Crocellà, V. Capucci, Photocatalytic degradation of acetone, acetaldehyde and toluene in gas-phase: comparison between nano and micro-sized TiO2, Appl. Catal. B 146 (2014)
123–130.
[19] O. Debono, F. Thevenet, P. Gravejat, V. Hequet, C. Raillard, L. Lecoq, N. Locoge, Toluene photocatalytic oxidation at ppbv levels: kinetic investigation and carbon balance determination, Appl. Catal. B 106 (2011) 600–608.
[20] C. Mendoza, A. Valle, M. Castellote, A. Bahamonde, M. Faraldos, TiO2and
TiO2–SiO2coated cement: comparison of mechanic and photocatalytic properties,
Appl. Catal. B 178 (2015) 155–164.
[21] C.C. Pei, W.W.F. Leung, Photocatalytic oxidation of nitrogen monoxide and o-xy-lene by TiO2/ZnO/Bi2O3nanofibers: optimization, kinetic modeling and
mechan-isms, Appl. Catal., B 174–175 (2015) 515–525.
[22] J.-M. Herrmann, Fundamentals and misconceptions in photocatalysis, J. Photochem. Photobiol. A Chem. 216 (2010) 85–93.
[23] M.R. Hoffmann, S.T. Martin, W. Choi, D.W. Bahnemann, Environmental applica-tions of semiconductor photocatalysis, Chem. Rev. 95 (1995) 69–96. [24] Y. Nosaka, A.Y. Nosaka, Generation and detection of reactive oxygen species in
photocatalysis, Chem. Rev. 117 (2017) 11302–11336.
[25] J. Yi, C. Bahrini, C. Schoemaecker, C. Fittschen, W. Choi, Photocatalytic decom-position of H2O2on different TiO2surfaces along with the concurrent generation of
HO2radicals monitored using cavity ring down spectroscopy, J. Phys. Chem. C 116
(2012) 10090–10097.
[26] Y. Murakami, K. Endo, I. Ohta, A.Y. Nosaka, Y. Nosaka, Can OH radicals diffuse from the UV-irradiated photocatalytic TiO2surfaces? laser-induced-fluorescence
study, J. Phys. Chem. C 111 (2007) 11339–11346.
[27] Y. Murakami, E. Kenji, A.Y. Nosaka, Y. Nosaka, Direct detection of OH radicals diffused to the gas phase from the UV-irradiated photocatalytic TiO2surfaces by
means of laser-inducedfluorescence spectroscopy, J. Phys. Chem. B 110 (2006) 16808–16811.
[28] J. Thiebaud, F. Thevenet, C. Fittschen, OH radicals and H2O2molecules in the gas
phase near to TiO2surfaces, J. Phys. Chem. C 114 (2010) 3082–3088.
[29] G. Vincent, A. Aluculesei, A. Parker, C. Fittschen, O. Zahraa, P.M. Marquaire, Direct detection of OH radicals and indirect detection of H2O2 molecules in the gas phase near a TiO2photocatalyst using LIF, J. Phys. Chem. C 112 (2008) 9115–9119.
[30] A.L. Linsebigler, G.Q. Lu, J.T. Yates, Photocatalysis on TiO2surfaces: principles,
mechanisms, and selected results, Chem. Rev. 95 (1995) 735–758.
[31] H. Chen, C.E. Nanayakkara, V.H. Grassian, Titanium dioxide photocatalysis in at-mospheric chemistry, Chem. Rev. 112 (2012) 5919–5948.
[32] R. de_Richter, S. Caillol, Fighting global warming: the potential of photocatalysis against CO2, CH4, N2O, CFCs, tropospheric O3, BC and other major contributors to
climate change, J. Photochem. Photobiol. C 12 (2011) 1–19.
[33] N. Bengtsson, M. Castellote, Photocatalytic activity for NO degradation by con-struction materials: parametric study and multivariable correlations, J. Adv. Oxid. Technol. 13 (2010) 341–349.
[34] A. Folli, C. Pade, T.B. Hansen, T. De Marco, D.E. Macphee, TiO2photocatalysis in
cementitious systems: insights into self-cleaning and depollution chemistry, Cem. Concr. Res. 42 (2012) 539–548.
[35] S. Karapati, T. Giannakopoulou, N. Todorova, N. Boukos, S. Antiohos,
D. Papageorgiou, E. Chaniotakis, D. Dimotikali, C. Trapalis, TiO2functionalization
for efficient NOxremoval in photoactive cement, Appl. Surf. Sci. 319 (2014) 29–36.
[36] K. Demeestere, J. Dewulf, H. Van Langenhove, Heterogeneous photocatalysis as an advanced oxidation process for the abatement of chlorinated, monocyclic aromatic and sulfurous volatile organic compounds in air: state of the art, Crit. Rev. Environ. Sci. Technol. 37 (2007) 489–538.
[37] J. Mo, Y. Zhang, Q. Xu, J.J. Lamson, R. Zhao, Photocatalytic purification of volatile organic compounds in indoor air: a literature review, Atmos. Environ. 43 (2009) 2229–2246.
[38] V. Bartolomei, M. Sörgel, S. Gligorovski, E.G. Alvarez, A. Gandolfo, R. Strekowski, E. Quivet, A. Held, C. Zetzsch, H. Wortham, Formation of indoor nitrous acid (HONO) by light-induced NO2heterogeneous reactions with white wall paint,
Environ. Sci. Pollut. Res. 21 (2014) 9259–9269.
[39] J.M. Langridge, R.J. Gustafsson, P.T. Griffiths, R.A. Cox, R.M. Lambert, R.L. Jones, Solar driven nitrous acid formation on building material surfaces containing tita-nium dioxide: A concern for air quality in urban areas? Atmos. Environ. 43 (2009) 5128–5131.
[40] M. Ndour, P. Conchon, B. D’Anna, O. Ka, C. George, Photochemistry of mineral dust surface as a potential atmospheric renoxification process, Geophys. Res. Lett. 36 (2009) 1–4.
[41] M. Ndour, B. D’Anna, C. George, O. Ka, Y. Balkanski, J. Kleffmann, K. Stemmler, M. Ammann, Photoenhanced uptake of NO2on mineral dust: laboratory
experi-ments and model simulations, Geophys. Res. Lett. 35 (2008) 1–5.
[42] M.E. Monge, B. D’Anna, C. George, Nitrogen dioxide removal and nitrous acid formation on titanium oxide surfaces—an air quality remediation process? Phys. Chem. Chem. Phys. 12 (2010) 8991–8998.
[43] M.E. Monge, C. George, B. D’Anna, J.-F. Doussin, A. Jammoul, J. Wang, G. Eyglunent, G. Solignac, V. Daële, A. Mellouki, Ozone formation from illuminated titanium dioxide surfaces, J. Am. Chem. Soc. 132 (2010) 8234–8235.
[44] F. Mothes, O. Böge, H. Herrmann, A chamber study on the reactions of O3, NO, NO2
and selected VOCs with a photocatalytically active cementitious coating material, Environ. Sci. Pollut. Res. 23 (2016) 15250–15261.