HAL Id: hal-00303201
https://hal.archives-ouvertes.fr/hal-00303201
Submitted on 4 Dec 2007HAL is a multi-disciplinary open access
archive for the deposit and dissemination of sci-entific research documents, whether they are pub-lished or not. The documents may come from teaching and research institutions in France or abroad, or from public or private research centers.
L’archive ouverte pluridisciplinaire HAL, est destinée au dépôt et à la diffusion de documents scientifiques de niveau recherche, publiés ou non, émanant des établissements d’enseignement et de recherche français ou étrangers, des laboratoires publics ou privés.
Quantification of transport across the boundary of the
lower stratospheric vortex during Arctic winter
2002/2003
G. Günther, R. Müller, M. von Hobe, F. Stroh, P. Konopka, C. M. Volk
To cite this version:
G. Günther, R. Müller, M. von Hobe, F. Stroh, P. Konopka, et al.. Quantification of transport across the boundary of the lower stratospheric vortex during Arctic winter 2002/2003. Atmospheric Chemistry and Physics Discussions, European Geosciences Union, 2007, 7 (6), pp.17559-17597. �hal-00303201�
ACPD
7, 17559–17597, 2007 Quantification of Transport across the
Vortex Edge G. G ¨unther Title Page Abstract Introduction Conclusions References Tables Figures ◭ ◮ ◭ ◮ Back Close
Full Screen / Esc
Printer-friendly Version Interactive Discussion
Atmos. Chem. Phys. Discuss., 7, 17559–17597, 2007 www.atmos-chem-phys-discuss.net/7/17559/2007/ © Author(s) 2007. This work is licensed
under a Creative Commons License.
Atmospheric Chemistry and Physics Discussions
Quantification of transport across the
boundary of the lower stratospheric
vortex during Arctic winter 2002/2003
G. G ¨unther1, R. M ¨uller1, M. von Hobe1, F. Stroh1, P. Konopka1, and C. M. Volk21
Institute for Chemistry and Geodynamics (ICG-1), Forschungszentrum J ¨ulich, 52425 J ¨ulich, Germany
2
Institute for Meteorology and Geophysics, Universit ¨at Frankfurt, 60325 Frankfurt, Germany Received: 13 November 2007 – Accepted: 22 November 2007 – Published: 4 December 2007 Correspondence to: G. G ¨unther ([email protected])
ACPD
7, 17559–17597, 2007 Quantification of Transport across the
Vortex Edge G. G ¨unther Title Page Abstract Introduction Conclusions References Tables Figures ◭ ◮ ◭ ◮ Back Close
Full Screen / Esc
Printer-friendly Version Interactive Discussion
EGU
Abstract
Strong perturbations of the Arctic stratosphere during the winter 2002/2003 by plan-etary waves led to enhanced stretching and folding of the vortex. On two occasions the vortex in the lower stratosphere split into two secondary vortices that re-merged after some days. As a result of these strong disturbances the role of transport in and 5
out of the vortex was stronger than usual. An advection and mixing simulation with the Chemical Lagrangian Model of the Stratosphere (CLaMS) utilising a suite of inert tracers tagging the original position of the air masses has been carried out. The results show a variety of synoptic and small scale features in the vicinity of the vortex boundary, especially long filaments peeling off the vortex edge and being slowly mixed into the 10
mid latitude environment. The vortex folding events, followed by re-merging of different parts of the vortex led to strong filamentation of the vortex interior. During January, February, and March 2003 flights of the Russian high-altitude aircraft Geophysica were performed in order to probe the vortex, filaments and in one case the merging zone be-tween the secondary vortices. Comparisons bebe-tween CLaMS results and observations 15
obtained from the Geophysica flights show in general good agreement.
Several areas affected by both, transport and strong mixing could be identified, al-lowing to explain some of the structures observed during the flights. Furthermore, the CLaMS simulations allow for a quantification of the air mass exchange between mid latitudes and the vortex interior.
20
The simulations suggest that in the lower stratosphere export of vortex air leads only to a fraction of about 6% polar air in mid latitudes by the end of March. This indicates that the final impact of polar ozone loss on mid latitidudinal ozone before the vortex break up is small.
ACPD
7, 17559–17597, 2007 Quantification of Transport across the
Vortex Edge G. G ¨unther Title Page Abstract Introduction Conclusions References Tables Figures ◭ ◮ ◭ ◮ Back Close
Full Screen / Esc
Printer-friendly Version Interactive Discussion
1 Introduction
The Arctic polar vortex in 2002/2003 was unusual in so far as low temperatures, be-low the threshold for PSC formation, chlorine activation and ozone loss occurred very early already in mid December 2002 (Tilmes et al.,2003a;Goutail et al.,2005). From end of December on, polar temperatures increased and the potential for chlorine ac-5
tivation was strongly reduced after mid January. This picture is corroborated by PSC observations showing high PSC occurence in the first three weeks of December, mod-erate PSC activity in early January, sporadic and weak PSC events in February and March (Spang et al.,2005). The early onset of ozone depletion is also reproduced by model simulations (Grooß et al.,2005;Goutail et al., 2005). There was a moderate 10
chemical ozone loss in this winter, ozone loss values reported for March 2003 for the lower stratosphere range between ≈40 DU to more than 50 DU (Tilmes et al.,2003b; Christensen et al.,2005;Goutail et al.,2005;M ¨uller et al.,2007). A somewhat greater chemical ozone loss of 56 DU for the partial ozone column between 400 and 500 K potential temperature for the period from the beginning of December to mid March is 15
reported byStreibel et al.(2006) based on the Match technique. The polar vortex split and re-merged twice, once in January and once in Februrary. Small scale, filamen-tary structures were produced in the composition of the vortex air by these two split events. Air from outside the vortex was enclosed by the vortex due to repeated folding and remerging, thus creating adjacent (neighboring) areas of air of completely different 20
origin. The question arises how to quantify the effect of these processes on vortex composition and chemsitry.
The export of ozone depleted or chemically activated air from the polar vortices has an effect on the ozone abundance in the mid-latitude stratosphere in spring and summer. It is important to quantify the extent of the export of processed vortex air to 25
mid-latitudes to assess the relevance of this process for the observed ozone trends in mid-latitudes (WMO,2007) compared to chemical destruction of ozone in the mid-latitudinal air masses themselves.
ACPD
7, 17559–17597, 2007 Quantification of Transport across the
Vortex Edge G. G ¨unther Title Page Abstract Introduction Conclusions References Tables Figures ◭ ◮ ◭ ◮ Back Close
Full Screen / Esc
Printer-friendly Version Interactive Discussion
EGU Morgenstern et al.(2003) have proposed a method to quantify air mass origin using
the SLIMCAT model and have applied it to trace the transport of former polar vortex air into midlatitudes during and after the breakdown of the polar vortex. In this way they were able to diagnose the substantial meteorological differences between the Arctic winters 1999/2000 and 2000/2001, where the vortex 1999/2000 was extremely long-5
lived leading to the production of vortex “fossils” that remain noticeable until early June 2000, whereas the dilution of vortex air in mid-latitudes in 2000/2001 was much faster. On several occasions remnants of vortex air in the Northern Hemisphere mid-latitudes have been observed and have been reproduced in model simulations (Or-solini, 2001; Konopka et al., 2003; Manney et al.,2005; Grooß et al., 2007). Model 10
studies have been conducted to quantify this effect (e.g.,Knudsen and Grooß,2000; Hadjinicolaou and Pyle,2004;WMO,2007). In the Arctic, there is a large year-to-year variability of the impact of polar processes on mid-latitudes, but contributions of vortex air to mid-latitude ozone loss of up to 25 DU have been reported (Millard et al.,2002).
Here we employ simulations with the Chemical Lagrangian Model of the Stratosphere 15
(CLaMS) (McKenna et al.,2002b,a) to investigate transport through mixing in the dy-namically very active situation in winter 2002/2003. The permeability of the Arctic polar vortex edge has been studied previously with CLaMS by using artificial tracers that are initialized in the vortex as 100% and zero outside (Steinhorst et al.,2005). Here we extend this concept by considering a whole set of tracers of air mass origin. The mixing 20
scheme in CLaMS allows to follow the evolution of the spectrum of air mass origin for every single air parcel in the model.
An advantage of this technique is that averages of air-mass origins over selected regions may be deduced that are based on the information of the mixture of air-mass origin in each single air parcel in the model. In so far, our model concept is similar, but 25
not identical to the concep of air mass origin put forward byMorgenstern et al.(2003). During winter 2002/2003 the European field campaign “European Polar Strato-spheric Cloud and Lee Wave Experiment” (EUPLEX) was carried out as a part of VINTERSOL (“Validation of International Satellites and Study of Ozone Loss”). The
ob-ACPD
7, 17559–17597, 2007 Quantification of Transport across the
Vortex Edge G. G ¨unther Title Page Abstract Introduction Conclusions References Tables Figures ◭ ◮ ◭ ◮ Back Close
Full Screen / Esc
Printer-friendly Version Interactive Discussion
jectives of EUPLEX were to study ozone loss in the Arctic stratosphere in general and the effects of PSCs formed in lee waves in particular. The campaign took place from mid January to mid February 2003 in Kiruna, Sweden, utilising the high flying Russian aircraft Geophysica for stratospheric in-situ measurements. Directly connected to this campaign was an ENVISAT validation phase, carried out between the end of February 5
and mid March with very similar instrumentation. The measurements obtained during both, EUPLEX and the ENVISAT validation, showed indications of strong filamentation in and outside the lowest part of the Arctic polar vortex. To help with the interpretation of the observations, to investigate the influence of the observed small scale structures on the composition of the lower vortex and to estimate the cross boundary flux, a nu-10
merical model is used, which will be described in the next section.
Information on air mass origin and mixing from observations is provided by the mea-surements of long lived tracers. During EUPLEX in-situ tracer meamea-surements were performed by the gas chromatograph HAGAR (High Altitude Gas Analyzer, Riediger et al.,2000). Methane (CH4) observations used in this study were made with a time 15
resolution of 90 s and a mean precision of 2%. In-flight calibrations were carried out with two standards linked to within 1% of the NOAA-CMDL scale.
To aid the detection and characterisation of small scale dynamical features that are not resolved with the HAGAR time resolution, in-situ ClO measurements are used in addition. These were made by the HALOX instrument described in detail byvon Hobe 20
et al. (2005). It employs the chemical conversion resonance fluorescence technique (Brune et al.,1989) and measures ClO with an accuracy of 16%, a precision of 8% and a time resolution of 10 s under conditions of high ClO caused by chlorine activation in the vortex.
Because ClO is affected by chemical processes on much shorter timescales than 25
the rather inert long lived tracers, it is not suited as a quantitative tracer. However, as long as significant and not too inhomogeneous chlorine activation prevails within the polar vortex and under daylight conditions, the contribution of vortex air to the probed air masses can be identified qualitatively by elevated ClO levels. This was the
ACPD
7, 17559–17597, 2007 Quantification of Transport across the
Vortex Edge G. G ¨unther Title Page Abstract Introduction Conclusions References Tables Figures ◭ ◮ ◭ ◮ Back Close
Full Screen / Esc
Printer-friendly Version Interactive Discussion
EGU case throughout the EUPLEX and ENVISAT Arctic Validation campaigns although the
signal gets weaker towards the end of the winter as chlorine becomes increasingly deactivated.
A description of the CLaMS model and the tracer suite to create air mass origin spectra can be found in the next section. A short analysis of the dynamics of the 5
Arctic lower stratosphere during January, February, and March 2003 will be given in Sect.3. Measurements of CH4 and ClO obtained during the EUPLEX and ENVISAT validation experiments are used to evaluate the model results and discussed in Sect.4. A comparison between observations and model results will follow in Sect.5.
2 Model description
10
We use the Chemical Lagrangian Model of the Stratosphere (CLaMS) (McKenna et al., 2002b,a;Konopka et al.,2004,2007) for a numerical simulation focusing on dynamical aspects like advection and mixing for this unusual Arctic winter episode. CLaMS con-sists (among others) of a trajectory model for the simulation of advection processes, combined with a mixing module which parameterises the results of mixing processes. 15
The intensity of mixing is controlled by the finite time Lyapunov exponent and thus by the deformation of the flow (Konopka et al.,2005).
The CLaMS simulation discussed here uses a new vertical coordinate, the hybrid potential temperature first described byMahowald et al. (2002). The hybrid potential temperature levels are close to pressure levels below 100 hPa. Above 100 hPa the hy-20
brid potential temperature levels are identical to the conventional potential temperature surfaces. The passage from pressure to potential temperature surfaces is smoothed by using a sinus function. A more detailed description of this model version can be found inKonopka et al. (2007). For all figures and analyses the values of the hybrid potential temperature are converted into potential temperature.
25
The simulation was limited to the northern hemisphere between 300 and 850 K po-tential temperature, and started on the 1 December, 2002, with a mean resolution of
ACPD
7, 17559–17597, 2007 Quantification of Transport across the
Vortex Edge G. G ¨unther Title Page Abstract Introduction Conclusions References Tables Figures ◭ ◮ ◭ ◮ Back Close
Full Screen / Esc
Printer-friendly Version Interactive Discussion
70 km in the horizontal and 8 K in the vertical direction. All model boundaries were updated every 6 h according to the ECMWF operational analyses used to drive the model. The simulation ended on 31 March 2003.
Usually the identification of air masses and their motion and original positions is straight forward when a trajectory model is used. However, the mixing algorithm of 5
CLaMS leads to merging of adjacent air masses or the creation of new air parcels, so that the direct identification of the origin of air masses as in a pure trajectory model is not possible. This problem can be obviated by the use of artificial tracers, that mark particular regions in the atmosphere (e.g. polar or tropical air) at the beginning of the simulation. These artificial inert tracers are then advected and mixed through 10
the course of the simulation by the CLaMS transport scheme. This procedure does not only allow the tracking of air masses as in a trajectory model, but goes beyond as it allows to investigate the contribution of air mass origin in every individual CLaMS air parcel.
Thus, to study and quantify both, advection and mixing, a whole suite of inert tracers 15
are introduced: Five tracers were initialised according to the modified Potential Vor-ticity value at the original position (see Table 1 for details). Modified PV (mPV), first described by Lait (1994) and later generalised by M ¨uller and G ¨unther (2003, 2005) was defined to reduce the vertical dependency of the PV dependent tracers from the exponential increase of PV with height. The mPV values used to distinguish between 20
the different parts of the vortex and mid latitudes or tropics were chosen because they roughly indicate the boundaries between these different compartments of air over the considered altitude range. The tracers referred to in the following as “nert P-Tracers” were initialised with a value of 1, if the conditions according to their original positions were fulfilled, and with a value of 0 elsewhere. When mixing is triggered in CLaMS, 25
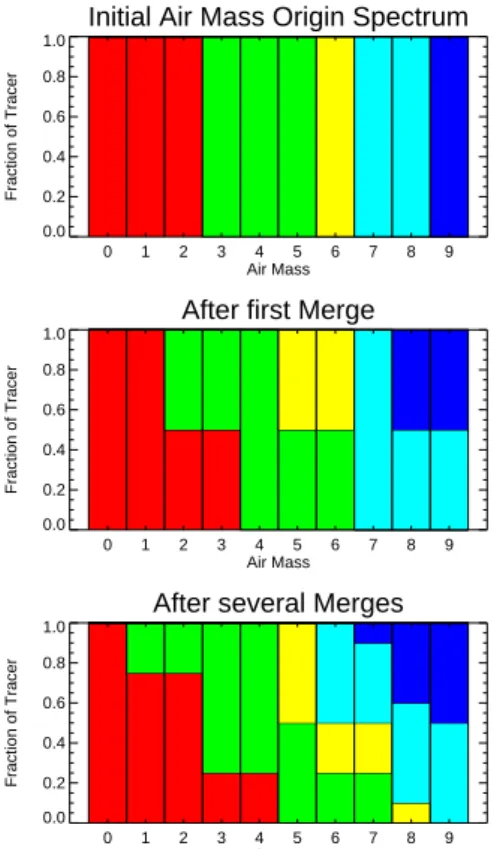
these tracers are mixed, thus preserving information about the interacting air masses and their origins. In this way an air mass origin spectrum for every air parcel is created. For a schematic of the impact of the mixing scheme on the spectrum of individual air masses see Fig.1.
ACPD
7, 17559–17597, 2007 Quantification of Transport across the
Vortex Edge G. G ¨unther Title Page Abstract Introduction Conclusions References Tables Figures ◭ ◮ ◭ ◮ Back Close
Full Screen / Esc
Printer-friendly Version Interactive Discussion
EGU With the use of these tracers it is now possible to analyse every individual air mass
simulated in CLaMS with respect to the mixing it underwent in the course of the sim-ulation. Since the simulation presented here is relatively short (4 months), no time-dependent tracers were used. This could be introduced for longer simulations to obtain further information about the life-cycle of the considered air masses.
5
3 Meteorological overview and evolution of the polar vortex
The northern hemisphere winter of 2002/2003 started with very low temperatures be-low 190 K in the Arctic be-lower stratosphere (Fig.2). During the first half of December, the polar vortex was only slightly disturbed by planetary waves. During the second half of December, in mid January and mid February the perturbation by planetary waves 10
increased strongly (see Fig.3), leading to a warming of the Arctic lower stratosphere (see Fig.2). While in December the perturbation was characterised mainly by a zonal wave number one pushing the vortex off the north pole, in January and February the dynamics was dominated additionally by a zonal wave number 2 event. Especially dur-ing the strong wave breakdur-ing events around the 21 January and the 15 February the 15
polar vortex split into two secondary vortices which re-merged within the next few days (for the splits in January and February see Figs.4and5, respectively). Besides caus-ing vigorous mixcaus-ing in the vicinity of the vortex edge the repeatcaus-ing splittcaus-ing, foldcaus-ing and re-merging led to strong filamentation of the interior of the lower stratospheric vortex with mid latitudinal air masses being folded into the vortex. In turn, the mid latitudes 20
were enriched with air originating from inside the vortex.
The wave number 2 forcing vanished almost completely in March 2003, while the wave number 1 forcing remained as strong as in February, leading to continuous dis-tortion of the lower vortex. As a consequence, the vortex was eroded strongly: big parts of it were cut off the main vortex and mixed into their mid latitudinal environment, 25
thus reducing the vortex-covered area of the northern hemisphere (Fig.6). The trans-port barrier at the vortex edge weakened significantly, leading to enhanced transtrans-port
ACPD
7, 17559–17597, 2007 Quantification of Transport across the
Vortex Edge G. G ¨unther Title Page Abstract Introduction Conclusions References Tables Figures ◭ ◮ ◭ ◮ Back Close
Full Screen / Esc
Printer-friendly Version Interactive Discussion
of extra vortex air into the vortex interior.
The evolution of the vortex in the lower stratosphere from mid to end of January is shown in Fig. 4 by means of the modified PV (mPV) on the 440 K level for several days. On 19 January the polar vortex was elongated strongly by the above mentioned perturbations caused by enhanced planetary wave activity. Over northern Canada 5
and Greenland the mPV gradient was strongly eroded, thus providing a region for air masses from the mid latitudes to enter the vortex area. Air stripped off the outer vortex edge can be seen to wrap around an anticyclonic structure positioned over the northern Pacific, indicating vortex influence in an otherwise mid latitudinal environment.
The lower stratospheric part of the vortex (below 500 K) was split into two lobes 10
afterwards (21 January), which re-merged after two days, generating a small long-stretched zone in between them. According to the ECMWF operational analyses this re-merging zone was then eroded within a few days. Two Geophysica flights (on 23 and 26 January) were carried out during this episode. Observations obtained on these flights are discussed in the next section.
15
At the end of January another wave breaking event led to a deformation of the vortex with a wave number 3 characteristic, transporting low mPV air deep into the polar regions. The dynamics of the lower stratosphere during February 2003 showed similar features (see Fig.5). Again the vortex was strongly distorted during the first two weeks of the month, broken up into two secondary vortices on the 17 February, which re-20
merged after a few days. In the beginning of this episode, on the 2 February, a flight was performed when the polar vortex was located over Kiruna. During this flight filaments of extra vortex air inside the vortex were encountered (see next section).
Unfortunately the second vortex split and re-merging event took place in between the EUPLEX campaign and the ENVISAT validation campaign. Therefore no observations 25
are available for this period of time. The first observations available from the ENVISAT validation campaign were made on 28 February.
During the first half of March the vortex was less disturbed than during the preceed-ing episode (see Fig.6). Nevertheless, during the second week of March a weak wave
ACPD
7, 17559–17597, 2007 Quantification of Transport across the
Vortex Edge G. G ¨unther Title Page Abstract Introduction Conclusions References Tables Figures ◭ ◮ ◭ ◮ Back Close
Full Screen / Esc
Printer-friendly Version Interactive Discussion
EGU number one forcing perturbed the vortex leading to air masses being drawn from the
vortex into the mid latitudes, but not being separated completely from the vortex inte-rior. In the framework of the ENVISAT validation campaign five flights were performed during this late stage of the decaying vortex. In the next section we show the observa-tions for the flight on 28 February.
5
All observations made during EUPLEX suggest that the base of the lower strato-spheric vortex was eroded rapidly during the episodes of strongest perturbation during January and February 2003. In between these episodes the vortex seemed to recover, extending its base further downward. The interactions between the vortex and the planetary waves resulted in the generation of flow patterns of small scale both inside 10
and outside the vortex. Some of these were observed during the EUPLEX and the ENVISAT validation campaign.
4 Observations
As already mentioned in the former section, the strong perturbations in mid January led to a vortex split with subsequent re-merging of the lower stratospheric vortex. During 15
this episode two EUPLEX flights were carried out.
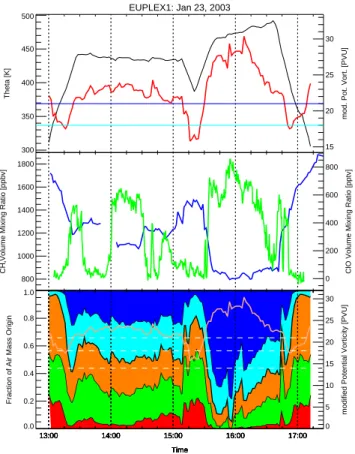
Figure7shows the observed mixing ratios of the long-lived tracer CH4and ClO along the flight path of the Geophysika on 23 January, 2003. This flight was designed to probe the re-merging zone of the lower stratospheric vortex. The top panel of this Figure displays the evolution of modified PV along the flight path (in PVU and K, respectively), 20
revealing that during the first part of the flight the Geophysika reached the inner vortex edge region and later the lower part of the vortex core (as defined in Table1). This is in accordance with the observed values of CH4(center panel). As a result of the small CH4gradient inside the vortex, the ClO observations (center panel) show the existence of small scale structures more pronounced than CH4. The HALOX observations show 25
that chlorine in the lower part of the vortex at about 430 K is significantly activated. The observed ClO distribution as well as CH4suggests that the Geophysika encounters air
ACPD
7, 17559–17597, 2007 Quantification of Transport across the
Vortex Edge G. G ¨unther Title Page Abstract Introduction Conclusions References Tables Figures ◭ ◮ ◭ ◮ Back Close
Full Screen / Esc
Printer-friendly Version Interactive Discussion
from the vortex already during ascent. This is not noticeable in the mPV values derived from the meteorological data set. Maximum ClO values were about 500 ppt after about 14:00, for about 30 min when also enhanced mPV values and lower methane mixing ratios were observed. After 14:30 the solar zenith angle along the flight path is greater than 100◦. Therefore the ClO variability is not due to photolysis.
5
The second part of the flight reached the vortex core, where the CH4 values were as low as 800 ppb. Again the structures observed in the ClO distribution are more pro-nounced than in the CH4distribution. The structures visible in the ClO measurements during the second (return) flight leg resemble those in the mPV, that is ClO decreases as the flight path leads into air masses of lower PV (see also Fig. 4). Consistently, 10
the CH4 observations show slightly increasing values. However, as for the beginning of the flight, the observations suggest the Geophysika approaching a filament of chlo-rine activated air, which is not consistent with the comparably low mPV values in the meteorological data and the relatively high (≈1.2–1.3 ppmv) CH4mixing ratios.
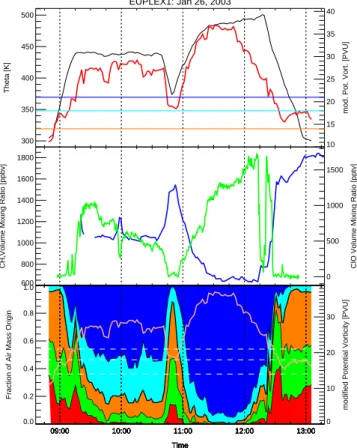
The observations on the flight on the 26 January are shown in Fig.8. Most parts of 15
the flight were carried out in vortex core air masses (see top panel of Fig.8). Apart from some small scale features the observed values of CH4 are in agreement with the modified PV calculated from the ECMWF data. The slow decrease in mPV with increasing flight altitude around 12:00 indicates an approach to the vortex edge, which is however not apparent in the CH4observations.
20
The increase of ClO at the same time is again a combined effect of the vertical gradient of Cly and the decrease of the solar zenith angle (not shown here) along the flight path enhancing the conversion of Cl2O2into ClO.
Around 12:15 the Geophysika encounters a filament of chlorine deactivated air with still very low CH4around 12:15, again a feature which can not be seen in the meteoro-25
logical data. After having left the vortex air masses (12:40) a very thin filament with a short dip in the CH4values and an indication of small chlorine activation is observed.
At the end of January strong perturbations led to a deformation of the vortex with a wave number 3 characteristic. During this episode, on the 2 February, a flight was
per-ACPD
7, 17559–17597, 2007 Quantification of Transport across the
Vortex Edge G. G ¨unther Title Page Abstract Introduction Conclusions References Tables Figures ◭ ◮ ◭ ◮ Back Close
Full Screen / Esc
Printer-friendly Version Interactive Discussion
EGU formed when the polar vortex was located over Kiruna. The observations obtained on
this day regarding the tracer CH4and ClO are shown in Fig.9. Although the horizontal position of the vortex was perfect for a flight inside the vortex core, the Geophysica only reached the base of the vortex core during the first flight leg on 420 K. Between 09:30 and 10:15 UT pronounced filaments of air from the vortex core and the vortex edge 5
are encountered. Later during the second part of the flight the Geophysica was able to penetrate deeper into the vortex core, where another filament with air of significantly higher tracer values and lower ClO mixing ratios was met. This filament seemed to consist at least partly of air from the vortex edge. The distribution of mPV on the 440 K isentropic level displayed in Fig.5suggests that the filaments encountered during this 10
flight were part of a larger structure several hundred kilometers long. This and other occurences of filaments will be investigated in the next section.
In the framework of the ENVISAT validation campaign five flights were performed during the late stage of the decaying vortex. The observations obtained on the flight on 28 February are shown in Fig. 10. Most of the flight was clearly inside the polar 15
vortex core with CH4values dropping down to 1000 ppbv and below at the highest flight levels. Moderate chlorine activation can be observed at all times inside the vortex, with ClO values between 100 pptv and more than 400 pptv. While CH4 values inside the vortex core (defined by the 21 PVU contour) are low in general, strong variablity can be observed in these areas.
20
5 Simulations with CLaMS
The most interesting dynamical features of the Arctic winter 2002/2003 besides the mi-nor warming in December were two splits of the vortex in the lower stratosphere, which were accompanied by several large-scale roll-ups of air masses stripped from the vor-tex edge. Re-merging zones were formed on several occasions between secondary 25
vortices or between the main vortex and large cut-offs merging back, thus creating fila-mentary structures inside the vortex core. Simultaneously filaments of vortex air were
ACPD
7, 17559–17597, 2007 Quantification of Transport across the
Vortex Edge G. G ¨unther Title Page Abstract Introduction Conclusions References Tables Figures ◭ ◮ ◭ ◮ Back Close
Full Screen / Esc
Printer-friendly Version Interactive Discussion
peeled off the vortex edge and moved into the mid-latitudes. The latter processes have been observed far more often than the creation of filaments by re-merging of parts of a split vortex. All of these features have in common, that their horizontal extension in one direction may be of several hundreds of kilometers, while the scale in the other direc-tion with distances of clearly below hundred kilometres is in the order of the horizontal 5
resolution of the ECMWF grid used. Therefore they can hardly be seen in horizontal PV distributions based on these data like in Figs.4 and5. In the following some of these observed features will be investigated with CLaMS. The analyses presented here are all based on the simulation described in Sect.2.
Since the CLaMS simulation was carried out with a horizontal resolution of about 10
70 km, the re-merging zone, stretching from northern Siberia across Spitsbergen and central Greenland to northern Canada, can be observed much better than in ECMWF data. The results of the simulation for the 23 January for the inert P-tracers again on the 440 K isentropic surface are shown in Fig.11. The distributions of the tracers P4 and P3, originally initialised in the vortex core and the inner vortex edge respectively 15
(see Table1), show that the strong mixing inside the vortex has led to an almost homo-geneous distribution within the 7 weeks simulated. Only some islands of rather pure vortex core air have survived. Small traces of air from the outer vortex edge (Tracer P2) can be detected inside the vortex, while no air masses from the mid latitudes and tropics have entered the vortex.
20
Overall 66% of the air north of 70◦N equivalent latitude in the layer between 430 K and 450 K is still vortex air. Air masses peeled off the vortex edge and wrapped around the vortex while being transported equatorwards with substantial amounts of vortex air (more than 40% of tracer P4 and P3 within some filaments) can be identified too. These filaments make up as much as 6% of the mid-latitude air outside the vortex in a 25
layer 20 K thick centered on 440 K.
The re-merging zone is clearly visible in the distribution of all tracers. It is almost completely free of vortex core air, with contributions of mainly air from the inner and outer vortex edge (P2) and the mid latitudes (P1). Even some influence of air
originat-ACPD
7, 17559–17597, 2007 Quantification of Transport across the
Vortex Edge G. G ¨unther Title Page Abstract Introduction Conclusions References Tables Figures ◭ ◮ ◭ ◮ Back Close
Full Screen / Esc
Printer-friendly Version Interactive Discussion
EGU ing in the tropics (P0) can be observed. In the central area of the re-merging zone over
Greenland substantial influence of vortex air is noticeable, while mid latitudinal and tropical air dominate its eastern and western part over Siberia and Canada, respec-tively. This is because in this central area of the re-merging zone the two lobes came closest and started to re-connect, thus showing the strongest horizontal wind shear, 5
which in turn enhances the mixing intensity.
On several days during this unusual dynamical situation Geophysica flights were carried out, thus giving the opportunity to study some dynamical features of the lower part of the polar vortex more closely.
The center panel of Fig. 7 shows observations of CH4 made on-board the Geo-10
physica on the 23 January 2003. The bottom panel of Fig. 7 displays the P-tracer composition of the air masses simulated by CLaMS along the flight path, indicating the influence of different air mass origins in the areas probed. Displayed are mean values derived from CLaMS air masses being in a corridor along the flight path with a max-imum distance of 40 km in the horizontal and 3 K in the vertical direction advected to 15
the nearest synoptic point in time, where CLaMS output exists (in this case 12:00 on the 23 January).
The flight on this day was aimed at probing the re-merging zone. As for all the other flights for the EUPLEX and ENVISAT validation campaign, the Geophysica only reached the lowest parts of the polar vortex. These can easily be identified by the 20
areas, where CH4 (center panel) shows low values, indicating air transported down-ward by diabatic descent inside the vortex from the middle stratosphere, where the abundances of these tracers are generally lower.
On this flight, the Geophysica encountered air from inside the vortex, i.e. the vortex core and the inner vortex edge, already during ascent and shortly after having reached 25
the 440 K level. This is in good agreement with the CLaMS results, while the next en-counter with vortex air around 14:00 seems to be shifted to earlier times in the model results and is not as apparent as in the observations. The mPV derived from ECMWF data shows no indication of vortex air during the first ClO peak. The following
encoun-ACPD
7, 17559–17597, 2007 Quantification of Transport across the
Vortex Edge G. G ¨unther Title Page Abstract Introduction Conclusions References Tables Figures ◭ ◮ ◭ ◮ Back Close
Full Screen / Esc
Printer-friendly Version Interactive Discussion
ters with air masses showing low CH4 values are again in good temporal alignment with the distribution of P-tracers. The same holds true for the increase of outer vor-tex influences around 16:00 as well as for the filament of chlorine activated air and its fine-scale structure encountered during the final descent.
The influence from air originating from the vortex core and the inner vortex edge 5
simulated by CLaMS in a vertical cross-section along the flight path is displayed in Fig.12. After summing up the amount of tracers P4 (vortex core) and P3 (inner vortex edge) in every air parcel in a curtain with a maximum horizontal distance of 60 km from the flight path, these values are binned in 60 s flight time and 10 K vertical range, thus creating a measure for the vortex influence. The filament of vortex influenced air 10
encountered during ascent and descent, which is very prominent in the observations of ClO, has a vertical extent of about 50 K and consists of up to 80% vortex air. This feature can not be seen in the the mPV distribution derived from ECMWF data.
In general, there is good agreement between observation and simulation regarding temporal alignment and vortex influence. Exceptions may be due to the fact, that (i) 15
the CLaMS results shown in the lower panel of Fig.7are derived from an interpolation onto the flight path by the averaging processes described, and that (ii) the observations are at a comparatively higher resolution, vertically and horizontally, than the CLaMS simulation. Nevertheless, the strong filamentation observed can be reproduced by the model. The amount of original vortex air inside the vortex has decreased from 66% 20
on 19 January to 51% in the 440 K layer, showing that strong mixing has been going on during the previous four days. These values are calculated by integrating the tracer distributions of P3 (inner vortex edge) and P4 (vortex core) inside the 18 mPV units contour line (see Fig.11).
The CLaMS results for the next flight on the 26 January (see Fig.8, bottom panel) 25
show in general good agreement with the observations and the PV calculated from the ECMWF analyses. The tiny filaments of chlorine activated air from the vortex encoun-tered during ascent shortly before arriving at the first cruise level are represented as a broader feature of increased influence of vortex air in the CLaMS results. The small
ACPD
7, 17559–17597, 2007 Quantification of Transport across the
Vortex Edge G. G ¨unther Title Page Abstract Introduction Conclusions References Tables Figures ◭ ◮ ◭ ◮ Back Close
Full Screen / Esc
Printer-friendly Version Interactive Discussion
EGU filament with higher amount of extra vortex air observed around 10:00 is not as sharp
in the model results as in the observations. The increase of extra vortex air later on the second flight leg (shortly after 12:00) and the small filament of vortex air met shortly afterwards agree very well with the observations. Even the very fine filament of chlo-rine activated air encountered during descent is represented in the model results as a 5
sharp increase in influence from vortex air.
The averaged distribution of the tracers tagging air from the vortex core and the inner vortex edge in a curtain along the flight track displayed in Fig.13again gives a better overview about the vertical structure of the simulated vortex. The base of the vortex is characterized by both, erosion and filamentation. The small filaments encountered 10
during ascent and descent (both visible in the observations, but not in the mPV derived from the meteorological data) are prominent in the model results. There are additional shallow structures of air dominated by vortex influence only apparent rudimentally in the observations. Although their vertical extent is only about 10 K, they consist of 40 to 50% air originally located inside the vortex boundary.
15
The flight on 2 February (see Fig.9) is especially interesting, since during this flight it was possible to meet an aged re-merging filament created during a vortex re-merging process twice (around 09:30 and 12:00). The history of the filament can be tracked back for about 4 days. The eastern part of the filament, which is probed first, is located more to the edge of the vortex, while the western is already drawn more into the re-20
merging vortex. Especially the second encounter with the old filament is clearly visible in both model results and observations. During the first part of the flight, the encounter is smeared out in the model results and also not visible in the ClO measurements. This may be due to the fact that the first part of the flight was on a lower level and in an area where the erosion of the vortex and the filaments seems to be stronger, while the 25
second part of the flight took place 30 K higher up and deeper inside the newly reunited vortex. According to CLaMS results, the vortex at the 440 K layer at this time consisted of about 60% air of original vortex origin, meaning that its interior had been filled up with vortex core air moving downward due to radiative cooling.
ACPD
7, 17559–17597, 2007 Quantification of Transport across the
Vortex Edge G. G ¨unther Title Page Abstract Introduction Conclusions References Tables Figures ◭ ◮ ◭ ◮ Back Close
Full Screen / Esc
Printer-friendly Version Interactive Discussion
The CLaMS results for the flight on the 28 February into an already aged vortex are shown in the bottom panel of Fig. 10. The slow ascent into the lower part of the vortex indicated by the slow decrease in the observed CH4 is in good agreement with the increase in vortex influence in the model results along the flight path. The observed filamentation is not reflected in the composition of the air parcels inside the 5
lower part of the vortex as simulated by CLaMS, which show only a small variability. The vortex edge encountered by the Geophysika while descending is well reproduced by the model. Small filaments observed afterwards in the vicinity of the vortex edge are matched by the model quite well.
The comparison between model results and observations shows that in general the 10
distribution of the observed species can be analyzed and sometimes better be under-stood when origin spectra based on inert tracers are taken into account. The influence of different parts of the vortex, the vortex edge and mid latitudes can be analyzed on small scales as e.g. along flight paths as well as on global scales.
Another interesting aspect that can be investigated with the help of origin spectra is 15
shown in Fig. 14. Displayed is the temporal evolution of the average composition of the vortex (i.e. all air masses with mPV ≥18) in the altitude range between 400 and 850 K. After a short spin-up of the model during the first days, the mixing induced by the strong perturbations of the vortex during the minor warming in December led to a constant increase of extra vortex air masses inside the vortex to about 20%. Between 20
the end of December and mid January the increasing stability of the vortex led to stronger PV gradients at the vortex boundary, resulting in less efficient transport across the vortex edge. Only during the strongest wave breaking events in mid Jamuary and mid February an increase in extra-vortex air inside the vortex to values of more than 30% can be observed. The amount of air coming originally from areas with mPV values 25
below 10 (i.e. the tropics) increases up to 10% until the end of February. After the wave breaking events (end of December to mid January and the first half of February) the downward motion inside the vortex leads to an increase of vortex tracers and decrease of extra-vortex influence. After mid February, when the vortex splits for the second
ACPD
7, 17559–17597, 2007 Quantification of Transport across the
Vortex Edge G. G ¨unther Title Page Abstract Introduction Conclusions References Tables Figures ◭ ◮ ◭ ◮ Back Close
Full Screen / Esc
Printer-friendly Version Interactive Discussion
EGU time, and in March, when the final warming and the vortex breakdown is about to start,
influence from the outer vortex edge, the mid latitudes and subtropics is increasing to values of about 35%.
In Fig. 15 the latitudinal variation of the average of the simulated air mass origin for lower stratospheric air between 400 K and 850 K is shown. The air mass origin 5
is initialized on 1 December 2002 according to 1. On 19 January 2003 (top panel), after about six weeks of simulation and right before the first vortex split, the air in the polar vortex remains largely isolated from mid-latitude air. Only 8% of the air masses north of 70◦
equivalent latitude in the altitude range between 400 K and 850 K are of extra vortex origin. Indeed, the gradient between air masses of different origin at the 10
polar vortex edge is very strong as it is apparent as a very narrow range of equivalent latitudes where the air shows a mixed composition between mid-latitude and vortex air. A small fraction of vortex air (≈6% between equivalent latitudes of 30◦N and 60◦N) has been transported out of the vortex. Further noticeable is that tropical and mid-latitude air masses are mixed to some extent.
15
The situation on 11 February 2003 (the last flight day of the EUPLEX campaign) is remarkably similar to mid January (Fig.15, center panel). The gradient at the vortex edge has steepened compared to mid January. There is almost the same fraction of polar air at mid-latitudes (≈6% between 30◦N and 60◦N equivalent latitudes) than in mid-January and there is a slighly lower fraction of pure vortex core air within the vortex 20
(60%) that now also contains about 12% of air masses of extra vortex air, some even of tropical origin.
Even by the end of March (see Fig. 15, bottom panel) the transport barrier at the edge of the vortex is clearly noticeable and the vortex contains about 64 % pure vortex air (indicated by the blue colour). Transport of vortex air to mid-latitudes has increased 25
compared to the situation in January and February (≈7% equivalent mid-latitudes). The influence of vortex air is strongest at high equivalent latitudes, that is close to the polar vortex, and decreases equatorwards.
ACPD
7, 17559–17597, 2007 Quantification of Transport across the
Vortex Edge G. G ¨unther Title Page Abstract Introduction Conclusions References Tables Figures ◭ ◮ ◭ ◮ Back Close
Full Screen / Esc
Printer-friendly Version Interactive Discussion
mid-latitude ozone, simulations including the transport and chemistry of ozone would be required. However, assuming that the air in the polar vortex at the beginning of the winter has ozone mixing ratios about as large as the mid-latitude air and assuming that ozone has been completely chemically destroyed in the polar vortex during winter, one would estimate that the midlatitude ozone levels by the end of March have been 5
reduced by about 7% due to the export of polar vortex air. In reality, ozone in the Arctic vortex is not destroyed completely, so that this value constitutes an upper limit.
The results indicate that as long as a polar voxtex exists, the impact of ozone loss on mid-latitude ozone trends will be small. This impact should be even smaller in Arctic winters with a stronger vortex than in 2002/2003 or in the Antarctic.
10
6 Conclusions
The Arctic winter 2002/2003 showed an unusual dynamical situation with strong plan-etary wave activity leading to perturbations of the polar vortex. Two splits of the polar vortex in the lower stratosphere followed by remerging of the separated secondary vortices a few days later resulted in enhanced formation of filaments of extra vortex 15
air being folded into the remerging vortices. These air masses were then subsequently mixed into the interior of the newly created vortex. The same events caused air masses being peeled off from the vortex edge and being transported into the mid-latitudes, tak-ing with them a small amount of former vortex core air.
The observations of ClO onboard the high-flying aircraft Geophysica obtained during 20
the field campaign EUPLEX and an ENVISAT validation phase from mid January to mid March show a polar vortex with significant chlorine activation. Evidence for filaments was observed at the vortex edge as well as in its interior. Model results from the CLaMS model taken along the flight paths are consistent with the observations and are helpful with analysis and understanding of the observed values of e.g. ClO and CH4.
25
Model calculations using the CLaMS model were used to investigate the spectrum of air mass origins of each individual air parcel in the model. We find that the Arctic
ACPD
7, 17559–17597, 2007 Quantification of Transport across the
Vortex Edge G. G ¨unther Title Page Abstract Introduction Conclusions References Tables Figures ◭ ◮ ◭ ◮ Back Close
Full Screen / Esc
Printer-friendly Version Interactive Discussion
EGU vortex in winter 2002/2003 remained relatively isolated even after the two splits and
remergers of the polar vortex in the lower stratosphere. The air masses of extra vortex origin being captured inside the reformed vortex were then mixed with vortex air and led to an increase of extra vortex air inside the polar vortex of about 36% in the altitude range between 400 K and 850 K.
5
In the mid-latitudes the air masses which have been drawn from the vortex core and edge by the above described dynamical situations are slowly mixed into the background air. The model calculations suggest this transport from the polar vortex into the mid-latitudes to result in a fraction of the order of 7% for the lower stratosphere until the end of March. This can serve as estimate for the maximum impact of Arctic ozone depletion 10
on the mid-latitudes before the break up of the polar vortex.
Acknowledgements. The authors would like to thank the European Centre for Medium-Range Weather Forecasts (ECMWF) for providing the meteorological data, and N. Spelten, N. Thomas and R. Bauer for excellent support with data handling and programming.
References
15
Brune, W. H., Anderson, J. G., and Chan, K. R.: In-situ observations of ClO in the Antarctic: ER-2 aircraft results from 54◦
S to 72◦
S latitude, J. Geophys. Res., 94, 16 649–16 663, 1989. 17563
Christensen, T., Knudsen, B. M., Streibel, M., Anderson, S. B., Benesova, A., Braathen, G., Davies, J., De Backer, H., Dier, H., Dorokhov, V., Gerding, M., Gil, M., Henchoz, B., Kelder,
20
H., Kivi, R., Kyr ¨o, E., Litynska, Moore, D., Peters, G., Skrivankova, P., St ¨ubi, R., Turunen, T., Vaughan, G., Viatte, P., Vik, A. F., von der Gathen, P., and Zaitcev, I.: Vortex-averaged Arctic ozone depletion in the winter 2002/2003, Atmos. Chem. Phys., 5, 131–138, 2005,
http://www.atmos-chem-phys.net/5/131/2005/. 17561
Goutail, F., Pommereau, J.-P., Lef `evre, F., Roozendael, M. V., Andersen, S. B., K ˚astad-Høiskar,
25
B.-A., Dorokhov, V., Kyr ¨o, E., Chipperfield, M. P., and Feng, W.: Early unusual ozone loss during the Arctic winter 2002/2003 compared to other winters, Atmos. Chem. Phys., 5, 665–
ACPD
7, 17559–17597, 2007 Quantification of Transport across the
Vortex Edge G. G ¨unther Title Page Abstract Introduction Conclusions References Tables Figures ◭ ◮ ◭ ◮ Back Close
Full Screen / Esc
Printer-friendly Version Interactive Discussion
677, 2005,
http://www.atmos-chem-phys.net/5/665/2005/. 17561
Grooß, J.-U., G ¨unther, G., M ¨uller, R., Konopka, P., Bausch, S., Schlager, H., Voigt, C., Volk, C. M., and Toon, G. C.: Simulation of denitrification and ozone loss for the Arctic winter 2002/2003, Atmos. Chem. Phys., 5, 1437–1448, 2005,
5
http://www.atmos-chem-phys.net/5/1437/2005/. 17561
Grooß, J.-U., M ¨uller, R., Konopka, P., Steinhorst, H.-M., Engel, A., M ¨obius, T., and Volk, C. M.: The impact of mixing across the polar vortex edge on Match ozone loss estimates,, Atmos. Chem. Phys. Discuss., 7, 11 725–11 759, 2007. 17562
Hadjinicolaou, P. and Pyle, J.: The impact of Arctic ozone depletion on northern middle
lat-10
itudes: interannual variability and dynamical control, J. Atmos. Chem., 47, 25–43, 2004. 17562
Knudsen, B. M. and Grooß, J. U.: Northern midlatitude stratospheric ozone dilution in spring modeled with simulated mixing, J. Geophys. Res., 105, 6885–6890, 2000. 17562
Konopka, P., Grooß, J.-U., Bausch, S., M ¨uller, R., McKenna, D. S., Morgenstern, O., and
15
Orsolini, Y.: Dynamics and chemistry of vortex remnants in late Arctic spring 1997 and 2000: Simulations with the Chemical Lagrangian Model of the Stratosphere (CLaMS), At-mos. Chem. Phys., 3, 839–849, 2003,
http://www.atmos-chem-phys.net/3/839/2003/. 17562
Konopka, P., Steinhorst, H.-M., Grooß, J.-U., G ¨unther, G., M ¨uller, R., Elkins, J. W., Jost, H.-J.,
20
Richard, E., Schmidt, U., Toon, G., and McKenna, D. S.: Mixing and Ozone Loss in the 1999-2000 Arctic Vortex: Simulations with the 3-dimensional Chemical Lagrangian Model of the Stratosphere (CLaMS), J. Geophys. Res., 109, D02315, doi:10.1029/2003JD003792, 2004. 17564
Konopka, P., G ¨unther, G., McKenna, D. S., M ¨uller, R., Offermann, D., Spang, R., and Riese, M.:
25
How homogeneous and isotropic is stratospheric mixing? Comparison of CRISTA-1 obser-vations with transport studies based on the Chemical Lagrangian Model of the Stratosphere (CLaMS), Q. J. R. Meteorol. Soc., 131, 565–579, doi:10.1256/qj.04.47, 2005. 17564 Konopka, P., G ¨unther, G., M ¨uller, R., dos Santos, F. H. S., Schiller, C., Ravegnani, F., Ulanovsky,
A., Schlager, H., Volk, C. M., Viciani, S., Pan, L. L., McKenna, D.-S., and Riese, M.:
Con-30
tribution of mixing to upward transport across the tropical tropopause layer (TTL), ACP, 7, 3285–3308, 2007. 17564
ACPD
7, 17559–17597, 2007 Quantification of Transport across the
Vortex Edge G. G ¨unther Title Page Abstract Introduction Conclusions References Tables Figures ◭ ◮ ◭ ◮ Back Close
Full Screen / Esc
Printer-friendly Version Interactive Discussion
EGU 17565
Mahowald, N. M., Plumb, R. A., Rasch, P. J., del Corral, J., and Sassi, F.: Stratospheric trans-port in a three-dimensional isentropic coordinate model, J. Geophys. Res., 107, 4254, doi: 10.1029/2001JD001313, 2002. 17564
Manney, G. L., Santee, M. L., Livesey, N. J., Froidevaux, L., Read, W. G., Pumphrey, H. C.,
5
Waters, J. W., and Pawson, S.: EOS Microwave Limb Sounder observations of the Antarctic polar vortex breakup in 2004, Geophys. Res. Lett., 32, L12811, doi:10.1029/2005GL022823, 2005. 17562
McKenna, D. S., Grooß, J.-U., G ¨unther, G., Konopka, P., M ¨uller, R., Carver, G., and Sasano, Y.: A new Chemical Lagrangian Model of the Stratosphere (CLaMS): 2. Formulation of chemistry
10
scheme and initialization, J. Geophys. Res., 107, 4256, doi:10.1029/2000JD000113, 2002a. 17562,17564
McKenna, D. S., Konopka, P., Grooß, J.-U., G ¨unther, G., M ¨uller, R., Spang, R., Offermann, D., and Orsolini, Y.: A new Chemical Lagrangian Model of the Stratosphere (CLaMS): 1. Formu-lation of advection and mixing, J. Geophys. Res., 107, 4309, doi:10.1029/2000JD000114,
15
2002b.17562,17564
Millard, G. A., Lee, A. M., and Pyle, J. A.: A model study of the connection between polar and midlatitude ozone loss in the northern Hemisphere lower stratosphere, J. Geophys. Res., 107, 8323, doi:10.1029/2001JD000899, [printed 108 (D5), 2003], 2002.17562
Morgenstern, O., Lee, A. M., and Pyle, J. A.: Cumulative mixing inferred from stratospheric
20
tracer relationships, J. Geophys. Res., 108, 8321, doi:10.1029/2002JD002098, 2003.17561, 17562
M ¨uller, R. and G ¨unther, G.: A generalized form of Lait’s modified potential vorticity, J. Atmos. Sci., 60, 2229–2237, 2003.17565,17582
M ¨uller, R. and G ¨unther, G.: Polytropic atmospheres and the scaling of potential vorticity,
Mete-25
orol. Atmos. Phys., 90, 153–157, doi:10.1007/s00703-004-0087-6, 2005. 17565
M ¨uller, R., Tilmes, S., Grooß, J.-U., Engel, A., Oelhaf, H., Wetzel, G., Huret, N., Pirre, M., Catoire, V., Toon, G., and Nakajima, H.: Impact of mesospheric intrusions on ozone–tracer relations in the stratospheric polar vortex, J. Geophys. Res., in press, 2007.17561
Orsolini, Y. J.: Long-lived tracer patterns in the summer polar stratosphere, Geophys. Res.
30
Lett., 28, 3855–3858, doi:10.1029/2001GL013103, 2001.17562
Riediger, O., Schmidt, U., Strunk, M., and Volk, M. C.: HAGAR – A new in-situ instrument for stratospheric balloons and high altitude aircraft, in: Stratospheric ozone 1999, Proceedings
ACPD
7, 17559–17597, 2007 Quantification of Transport across the
Vortex Edge G. G ¨unther Title Page Abstract Introduction Conclusions References Tables Figures ◭ ◮ ◭ ◮ Back Close
Full Screen / Esc
Printer-friendly Version Interactive Discussion
of the fifth European symposium, edited by Harris, N. R. P., Guirlet, M., and Amanatidis, G. T., Air pollution research report 73, pp. 1399–1405, European Commission, 2000. 17563 Spang, R., Remedios, J. J., Kramer, L. J., Poole, L. R., Fromm, M. D., M ¨uller, M., Baumgarten, G., and Konopka, P.: Polar Stratospheric Cloud Observations by MIPAS on ENVISAT: Detec-tion method, validataion and analysis of the Northern hemisphere winter 2002/2003, Atmos.
5
Chem. Phys., 5, 679–692, 2005,
http://www.atmos-chem-phys.net/5/679/2005/. 17561
Steinhorst, H.-M., Konopka, P., G ¨unther, G., and M ¨uller, R.: How permeable is the edge of the Arctic vortex – Model studies of the winter 1999-2000, J. Geophys. Res., 110, D06105, doi:10.1029/2004JD005268, 2005.17562
10
Streibel, M., Rex, M., von der Gathen, P., Lehmann, R., Harris, N. R. P., Braathen, G. O., Reimer, E., Deckelmann, H., Chipperfield, M., Millard, G., Allaart, M., Andersen, S. B., Claude, H., Davies, J., De Backer, H., Dier, H., Dorokov, V., Fast, H., Gerding, M., Kyr ¨o, E., Litynska, Z., Moore, D., Moran, E., Nagai, T., Nakane, H., Parrondo, C., Skrivankova, P., St ¨ubi, R., Vaughan, G., Viatte, P., and Yushkov, V.: Chemical ozone loss in the Arctic winter
15
2002/2003 determined with Match, Atmos. Chem. Phys., 6, 2783–2792, 2006, http://www.atmos-chem-phys.net/6/2783/2006/. 17561
Tilmes, S., M ¨uller, R., Grooß, J.-U., H ¨opfner, M., Toon, G. C., and Russell, J. M.: Very early chlorine activation and ozone loss in the Arctic winter 2002–2003, Geophys. Res. Lett., 30, 2201, doi:10.1029/2003GL018079, 2003a. 17561
20
Tilmes, S., M ¨uller, R., Grooß, J.-U., McKenna, D. S., Russell, J. M., and Sasano, Y.: Calculation of chemical ozone loss in the Arctic winter 1996-1997 using ozone-tracer correlations: Com-parison of Improved Limb Atmospheric Spectrometer (ILAS) and Halogen Occultation Exper-iment (HALOE) results, J. Geophys. Res., 108, 4045, doi:10.1029/2002JD002213, 2003b. 17561
25
von Hobe, M., Grooß, J.-U., M ¨uller, R., Hrechanyy, S., Winkler, U., and Stroh, F.: A re-evaluation of the ClO/Cl2O2 equilibrium constant based on stratospheric in-situ observations, Atmos.
Chem. Phys., 5, 693–702, 2005,
http://www.atmos-chem-phys.net/5/693/2005/. 17563
WMO: Scientific assessment of ozone depletion: 2006, Global Ozone Research and Monitoring
30
ACPD
7, 17559–17597, 2007 Quantification of Transport across the
Vortex Edge G. G ¨unther Title Page Abstract Introduction Conclusions References Tables Figures ◭ ◮ ◭ ◮ Back Close
Full Screen / Esc
Printer-friendly Version Interactive Discussion
EGU
Table 1. Initialisation of the inert tracers according to the modified PV value or the latitude at the original positions of the air masses on 1 December 2002. Values for mPV ranges are taken fromM ¨uller and G ¨unther(2003).
Inert Tracer mPV Range Description Colour
P0 −10.,. . .,10. Tropics Red
P1 10.,. . .,14. Mid Latitudes Green
P2 14.,. . .,18. Outer Vortex Edge Orange P3 18.,. . .,21. Inner Vortex Edge Cyan
ACPD
7, 17559–17597, 2007 Quantification of Transport across the
Vortex Edge G. G ¨unther Title Page Abstract Introduction Conclusions References Tables Figures ◭ ◮ ◭ ◮ Back Close
Full Screen / Esc
Printer-friendly Version Interactive Discussion
Initial Air Mass Origin Spectrum
0 1 2 3 4 5 6 7 8 9 Air Mass 0.0 0.2 0.4 0.6 0.8 1.0 Fraction of Tracer
After first Merge
0 1 2 3 4 5 6 7 8 9 Air Mass 0.0 0.2 0.4 0.6 0.8 1.0 Fraction of Tracer
After several Merges
0 1 2 3 4 5 6 7 8 9 Air Mass 0.0 0.2 0.4 0.6 0.8 1.0 Fraction of Tracer
Fig. 1.Schematic of the impact of the CLaMS mixing scheme on the spectrum of air mass origin of individual air parcels. The block diagram shows ten air masses initialised with a suite of inert tracers with respect to the conditions valid at the position at the beginning of the simulation as described in the text. The initialisation is mutually exclusive (upper panel). After the first mixing events, some air parcels contain non-disappearing values of more than one tracer being inherited by their parental air masses in case of merging (middle panel). In this way a spectrum of air mass origin is created in every air mass (lower panel).
ACPD
7, 17559–17597, 2007 Quantification of Transport across the
Vortex Edge G. G ¨unther Title Page Abstract Introduction Conclusions References Tables Figures ◭ ◮ ◭ ◮ Back Close
Full Screen / Esc
Printer-friendly Version Interactive Discussion EGU 300 400 500 600 700 Potential Temperature Minimum Temperature [K] Minimum Temperature [K] 300 400 500 600 700 Potential Temperature 12−2002 01−2003 02−2003 03−2003 Date 180 182 184 186 188 190 192 194 196 198 200 202 204 206 208 210 212 214 12−2002 01−2003 02−2003 03−2003 Date
Fig. 2. Temporal evolution of the minimum temperature north of 40◦
N between 1 December 2002, and 31 March, 2003. The thin black line corresponds to 192 K.
ACPD
7, 17559–17597, 2007 Quantification of Transport across the
Vortex Edge G. G ¨unther Title Page Abstract Introduction Conclusions References Tables Figures ◭ ◮ ◭ ◮ Back Close
Full Screen / Esc
Printer-friendly Version Interactive Discussion 300 400 500 600 700 Pot. Temperature [K] 300 400 500 600 700 Pot. Temperature [K] 12−2002 01−2003 02−2003 03−2003 0 50 75 100 150 200 250 300 400 500 600 700 800 900 1000 1100 1200 gpm 300 400 500 600 700 Pot. Temperature [K] 300 400 500 600 700 Pot. Temperature [K] 12−2002 01−2003 02−2003 03−2003 0 50 75 100 150 200 250 300 400 500 600 700 800 900 1000 1100 1200 gpm
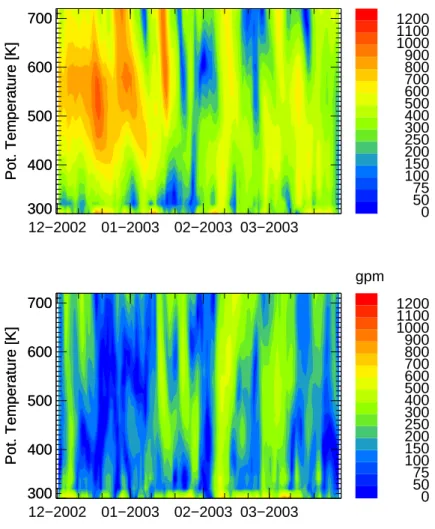
Fig. 3.Temporal evolution of the amplitudes of wave number 1 (upper panel) and wave number 2 (lower panel) between 1 December 2002, and 31 March 2003, in the lower stratosphere
ACPD
7, 17559–17597, 2007 Quantification of Transport across the
Vortex Edge G. G ¨unther Title Page Abstract Introduction Conclusions References Tables Figures ◭ ◮ ◭ ◮ Back Close
Full Screen / Esc
Printer-friendly Version Interactive Discussion EGU Modified PV [10^(−6)*K*m^2/(kg*s)] Date: 19.01.2003 12:00:00 Level: 440K 0.00 1.50 3.00 4.50 6.00 7.50 9.00 10.50 12.00 13.50 15.00 16.50 18.00 19.50 21.00 22.50 24.00 25.50 27.00 28.50 Modified PV [10^(−6)*K*m^2/(kg*s)] Date: 21.01.2003 12:00:00 Level: 440K 0.00 1.50 3.00 4.50 6.00 7.50 9.00 10.50 12.00 13.50 15.00 16.50 18.00 19.50 21.00 22.50 24.00 25.50 27.00 28.50 29.47 Modified PV [10^(−6)*K*m^2/(kg*s)] Date: 22.01.2003 12:00:00 Level: 440K 0.00 1.50 3.00 4.50 6.00 7.50 9.00 10.50 12.00 13.50 15.00 16.50 18.00 19.50 21.00 22.50 24.00 25.50 27.00 28.50 28.68 Modified PV [10^(−6)*K*m^2/(kg*s)] Date: 23.01.2003 12:00:00 Level: 440K 0.00 1.50 3.00 4.50 6.00 7.50 9.00 10.50 12.00 13.50 15.00 16.50 18.00 19.50 21.00 22.50 24.00 25.50 27.00 28.50 28.71 Modified PV [10^(−6)*K*m^2/(kg*s)] Date: 26.01.2003 12:00:00 Level: 440K 0.00 1.50 3.00 4.50 6.00 7.50 9.00 10.50 12.00 13.50 15.00 16.50 18.00 19.50 21.00 22.50 24.00 25.50 27.00 28.50 29.61 Modified PV [10^(−6)*K*m^2/(kg*s)] Date: 30.01.2003 12:00:00 Level: 440K 0.00 1.50 3.00 4.50 6.00 7.50 9.00 10.50 12.00 13.50 15.00 16.50 18.00 19.50 21.00 22.50 24.00 25.50 27.00 28.50 29.93
Fig. 4. Horizontal distribution of modified PV on the 440 K isentropic surface for 19 January (top row, left), 21st (top row, center), 22nd (top row, right), 23rd (bottom row, left), 26th (bottom row, center), and 30th (bottom row, right), 2003 (derived from ECMWF data). Contour lines are displayed at 10., 14., 18., 21. PVU. White lines correspond to flight paths of that day.
ACPD
7, 17559–17597, 2007 Quantification of Transport across the
Vortex Edge G. G ¨unther Title Page Abstract Introduction Conclusions References Tables Figures ◭ ◮ ◭ ◮ Back Close
Full Screen / Esc
Printer-friendly Version Interactive Discussion Modified PV [10^(−6)*K*m^2/(kg*s)] Date: 02.02.2003 12:00:00 Level: 440K 0.00 1.44 2.87 4.31 5.74 7.18 8.61 10.05 11.48 12.92 14.35 15.79 17.22 18.66 20.09 21.53 22.96 24.40 25.83 27.27 28.70 Modified PV [10^(−6)*K*m^2/(kg*s)] Date: 11.02.2003 12:00:00 Level: 440K 0.00 1.45 2.91 4.36 5.82 7.27 8.72 10.18 11.63 13.09 14.54 15.99 17.45 18.90 20.36 21.81 23.26 24.72 26.17 27.62 29.08 Modified PV [10^(−6)*K*m^2/(kg*s)] Date: 15.02.2003 12:00:00 Level: 440K 0.00 1.50 3.00 4.50 6.00 7.49 8.99 10.49 11.99 13.49 14.99 16.49 17.99 19.49 20.98 22.48 23.98 25.48 26.98 28.48 29.98 Modified PV [10^(−6)*K*m^2/(kg*s)] Date: 19.02.2003 12:00:00 Level: 440K 0.00 1.47 2.93 4.40 5.87 7.33 8.80 10.26 11.73 13.20 14.66 16.13 17.60 19.06 20.53 22.00 23.46 24.93 26.40 27.86 29.33 Modified PV [10^(−6)*K*m^2/(kg*s)] Date: 23.02.2003 12:00:00 Level: 440K 0.00 1.52 3.04 4.56 6.08 7.60 9.12 10.64 12.16 13.68 15.20 16.72 18.24 19.77 21.29 22.81 24.33 25.85 27.37 28.89 30.41 Modified PV [10^(−6)*K*m^2/(kg*s)] Date: 28.02.2003 12:00:00 Level: 440K 0.00 1.47 2.93 4.40 5.87 7.33 8.80 10.27 11.74 13.20 14.67 16.14 17.60 19.07 20.54 22.00 23.47 24.94 26.40 27.87 29.34
Fig. 5. Horizontal distribution of modified PV on the 440 K isentropic surface for 2 February (top row, left), 11th (top row, center), 15th (top row, right), 19th (bottom row, left), 23rd (bottom row, center), and 28th (bottom row, right), 2003 (derived from ECMWF data). Contour lines are displayed at 10., 14., 18., 21. PVU. White lines correspond to flight paths of that day.
ACPD
7, 17559–17597, 2007 Quantification of Transport across the
Vortex Edge G. G ¨unther Title Page Abstract Introduction Conclusions References Tables Figures ◭ ◮ ◭ ◮ Back Close
Full Screen / Esc
Printer-friendly Version Interactive Discussion EGU Modified PV [10^(−6)*K*m^2/(kg*s)] Date: 02.03.2003 12:00:00 Level: 440K 0.00 1.56 3.12 4.68 6.23 7.79 9.35 10.91 12.47 14.03 15.58 17.14 18.70 20.26 21.82 23.38 24.93 26.49 28.05 29.61 31.17 Modified PV [10^(−6)*K*m^2/(kg*s)] Date: 08.03.2003 12:00:00 Level: 440K 0.00 1.48 2.97 4.45 5.93 7.42 8.90 10.38 11.87 13.35 14.83 16.31 17.80 19.28 20.76 22.25 23.73 25.21 26.70 28.18 29.66 Modified PV [10^(−6)*K*m^2/(kg*s)] Date: 12.03.2003 12:00:00 Level: 440K 0.00 1.45 2.90 4.34 5.79 7.24 8.69 10.13 11.58 13.03 14.48 15.93 17.37 18.82 20.27 21.72 23.16 24.61 26.06 27.51 28.96 Modified PV [10^(−6)*K*m^2/(kg*s)] Date: 16.03.2003 12:00:00 Level: 440K 0.00 1.49 2.99 4.48 5.98 7.47 8.97 10.46 11.96 13.45 14.95 16.44 17.94 19.43 20.93 22.42 23.92 25.41 26.91 28.40 29.90
Fig. 6.Horizontal distribution of modified PV on the 440 K isentropic surface for 2 March (upper left), 8th (upper right), 12th (lower left), 16th (lower right), 2003 (derived from ECMWF data). Contour lines are displayed at 10., 14., 18., 21. PVU. White lines correspond to flight paths of that day.
ACPD
7, 17559–17597, 2007 Quantification of Transport across the
Vortex Edge G. G ¨unther Title Page Abstract Introduction Conclusions References Tables Figures ◭ ◮ ◭ ◮ Back Close
Full Screen / Esc
Printer-friendly Version Interactive Discussion EUPLEX1: Jan 23, 2003 300 350 400 450 500 Theta [K] 15 20 25 30
mod. Pot. Vort. [PVU]
800 1000 1200 1400 1600 1800 CH 4
Volume Mixing Ratio [ppbv]
0 200 400 600 800
ClO Volume Mixing Ratio [pptv]
0.0 0.2 0.4 0.6 0.8 1.0
Fraction of Air Mass Origin
13:00 14:00 15:00 16:00 17:00 Time 13:00 14:00 15:00 16:00 17:00 Time 13:00 14:00 15:00 16:00 17:00 Time 13:00 14:00 15:00 16:00 17:00 Time 13:00 14:00 15:00 16:00 17:00 Time 0 5 10 15 20 25 30
modified Potential Vorticity [PVU]
Fig. 7. Modified PV (red) and Theta (black) along the flight path (top panel) and observations of CH4 (blue) and ClO (green) obtained by the HAGAR instrument on-board the Geophysica
on the flight from the 23 January, 2003 (center panel). The bottom panel shows the mean composition of P-tracers along the flight path, displaying P0 (Tropics) in red, P1 (Mid Latitudes) in green, P2 (Outer Vortex Edge) in orange, P3 (Inner Vortex Edge) in cyan and P4 (Vortex Core) in blue.
ACPD
7, 17559–17597, 2007 Quantification of Transport across the
Vortex Edge G. G ¨unther Title Page Abstract Introduction Conclusions References Tables Figures ◭ ◮ ◭ ◮ Back Close
Full Screen / Esc
Printer-friendly Version Interactive Discussion EGU EUPLEX1: Jan 26, 2003 300 350 400 450 500 Theta [K] 10 15 20 25 30 35 40
mod. Pot. Vort. [PVU]
600 800 1000 1200 1400 1600 1800 CH 4
Volume Mixing Ratio [ppbv]
0 500 1000 1500
ClO Volume Mixing Ratio [pptv]
0.0 0.2 0.4 0.6 0.8 1.0
Fraction of Air Mass Origin
09:00 10:00 11:00 12:00 13:00 Time 09:00 10:00 11:00 12:00 13:00 Time 09:00 10:00 11:00 12:00 13:00 Time 09:00 10:00 11:00 12:00 13:00 Time 09:00 10:00 11:00 12:00 13:00 Time 0 10 20 30
modified Potential Vorticity [PVU]
Fig. 8. Modified PV (red) and Theta (black) along the flight path (top panel) and observations of CH4 (blue) and ClO (green) obtained by the HAGAR instrument on-board the Geophysica
on the flight from the 26 January, 2003 (center panel). The bottom panel shows the mean composition of P-tracers along the flight path, displaying P0 (Tropics) in red, P1 (Mid Latitudes) in green, P2 (Outer Vortex Edge) in orange, P3 (Inner Vortex Edge) in cyan and P4 (Vortex Core) in blue.
ACPD
7, 17559–17597, 2007 Quantification of Transport across the
Vortex Edge G. G ¨unther Title Page Abstract Introduction Conclusions References Tables Figures ◭ ◮ ◭ ◮ Back Close
Full Screen / Esc
Printer-friendly Version Interactive Discussion EUPLEX1: Feb 02, 2003 300 350 400 450 Theta [K] 15 20 25 30
mod. Pot. Vort. [PVU]
800 1000 1200 1400 1600 1800 CH 4
Volume Mixing Ratio [ppbv]
0 200 400 600 800 1000
ClO Volume Mixing Ratio [pptv]
0.0 0.2 0.4 0.6 0.8 1.0
Fraction of Air Mass Origin
09:00 10:00 11:00 12:00 Time 09:00 10:00 11:00 12:00 Time 09:00 10:00 11:00 12:00 Time 09:00 10:00 11:00 12:00 Time 09:00 10:00 11:00 12:00 Time 0 5 10 15 20 25 30
modified Potential Vorticity [PVU]
Fig. 9. Modified PV (red) and Theta (black) along the flight path (top panel) and observations of CH4 (blue) and ClO (green) obtained by the HAGAR instrument on-board the Geophysica
on the flight from the 2 February, 2003 (center panel). The bottom panel shows the mean composition of P-tracers along the flight path, displaying P0 (Tropics) in red, P1 (Mid Latitudes) in green, P2 (Outer Vortex Edge) in orange, P3 (Inner Vortex Edge) in cyan and P4 (Vortex Core) in blue.