HAL Id: hal-00299156
https://hal.archives-ouvertes.fr/hal-00299156
Submitted on 18 Aug 2004
HAL is a multi-disciplinary open access
archive for the deposit and dissemination of
sci-entific research documents, whether they are
pub-lished or not. The documents may come from
teaching and research institutions in France or
abroad, or from public or private research centers.
L’archive ouverte pluridisciplinaire HAL, est
destinée au dépôt et à la diffusion de documents
scientifiques de niveau recherche, publiés ou non,
émanant des établissements d’enseignement et de
recherche français ou étrangers, des laboratoires
publics ou privés.
buildings
M. D. Bostenaru Dan
To cite this version:
M. D. Bostenaru Dan. Multi-criteria decision model for retrofitting existing buildings. Natural
Haz-ards and Earth System Science, Copernicus Publications on behalf of the European Geosciences Union,
2004, 4 (4), pp.485-499. �hal-00299156�
SRef-ID: 1684-9981/nhess/2004-4-485
© European Geosciences Union 2004
and Earth
System Sciences
Multi-criteria decision model for retrofitting existing buildings
M. D. Bostenaru Dan
Institute for Technology and Management in Construction, Am Fasanengarten, Geb. 50.31, University of Karlsruhe, D-76128 Karlsruhe, Germany
Received: 30 September 2003 – Revised: 9 June 2004 – Accepted: 5 July 2004 – Published: 18 August 2004
Abstract. Decision is an element in the risk management
process. In this paper the way how science can help in de-cision making and implementation for retrofitting buildings in earthquake prone urban areas is investigated. In such in-terventions actors from various spheres are involved. Their interests range among minimising the intervention for maxi-mal preservation or increasing it for seismic safety. Research was conducted to see how to facilitate collaboration between these actors. A particular attention was given to the role of time in actors’ preferences. For this reason, on decision level, both the processural and the personal dimension of risk man-agement, the later seen as a task, were considered. A sys-tematic approach was employed to determine the functional structure of a participative decision model. Three layers on which actors implied in this multi-criteria decision problem interact were identified: town, building and element. So-called ‘retrofit elements’ are characteristic bearers in the ar-chitectural survey, engineering simulations, costs estimation and define the realms perceived by the inhabitants. This way they represent an interaction basis for the interest groups con-sidered in a deeper study. Such orientation means for actors’ interaction were designed on other levels of intervention as well. Finally, an ‘experiment’ for the implementation of the decision model is presented: a strategic plan for an urban intervention towards reduction of earthquake hazard impact through retrofitting. A systematic approach proves thus to be a very good communication basis among the participants in the seismic risk management process. Nevertheless, it can only be applied in later phases (decision, implementation, control) only, since it serves verifying and improving solu-tion and not developing the concept. The ‘retrofit elements’ are a typical example of the detailing degree reached in the retrofit design plans in these phases.
Correspondence to: M. D. Bostenaru Dan
1 Introduction
Risk management is a process including all or some steps like identification, assessment, mitigation, monitoring, re-view and communication of risks resulting from a certain hazard on a site or an activity. It involves making and imple-menting decisions to minimise the adverse effects from haz-ards impact. Between risk assessment and mitigation spans the field of risk exposure analysis and evaluation of risk ‘treatment’ strategies. The prioritisation process in risk man-agement also relies to an important extent on the communica-tion between the actors assessing risk and setting priorities, as better communication enables the development of more efficient strategies to manage the risk through more appro-priate decisions.
In case of preventive risk management the amount of ac-tion towards damage reducac-tion depends on the availability and usability of information at a given time. GIS systems, various knowledge bases in the internet and expert systems, to name a few, are important to cover information needs of both experts and laics. Experts can be natural and social scientists, engineers and planners in the pre-disaster phase and emergency managers post-disaster. Laics can be passive public in pre-disaster phase and affected people post-disaster. Such visualisation means enable them to communicate using a common base and are also useful to communicate figures to decision makers.
In case of a risk mitigation measure taking the form of a construction, the (drawn) plans of a project express its objectual dimension and the planning, as function of project management, its processural dimension. The un-derstanding of building and urban planning changed over time and this change was particularly fast in the last 40 years (Bostenaru, 2004). Theoretical and empirical mod-els have been developed in order to design ‘communicative’ planning processes. ‘Communication’ builds in this case the successor of the ‘participation’, which supposed a cen-tral decision process inside the political-administrative sys-tem, to which third parties could participate within the frame
of information processes. Communication enlarges the co-designing possibilities with several processes, from which co-operation between involved actors is the most important. Through co-operation the decision process is relocated in in-dependent fields outside politics and administration and the reality of simultaneous decision processes is accepted. In the meantime a transition took place: from traditional offer plan-ning, relying on absolute values, one element in the manage-ment process, to strategic planning, which includes imple-mentation and control, and thus all management stages. The systematic understanding of planning is a result of a strategic approach to it (Bostenaru, 2002). Joedicke’s view (1976) can be put into this context. He defines planning as a systemati-cally made development and decision process for preparation of actions, with help of which societal scopes can be for-mulated and action programmes can be implemented. The project and the goal definition are seen by Joedicke (1976) as a parallel flow. Strategic planning, a process oriented ap-proach towards the organisation of urban possibilities, is less oriented against products or results and is instead a social ac-tion and learning process, within which the potential actors are developing. Relevant participative/communicative plan-ning models along the time are (Bostenaru, 2004):
– the “pattern language” of Alexander (1977), developed
in the 60s. Impressive spatial situations show similar “patterns”, which constitute the elements of a language “for all citizens”, defined spatially and functionally in a cybernetic way;
– the construction research performed by Ottokar Uhl
and his team after applying the Stichting Architec-tural Research method (Habraken, 1973) for the project “Wohnen morgen” in Hollabrunn, Austria, in the 70s (Hempel and Uhl, 1982). A learning process was ini-tiated parallel to the construction process, this involv-ing both “affected people” (Hempel and Uhl, 1982) and “experts” (Fingerhuth and Koch, 1996) to a different ex-tent at certain stages of decision making;
– building modernisation support schemes in the 80s,
such as Private-Public-Partnerships on local scale, neighbourhood supports and co-operation nets, as first examples of communication. An example for the deci-sion models applied that time is given by the approach adopted in the restoration of the Weissenhof Siedlung in Stuttgart, Germany (N¨agele, 1992), to solve the ten-sions between those involved in conservation of historic buildings, construction technique, construction financ-ing and respectively user interests;
– interdisciplinary co-operation in the 90s. Involved
ac-tors have the possibility to be trained about the way of approach and the vocabulary of the disciplines with which they collaborate. A programme exists before ap-proaching the problem, for example in form of a man-ual like ATC-40 (Comartin et al., 2000). The result is an unique conclusion, where the components
orig-inating from a discipline or another (in case of ATC-40: building owners and agency representatives, archi-tects, building officials, structural engineers and ana-lysts) cannot be distinguished anymore;
– innovative co-operative approaches today, like
“Plan-ning through Projects” (IBA, 1999) in construction ex-hibitions in order to address new tasks or in virtual co-operation networks on the world wide web in order to address new technologies. While GIS technologies are useful in visualisation, full use of internet communica-tion allows a more efficient disaster risk management through dynamic exchange of information and commu-nication. The later is exemplified by the World Housing Encyclopedia (EERI, 2004), an information database to be shared by all those interested in seismic resistant housing construction.
The author developed the concept of ‘retrofit elements’ as suitable “pattern” for the inter-disciplinary problem ‘retrofitting historic buildings’. Such elements are the com-munication basis for interest groups on conservation of his-toric buildings, structural behaviour and construction tech-niques, construction costs and, more limited, user interests. This way key actors in the decision process are pre-figured: the architect, the civil engineer, the investor and the user. The views of these actors will be regarded further in this paper.
Closest to the idea of this study lay the objectives and achievements of the RISK-UE Project (Mouroux et al, 2004). This joint endeavour involved the assessment of earthquake risk scenarious in seven European cities in order to provide decision makers and disaster managers with estimates on seismic hazard impact. Aimed were increasing awareness on city decision making level and to initiate seismic risk appro-priation on all levels (see an example in RISK-UE, 2004). To the strategic objectives belonged developing GIS urban databases as a decision making tool. Other two objectives concern the dissemination of results and international net-working. But the most innovative one addresses the sensi-bilisation of city actors by means of earthquake impact as-sessment, according to which action plans would be elabo-rated. The project is expected to have impact on the “de-velopment within the cities of services specialised in taking account of these risks in order to establish ‘Risk Manage-ment Plans’ and ‘Action Plans’ in the short, medium and long term.” (Mouroux et al., 2004).
It is the object of the impact assessment which essentially distinguishes the aim of this paper of that of the RISK-UE project. Not the earthquake impact is in question, but the impact of the preventive intervention on buildings in order to reduce the damaging effect of earthquake events. Aim of the paper is to develop communication structures for de-cision makers involved in retrofitting existing buildings and to analyse how language patterns developed at different spa-tial scales flow into. It starts from casting the model into the generic framework of multi-criteria decision analysis and closes with an implementation strategy model based on the multilevel interaction at various scales. Strategic planning
I
in
te
ll
ig
e
n
c
e
II
d
e
si
g
n
II
I
c
h
o
ic
e
1. problem
definition
2. evaluation
criteria
4. decision
rules
5. sensitivity
analysis
6.
recommendation
3. criterion
weighting
judgemental phase computational phase ‚goal tree‘ decision maker’s preferencesFig. 1. Flow chart for the spatial multi-criteria decision analysis. It shows the two layouts proposed by Malczewski (1999), in six (Ara-bic numbers) and respectively three (Roman numbers) steps high-lighting the stages at which specific approaches have been devel-oped by the author of this paper.
for urban earthquake risk mitigation will be exemplified, and represents the model for decision implementation. Outgo-ing point is the impact assessment practice in urban plannOutgo-ing (impact assessment is carried out for each new development), as image of the development and orientation for the interac-tion between the planning levels and the participating actors. The focus lays on the planning intervention for preparedness and not in emergency management.
2 Nature of spatial multi-criteria decision support
Malczewski (1999) provided in his book “GIS and Multicri-teria Decision Analysis” an extensive state-of-the-art review of multi-criteria decision systems for spatial problems. Mal-czewski (1999) proposes two different layouts for the deci-sion making: a three-phases one and a detailed step-wise one. These three phases in the process are called “intelligence”, “design” and “choice”. The steps to be followed, namely problem definition, evaluation criteria, criterion weighting, decision rules, sensitivity analysis and finally recommenda-tion, can be assigned to the phases as shown in Fig. 1.
The intelligence phase encompasses the problem state-ment, the selection of the evaluation criteria and the se-lection of the criterion weighting type. Problem statement
means in Malczewski’s approach the modelling of the spa-tial object, which facilitates identifying spaspa-tial decisions, and the identification of the actors. The first implies converting data to information. The identified spatial elements are vari-ables in a multi-attributive decision making (with attributes as constrains). Evaluation criteria are attributes, indicating to which degree preferences of the actors are achieved. Mal-czewski (1999) reviews several methodologies for creating a hierarchical value structure for purposes of criterion weight-ing, which is a preferences structure modelling technique. According to Malczewski (1999) GIS is useful in “prefer-ence elucidation and aggregation”, the way he calls inter-actively setting the priorities with use of visualisation tech-niques. It includes a judgemental phase and computational phase, through which suitable variants are selected and thus the options reduced from the very begin in the intelligence phase. Two criterion weighting rules of those reviewed by Malczewski are of special interest: the pair wise comparison method of Saaty (1980) and the rating method, often concre-tised in the utility value approach.
Design means generating alternatives. This phase consists of a single, but comprehensible step: the selection of the de-cision rule type. Dede-cision rules strongly depend on the con-flicting preferences of the actors. Malczewski (1999) pro-poses an expert system based choice of the decision rule(s). Selection factors are the characteristics of the decision rule, of the decision makers and of the decision problem as well as the size of the problem. There is an interdependency be-tween the size of the problem and the criteria adopted. The criteria are, on their part, influenced by the adopted decision rule (Fig. 1). Thus the selection is also influenced by factors like the number of criteria, of alternatives and of constraints. Computer interaction depends on the degree of structuring of the problem. Malczewski (1999) proposes for this to se-lect a decision support system, out of a toolbox (a methodol-ogy for creating a multi-criteria value structure), an interface and a database. The toolbox contains the actors’ preferences based on criterion weighting, generating and evaluating al-ternatives and the choice. The database, which can be also a model-base is derived in this phase to a knowledgebase. Malczweski (1999) closes describing an issue met in building decision support systems: the integration of spatial decision support systems with spatial expert systems.
The last phase in solving the decision problem is the choice. It comprises the evaluation of alternatives and issu-ing of recommendation. The sensitivity analysis undertaken in this phase is seen as a learning process in which the deci-sion makers are repeatedly confronted with the structure of the problem. Input variations such as changes in the spatial data or in the actor’s preferences are influencing the ranking of the alternatives in the choice (Fig. 1). Decision makings techniques as well as visualisation and data administration techniques (such as GIS) are involved equally in this final phase. The implementation of one or several alternatives can be recommended.
reports on building
types
data set hypotheses
retrofit elements technical and management retrofit strategy induction deduction damage patterns problems and opportunities retrofit provisions damage patterns
hypothesis hypotheses statements
preservation configuration survey characteristics
data set hypotheses
retaining the character element aspect induction deduction size, looks, material change minimal intervention in original structure
hypothesis hypotheses statements
(A)
(B)
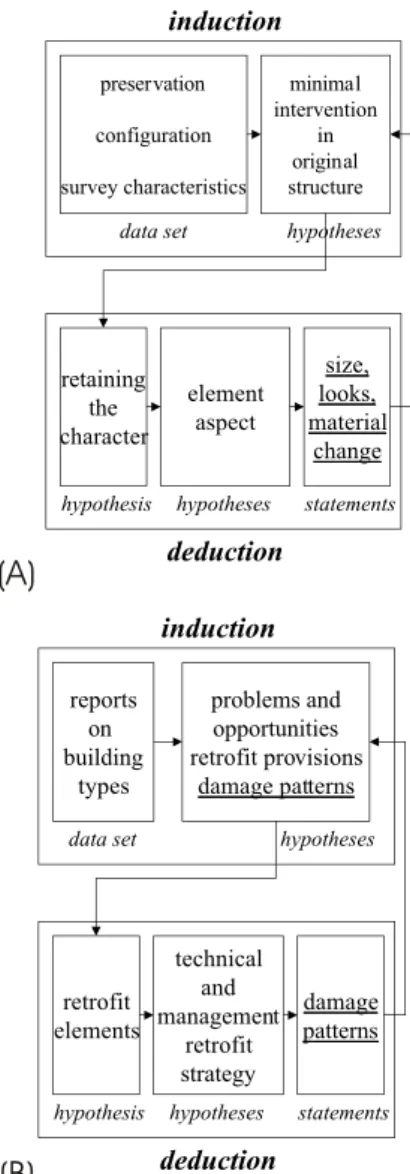
Fig. 2. Regression for determining the goals of the architect (a) and the criteria concerning the retrofit elements (b). For both data sets are obtained from case studies and the hypothesis for the decision tree induced. From these individual hypotheses a single hypothe-sis is obtained, to be integrated into the mission/recommendation. Then hypotheses for the individual elements are derived and finally statements about them deducted. These statements are feedback compared with the induced hypothesis in order to regressively re-formulate the later.
3 Multi-criteria decision making
Decision is an element in a management process. Risk man-agement is such a process, for which decisions are control options in mitigation/response operations. Consequently risk management builds on the task related understanding of man-agement. Task related management shows several dimen-sions. Such a dimension is the processural one, in which case the management elements are functions like planning, decision, implementation and control. In the structural di-mension management is seen from the technical side, and organisational and operational structures count to its
instru-ments. Along the personal dimension management is seen as a system and relates to the kinds of leadership employed, like participative/co-operative versus authoritative style. For the purpose of building decision making and implementing models, the personal dimension has been taken into consid-eration by modelling a participative system for multi-criteria decisions. A system can be also seen from alternative per-spectives: as an object or as a process (Bostenaru, 2002). Procesurally defined, a system is the organisation form of all material or ideal elements, which stay in an interaction rela-tionship one to another and belong to a functional whole. For decision making the systematic approach itself is relevant. In a systematic approach, an optimal system has to be found for each criterion and group of actors. A cybernetic analysis-synthesis approach was employed. This requires building models of these systems according to their descriptions and the related insights.
Joedicke (1976) analysed in his work techniques useful in building planning with emphasis on decision related as-pects. The usage of some of these techniques gives adequate instruments for a systematic decision. Such one is an ap-proach where characteristics and criteria are deducted based on analysis of existing projects, while know-how is derived by means of scientific disciplines. In this work, decision trees were modelled by regressive means using a related approach (Fig. 2). Knowledge about the interest groups to be consid-ered and their preferences was induced from the participative case studies. The obtained hypothesis concerned the func-tional structure for decision making. Goals for each actor were formulated on each level of intervention. In the first step of the deductive phase a general hypothesis had to be drawn out from the one formulated after induction. In a sec-ond step statements for a particular case can be derived. Such an experiment was the retrofit of reinforced concrete frame buildings (Table 1).
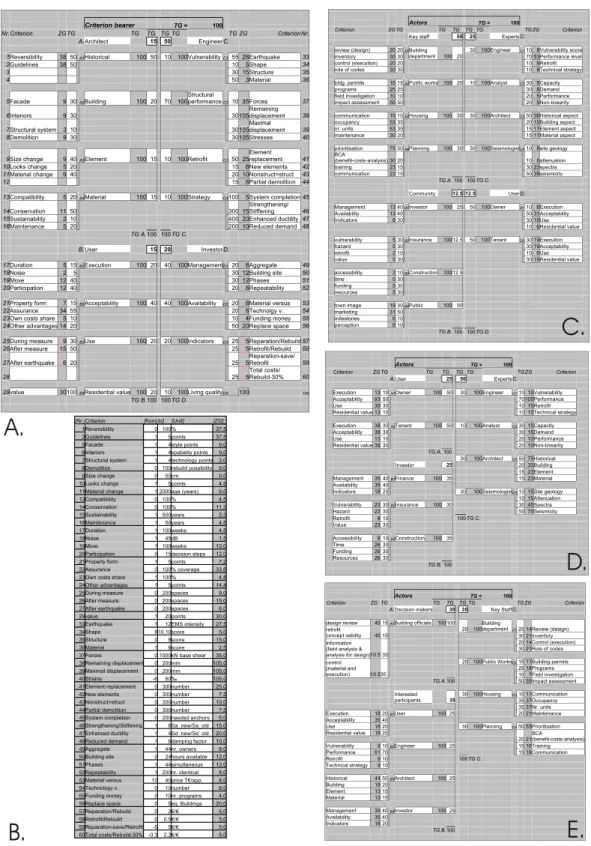
In each decision tree developed (called in this work ‘goal tree’), weights were set to measurable criteria (Figs. 3a, c–e). Weights were estimated while simulating a group decision making through a multi-criteria one, each actor correspond-ing to a criterion. They were assigned accordcorrespond-ing to the im-portance of the criterion, the reliability of the values measur-ing the criterion achievement degree, and the degree to which the judgement of a certain actor is relevant for a certain char-acteristic. The relative weight results from the multiplication of the weight of the goal and the weight of the sub-goal. The sum of all goal weights remains 1 (100%). Goals are related to characteristics, they represent a desirable value of a char-acteristic regarding a certain criterion. Figure 3b shows a step in the score assignment, namely defining the measurement spaces for the criteria. For example, the first group of criteria relevant for the structural engineer concern the vulnerability, set on urban scale. These are the design earthquake for the retrofit measure, which is influenced by its periodicity and maximal intensity. Rapid visual screening allows (FEMA, 1988) for setting scores for categories of buildings, the ty-pology of which is given by the construction material. It can be clearly seen that the group of engineering criteria ‘retrofit’
Actors TG = 100
Criterion ZG TG TG TG TG TG TG ZG Criterion
Key staff 50 25 Experts C.
review (design) 20 20 A1 30 100 Engineer C1 10 8 Vulnerability score
inventory 30 30
Building
department 100 20 70 53 Performance level
control (execution) 20 20 10 8 Retrofit
role of codes 30 30 10 8 Technical strategy
bldg. permits 15 15 A2 Public works 100 20 10 100 Analyst C2 30 8 Capacity
programs 25 25 30 8 Demand
field investigation 10 10 20 5 Performance
impact assessment 50 50 20 5 Non-linearity
communication 15 10 A3 Housing 100 30 30 100 Architect C3 50 38 Historical aspect
occupancy 53 35 20 15 Building aspect
nr. units 53 35 15 11 Element aspect
maintenance 30 20 15 11 Material aspect
prioritisation 75 50 A4 Planning 100 30 30 100 Seismologist C4 10 8 site geology
BCA (benefit-costs-analysis) 30 20 10 8 attenuation training 23 15 30 23 spectra communication 23 15 50 38 seismicity TG A. 100 100 TG C. Community 12.5 12.5 User D.
Management 13 40 B1 Investor 100 25 50 100 Owner D1 10 6 Execution
Availability 13 40 50 31 Acceptability
Indicators 6 20 30 19 Use
10 6 Residential value
vulnerability 5 30 B2 Insurance 100 12.5 50 100 Tenant D2 30 19 Execution
hazard 5 30 30 19 Acceptability
retrofit 2 10 10 6 Use
value 5 30 30 19 Residential value
accessibility 2 10 B3 Construction 100 12.5 time 5 30 funding 5 30 resources 5 30
town image 19 30 B4 Public 100 50
marketing 31 50 milestones 6 10 perception 6 10 TG B. 100 100 TG D. Criterion bearer TG = 100 Nr. Criterion ZG TG TG TG TG TG TG ZG Criterion Nr. A. Architect 15 50 Engineer C.
1 Reversibility 38 50 A1 Historical 100 50 10 100 Vulnerability C1 55 28 Earthquake 33 2 Guidelines 38 50 10 5 Shape 34 3 30 15 Structure 35 4 50 3 Material 36 5 Facade 9 30 A2 Building 100 20 70 100 Structural performance C2 10 35 Forces 37 6 Interiors 9 30 30 105 Remaining displacement 38 7 Structural system 3 10 30 105 Maximal displacement 39 8 Demolition 9 30 30 105 Stresses 40
9 Size change 9 40 A3 Element 100 15 10 100 Retrofit C3 50 25 Element replacement 41 10 Looks change 5 20 15 8 New elements 42 11 Material change 9 40 20 10 Nonstruct>struct 43
12 15 8 Partial demolition 44
13 Compatibility 5 20 A4 Material 100 15 10 100 Strategy C4 100 5 System completion 45
14 Conservation 11 50 300 15 Strengthening/ Stiffening 46 15 Sustainability 2 10 400 20 Enhanced ductility 47
16 Maintenance 5 20 200 10 Reduced demand 48
TG A. 100 100 TG C.
B. User 15 20 Investor D.
17 Duration 5 15 B1 Execution 100 20 40 100 Management D1 20 8 Aggregate 49 18 Noise 2 5 30 12 Building site 50 19 Move 12 40 30 12 Phases 51 20 Participation 12 40 20 8 Repeatability 52
21 Property form 7 15 B2 Acceptability 100 40 40 100 Availability D2 20 8 Material versus 53 22 Assurance 34 55 20 8 Technolgy v. 54 23 Own costs share 5 10 10 4 Funding money 55 24 Other advantages 14 20 50 20 Replace space 56
25 During measure 9 30 B3 Use 100 20 20 100 Indicators D3 25 5 Reparation/Rebuild 57
26 After measure 15 50 25 5 Retrofit/Rebuild 58 27 After earthquake 6 20 25 5 Reparation-save/ Retrofit 59 28 25 5 Total costs/ Rebuild-30% 60
29 value 30 100 B4 Residential value 100 20 10 100 Living quality D4 100 100
TG B. 100 100 TG D.
Actors TG = 100
Criterion ZG TG TG TG TG TG TG ZG Criterion
A. Decision makers 30 35 Key Staff C.
design review 45 15 A1 Building officials 100 100
20 100 Building
department C1 20 14 Review (design) retrofit
concept validity 45 15 30 21 Inventory 20 14 Control (execution) 30 21 Role of codes information
(field analysis &
analysis for design) 10.5 35 20 100 Public Works C2 15 11 Building permits
25 18 Programs control
(material and
execution) 10.5 35 10 7 Field investigation
TG A. 100 50 35 Impact assessment 30 100 Housing C3 10 11 Communication Interested participants 35 35 37 Occupancy 35 37 Nr. units
Execution 18 20 B1 User 100 25 20 21 Maintenance
Acceptability 35 40
Use 18 20 30 100 Planning C4 50 53 Prioritisation
Residential value 18 20
20 21
BCA (benefit-costs-analysis)
Vulnerability 9 10 B2 Engineer 100 25 15 16 Training
Performance 61 70 15 16 Communication Retrofit 9 10 100 TG C. Technical strategy 9 10 Historical 44 50 B3 Architect 100 25 Building 18 20 Element 13 15 Material 13 15 Management 35 40 B4 Investor 100 25 Availability 35 40 Indicators 18 20 TG B. 100 Actors TG = 100 Criterion ZG TG TG TG TG TG TG ZG Criterion A. User 25 50 Experts C.
Execution 13 10 A1 Owner 100 50 30 100 Engineer C1 10 15 Vulnerability
Acceptability 63 50 70 105 Performance
Use 38 30 10 15 Retrofit
Residential value 13 10 10 15 Technical strategy
Execution 38 30 A2 Tenant 100 50 10 100 Analyst C2 30 15 Capacity
Acceptability 38 30 30 15 Demand
Use 13 10 20 10 Performance
Residential value 38 30 20 10 Non-linearity
TG A. 100
30 100 Architect C3 50 75 Historical
Investor 25 20 30 Building
15 23 Element
Management 35 40 B1 Finance 100 35 15 23 Material
Availability 35 40
Indicators 18 20 30 100 Seismologist C4 10 15 Site geology
10 15 Attenuation
Vulnerability 23 30 B2 Insurance 100 30 30 45 Spectra
Hazard 23 30 50 75 Seismicity Retrofit 8 10 100 TG C. Value 23 30 Accessibility 9 10 B3 Construction 100 35 Time 26 30 Funding 26 30 Resources 26 30 TG B. 100
A.
B.
C.
D.
[Nr.] Criterion [from] to] [Unit] [ZG]
1 Reversibility 0 100 % 37,5 2 Guidelines 1 5 points 37,5 5 Facade 1 4 style points 9,0 6 Interiors 1 4 spatiality points 9,0 7 Structural system 1 4 technology points 3,0 8 Demolition 0 100 rebuild possibility 9,0 9 Size change 0 50 cm 9,0 10 Looks change 1 5 points 4,5 11 Material change 1 2000 age (years) 9,0 13 Compatibility 0 100 % 4,5 14 Conservation 0 100 % 11,3 15 Sustainability 1 500 years 2,3 16 Maintenance 1 50 years 4,5 17 Duration 1 100 weeks 4,5 18 Noise 1 45 dB 1,5 19 Move 1 100 weeks 12,0 20 Participation 0 15 decision steps 12,0 21 Property form 1 5 points 7,2 22 Assurance 0 100 % coverage 33,6 23 Own costs share 1 100 % 4,8 24 Other advantages 1 5 points 14,4 25 During measure 0 200 spaces 9,0 26 After measure 0 200 spaces 15,0 27 After earthquake 0 200 spaces 6,0 29 value 1 20 points 30,0 33 Earthquake 1 12 EMS intensity 27,5 34 Shape 8 10.10 score 5,0 35 Structure 0 8 score 15,0 36 Material 1 6 score 2,5 37 Forces 0 1000 kN base shear 35,0 38 Remaining displacement 0 200 mm 105,0 39 Maximal displacement 0 200 mm 105,0 40 Strains -6 60 ‰ 105,0 41 Element replacement 0 300 number 25,0 42 New elements 0 300 number 7,5 43 Nonstruct>struct 0 300 number 10,0 44 Partial demolition 0 300 number 7,5 45 System completion 0 200 needed anchors 5,0 46 Strengthening/Stiffening 1 6 Sa_new/Sa_old 15,0 47 Enhanced ductility 1 4 Sd_new/Sd_old 20,0 48 Reduced demand 1 6 damping factor 10,0 49 Aggregate 1 44 nr. owners 8,0 50 Building site 0 24 hours available 12,0 51 Phases 1 44 simultaneous 12,0 52 Repeatability 1 200 nr. identical 8,0 53 Material versus 10 40 price T€/app. 8,0 54 Technology v. 0 10 number 8,0 55 Funding money 0 10 nr. programs 4,0 56 Replace space 0 5 eq. Buildings 20,0 57 Reparation/Rebuild 0 2 €/€ 5,0 58 Retrofit/Rebuild 0 0.5 €/€ 5,0 59 Reparation-save/Retrofit -5 5 €/€ 5,0
60 Total costs/Rebuild-30% -0.3 2.2 €/€ 5,0
E.
Fig. 3. Decision tree considering different actors and respectively actors’ preferences to build the subdivision levels. The sum of the weights assigned to all actors together and for actors/sub-criterions respectively is each time 100%. (a) Criteria of the actor categories determined in the inductive process are assigned on a ‘coarse grid’ and a ‘fine grid’; (b) Measure space of the criteria. The criteria bearer from the decision tree in (a) are assigned each a unit of measure and a criterion value space (the columns [from] [to]). The weights for the sub-criterions are shown as well; (c) Interest groups provide for two levels in the decision tree. The same groups considered in (a), and additionally the ‘key staff’; (d) Same as (b) but only considering the actors in (a), and a relevant actor was chosen for the category ‘community’ (corresponding to ‘public’): the investor; (e) The highest level in the hierarchy, including the decision makers is considered. The actors shown at (a) are here ‘interested participants’ only (TG = relative weight, ZG = weight of the sub-criterion).
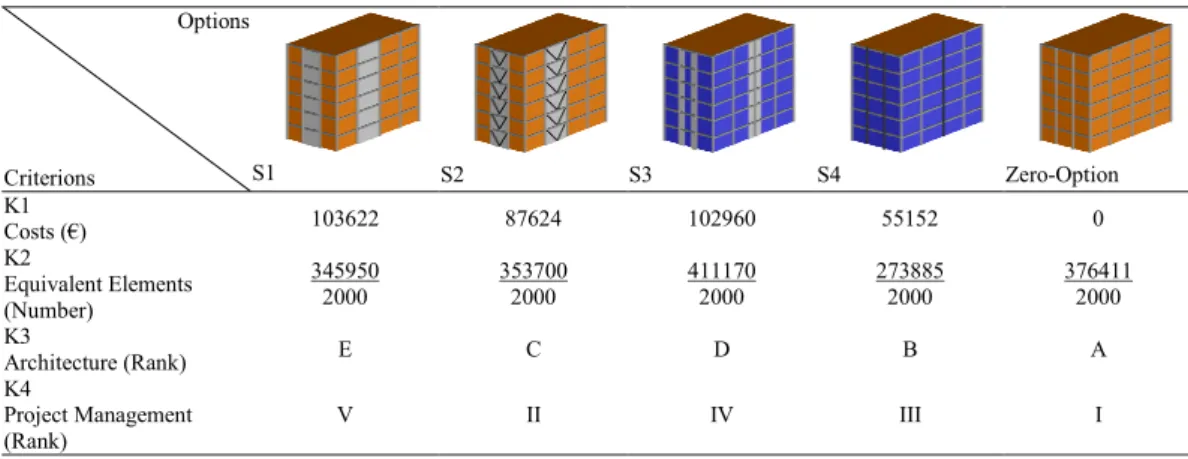
Table 1. Type alternatives of retrofit measures. K1 is a quantitative criterion: the strengthening costs using the respective retrofit alternative for the model building. K2 is also a quantitative criterion measured in the equivalent damage elements (total reparation costs for the whole building divided by the reparation costs for the highest damage in an element). K3 is a qualitative criterion (‘Influence on building appearance’) based on the degree influence the retrofit alternative has on flexibility in fac¸ade conformation. K4 is also a qualitative rank, meaning the extent to which activities inside the building are disturbed during the measure is applied. The retrofit alternatives considered are: addition of structural walls, steel braces and side walls respectively, as well as steel mantling and finally the status quo.
Options Criterions S1 S2 S3 S4 Zero-Option K1 Costs (€) 103622 87624 102960 55152 0 K2 Equivalent Elements (Number) 345950 2000 353700 2000 411170 2000 273885 2000 376411 2000 K3 Architecture (Rank) E C D B A K4 Project Management (Rank) V II IV III I
concerns which kind of ‘retrofit elements’ are used. The structural performance criteria set by an engineer concerns simulation results, which are flowing into the model-base, a part of the decision support system described by Malczewski (1999). The interest group ‘engineer’ is only interested in the technical strategies, to see which characteristics of the building are selectively enhanced through retrofit.
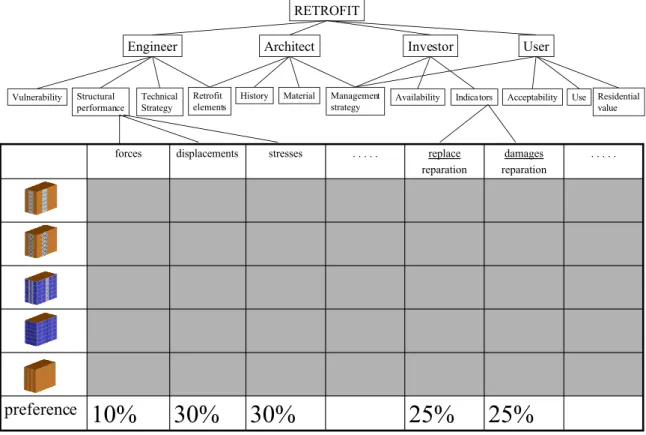
A reconfigured hierarchical ‘goal tree’ is shown in Fig. 4. The first level is represented by the problem different actors are dealing with. On the second level there are the actors themselves, treated further as criterions. The third level con-sists of the main criteria influencing the decision of these actors (corresponding to the “objectives” in Malczewski’s work, 1999). The fourth level, contains criteria which are subdivisions of those in the level above but are measurable (corresponding to the “attributes” in the work of Malczewski, 1999). This fourth level is included in a matrix. The other dimension of the matrix features retrofit alternatives: addi-tion of structural walls, steel braces and side walls respec-tively, as well as steel mantling and finally the status quo. Weights assigned as shown in Fig. 3 can be taken into con-sideration for each criterion in order to enable computing a score for the alternatives. For this both the outcome (fulfil-ment degree) of an alternative regarding a certain measur-able criterion (the grey zones in the tmeasur-able) and the weight are taken and summed. Should the pair wise comparison method be adopted instead, the preference weights are not necessary anymore. In this case the outcomes in each col-umn provide a ranking like that to be shown in Table 1, providing the basis for a subsequent balancing in the de-cision process. This way some particular criterion weight-ing rules can be considered: the costs-efficiency-analysis method of Richter and the “balancing principle” (Strassert, 1996). Richter’s method is documented in a university in-tern script (Richter, P.: “Wirtschaftliche Planung”.
Univer-sit¨at Karlsruhe, 1998), together with the use guidelines of a Microsoft Excel ® based tool to employ that (Richter, P. and Bogenst¨atter U.: “Planungs- und Bau¨okonomie”. Uni-versit¨at Karlsruhe, 1999), and an example individual study of the tool developer (Bogenst¨atter, U.: “Planungs- und Bau¨okonomie”. Universit¨at Karlsruhe, 1998). However, the basis for their development can be followed in more widely accessible literature (M¨oller, 1984; Schulte and Pierschke, 2000). M¨oller (1984) analyses four procedures for benefit-costs-investigation in construction:
– the benefit-costs-analysis, supposing conversion of all
goals to a monetary expression before measurement;
– the utility value analysis, in which all goals are
mea-sured by means of scores;
– the costs-efficiency-analysis, where the benefit is
mea-sured by scores and the costs in a monetary way;
– the pair-wise comparison, with selection decision based
on benefits and costs criterion-by-criterion comparison in qualitative cases, while weights are assigned on ordi-nal scale.
The decision trees in Fig. 3 include weights as defined from the costs-efficiency-analysis. Bogenst¨atter’s computer support for the costs-efficiency method involves three steps. First, the decision tree template is filled out (Fig. 3a). Cri-terion measurement spaces are filled out in another tem-plate (Fig. 3b). Finally, the benefit for the respective op-tion is assessed and the results are compiled in another ta-ble. Strassert’s (1996) method can be seen as a further de-velopment of the pair-wise comparison. This is a seven step method. In a first step options and criteria are preselected. The second step serves ranking the options. In a third step
25%
25%
30%
30%
10%
preference
. . . . . damages reparation replace reparation . . . . . stresses displacements forces RETROFITEngineer Architect Investor User
Vulnerability Retrofit elements Structural performance Technical Strategy Management strategy
History Material Availability Indica tors Acceptability Use Residential
value
Fig. 4. Framework showing the interdependence between the goals of different decision makers, objectives and options in multi-criteria decision for retrofitting existing buildings adapted to the related skeletal structure provided by Malczewski (1999). It consists of a matrix featuring in one dimension retrofit alternatives and in the other criteria resulting from a decision tree. The hierarchy of the later includes from top to bottom in: the problem different actors are dealing with (first level), the actors themselves, (second level), main criteria influencing the decision of these actors (third level), secondary criteria (fourth level). The interior fields of the table (in grey) are to be filled with the outcome value of an alternative regarding a certain measurable (secondary) criterion. The last row contains the weights assigned to various criterions by the decision makers’ preferences (as in Fig. 3).
characteristics are transformed into criteria. Decision prob-lems start to be stated in the fourth step. In the fifth step an advantages-disadvantages table is compiled. Step 6 com-prises determining the ranking space. The final step consists of a balancing loop. Balancing means in case of more ac-tors discussion until consensus. In the technical literature (Joedicke, 1976; M¨oller, 1984) an instrument to facilitate dis-cussion on actors’ preferences was deemed to be promising: the transformation curve. The transformation curve shows the way score evaluation depends on the properties of the evaluated object. Thus it expresses the value structure of the actor, on which subjective preferences are based. Transfor-mation curves for the actors’ criteria determined in this pa-per have not been yet developed. It is to be noted that the approach in ATC-40 (1996) comes close to both rules con-sidered: it provides for a data table for a decision matrix as required for the balancing principle of Strassert (1996) and it measures the criteria according to constraints by fixing limits like in the approach of Richter.
Table 1 includes ‘what to do’ action options, generated in the design phase, the same as shown in Fig. 4.
Loca-tion alternatives can also generate opLoca-tions. K1 is a quan-titative criterion meaning the strengthening costs for each retrofit alternative of the whole model building. The row including K1 is a ranking example from the point of view of the investor. To take into account the views of the struc-tural engineer, dynamic analysis under different earthquake loads was run. Simulation results were obtained from stress-strain based analysis. The time history log of failure in struc-tural elements was converted into a database of cumulative progressive damage for ‘retrofit elements’. K2 is a quantita-tive criterion as well, meaning ‘equivalent damage elements’, computed by counting the total reparation costs for the whole building divided by the reparation costs for the highest dam-age in an element. Ranking as provided by K3 follows the architect’s point of view. Stylistically representative build-ings (Table 2) were chosen. K3 is a qualitative criterion meaning ‘influence on building appearance’. Classes A to E are dictated by the degree of flexibility in fac¸ade confor-mation, influenced by the addition of further structural mem-bers. The Zero-Option (status quo) offers the highest flexibil-ity, through its skeletal structure. Steel mantling represents
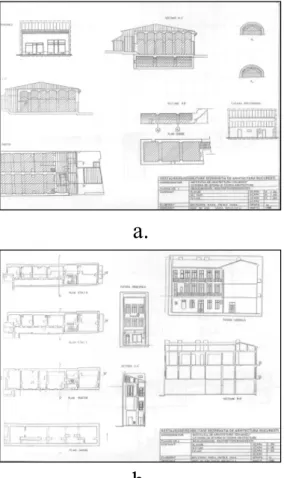
a.
b.
Fig. 5. Problems and opportunities at building level: (a) com-pleted survey form for a building rich in elements to be maintained (vaulted spaces); (b) completed survey form for a building with few elements to be maintained (fac¸ade and staircase only).
a minor change, through which eventually only concrete sur-faces intended to remain visible are influenced. Next one in the ranking succession is the variant with steel braces, where eventual openings are still possible in the correspond-ing frame fields, but these are affected either in their size or look by the diagonals. Side walls influence instead clearly the size of openings in these fields and there is no range for their look. And finally the structural walls added in the whole frame offer the least flexible solution, with strong con-straints concerning the possibilities for openings and retain-ing balconies. To take into account the inhabitant’s view, the project management plans for selected measures were made, so disruption in functionality can be appraised. K4 is also a qualitative rank, meaning ‘extent to which activities inside the building are disturbed during the measure is applied’. Maintaining the status quo is obviously the least disturbing measure, ranked with I. Next are ranked the measures featur-ing steel based retrofit elements, since these require mainly dry mounting methods. Interventions to column only like steel mantling (ranked III) or reinforced concrete side walls (ranked IV) are best performed from inside the building and
thus given a higher disturbance rank. Finally embedding a structural wall within a frame is disturbing most, implying also foundation works and would require moving a looking for alternative space during the measures. The criterions in-cluded in Table 1 can be found in the decision trees started from (Fig. 3). It proves the successful regression.
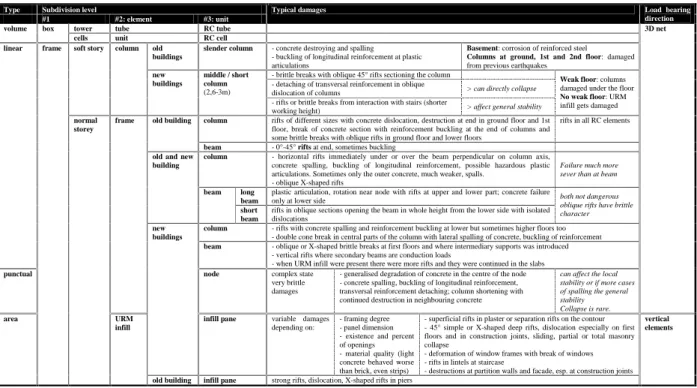
The decision making methods described above use an ex-plicit evaluation procedure. According to Joedicke (1976) such procedures are only possible, if considering more ac-tors, in advanced project phases. Joedicke (1976) sees in this case actors being the measurement instrument. These advanced phases are the ones when construction devices are elaborated, and when ‘retrofit elements’ are the main struc-turing factor. Table 3 shows typical damages at the so called ‘retrofit elements’, which are building elements defined from the architectural, building survey and engineering character-istics (Bostenaru, 2003).
4 Multi-criteria decision implementation
The decision process is seen from a managerial point of view, emphasizing the role of the planer in this process. The ‘ingredients’ of a strategic plan for seismic risk reduction are action plans, objectives, operative modalities, human re-sources, time and costs, aiming analysis, evaluation, prior-ity setting and communication. An urban project in existing context begins with a site analysis identifying vulnerabilities as problems and capacities as opportunities (Fig. 5). This brings the step of options in the so called ”intelligence” (Mal-czewski, 1999) phase of the strategic decision.
An exercise on the task, to plan such a strategic interven-tion in a test zone was worked up in two phases (Fig. 6). The first phase serves for the recognition of problems and opportunities in the zone, by means of which a diagnosis was seized and a mission was formulated. Innovative was first of all the analysis approach. The zone wasn’t uniformly assessed, but emphasing the relevant urban elements inde-pendently of scale. The method developed by Lynch in the book “The Image of the City” (Lynch, 1960) was employed. According to Lynch’s theory, those who enter a town, per-ceive it by means of landmarks, paths, districts, nodes and edges. Exactly these elements were identified for the anal-ysed zone (Fig. 7). The ‘goal tree’ was completed by iden-tifying characteristics as problems or opportunities accord-ing to their value in regard to certain criteria. To be high-lighted is the interdependency between the strengthening-opportunities/aggravating-problems (Fig. 8). If a proposed retrofit variant fulfils simultaneously some of these criteria, it can be talked of opportunities strengthening each other. If a retrofit variant fails to meet simultaneously some of these criteria, it can be talked of problems aggravating each other.
A mission for mitigation interventions is formulated in points without priorities. Each point is a sub-objective for a group of actors, meant to be reached through measures packages. Within the framework of the strategic planning also the means for reaching the envisaged goals are assigned.
Table 2. Database query results of most vulnerable buildings from a specific type in Bucharest, Romania, namely the inter-bellum ones. Number of flats, surfaces, as wells as damages and retrofit methods following the 1977 earthquake after Lungu and Saito (2001), costs estimated with the INCERC (2000) method. Average values are highlighted (EQ = earthquake, Y = yes, N = no, L = low, M = middle, E = extensive, X = some. A sum of buildings for which specific retrofit measures were applied was computed as well as a percentage for the selection of buildings in this table.).
damages in 1977 EQ Nr. In the ris k c at egory I lis t Addr es s Year of cons tr uction Us e Recesses ? B alcony?? FL OOR us e Number of f loor s Num ber of f lat s sur face ( sqm ) C olumns Beam s In fil l w alls C olumn ja ck eting Beam jacket ing M as onr y r epar ations E poxy r es ins injecti ons fi nis hings Mor tar in ject ions *par tial collaps e in 1977 E stima te d re tr of it c os ts today ( lei) Num ber of f lat s/ f loo r sur face/ f lat cost s/ f lat ( lei ) Fl at sur face/ aver age sur face -1
10 Maria Rosetti 55 1934 residential Y Y N 9 20 2209 L L E - - X - - X- 5.913.493 2110295.675 -0,20
11 Magheru 27 1935 residential ? ? Y 9 36 6405 L - - X - - - 17.146.185 4177476.283 0,27
16 Calea Victoriei 128A 1935 residential, commercial Y Y Y 9 22 6675 E E E X X X - - - - 17.868.975 2,5303812.2261,178
24 Ştirbei Vodă 17 1936 residential, commercial Y Y Y 9 58 6140 M M L - - X X- - - 16.436.780 6,5105283.393 -0,23
27 Calea Victoriei 208 1940 residential ? ? Y 8 44 5200 E M E - X X X- - - 13.920.400 5118316.373 -0,15
41 Poenaru Bordea 16 1936 residential ? ? N 8 30 3100 E L - - - 8.298.700 4103276.623 -0,25
43 Lahovary 5A 1935 residential, office Y Y Y 8 18 2955 E E E X X X X- X- 7.910.535 2164439.474 0,17
45 Nicolae Iorga 22 1939 residential Y Y N 7 31 3140 E L E X X X- - - - 8.405.780 4101271.154 -0,27 49 Pitar Moş 29 1936 residential ? ? N 7 59 4639 E E - X X - - - 12.418.603 8 78210.485 -0,43
57 Stelea Spătarul 17 1937 residential Y Y N 7 53 4125 E E M X X 1 - - - - 11.042.625 8 77208.351 -0,44
61 Bălcescu 25 (Wilson) 1928residential, office, commercial Y Y Y 12 93 12287 E E E X X X X X X X32.892.299 8132353.681 -0,05
91 Calea Victoriei 25 1936 residential, commercial Y N Y 13 49 6078 E E E X) - - X- - - 16.270.806 4124332.057 -0,10
93 Nicolae Golescu 5 1938 residential, commercial Y Y Y 10 21 1766 M L/M - - - 4.727.582 2 84225.123 -0,39
96 Mihai Eminescu 17 1937 residential, commercial N N Y 8 40 6063 L L L - - X - - - - 16.230.651 5151405.766 0,08
100 Nicolae Bălcescu 7 1933 residential, commercial Y Y Y 7 15 2730 L L E - - X X- - - 7.308.210 2182487.214 0,30
102 Luchian 3 1936 residential Y Y N 6 9 2067 M/E - E X - X - - - - 5.533.359 1,5229614.818 0,64
104 Calea Victoriei 33-35 1930 residential, commercial ? ? Y 6 39 4800 M M M X - X- - - - 12.849.600 6123329.477 -0,11
MEAN VALUE 9 37 4728 4139372.834
Min 6 9 1766 1,5 77208.351
Max 13 93 12287 8303812.226
Sum 9 6 12 6 1 3 1
% 8 5 11 5 0,9 2 0,9
A measures package includes: consensus (communication) means, implementation means and finally implementation plans at different levels and time horizons, taking form in ac-tion plans. Implementaac-tion means result in model and pilot projects for operations, which are also concretisation forms for action plans. As the result of the implementation has to be evaluated from time to time, the planning aim is not a product but an action and learning process for all implied ac-tors (see the diagram of learning process in Bostenaru, 2004). Thus time and human resources cannot be assigned to each objective like the operative modalities were.
For the impact assessment, lacking another measuring pos-sibilities, the classical regulation instruments could be taken: the indicators. The future development can be visualised, af-ter the collection of the respective data, through scenarios, vi-sions and simulations. Another unit of measure, different of indicators of all kind, is needed therefore, called here ‘seis-mic print’. The print measures the impact of an earthquake using a surface as an urban unit. In case of an earthquake each code defines the building categories which have to re-main fully operational. Thus an aggregate structure results representing the load-bearing capacity requested by the an-tiseismic intervention strategy from the urban system. An operation plan does not concern the zone, which is object of the study, only, but also the flows which connect it to another zones (Fig. 9). An operation plan can become in this case a
model project. It can be a demonstration of rehabilitation for upgrading seismic performance. The strategy must contain stimulation to participation and public sense of responsibil-ity. It counts on supporting the politic and administrative decisions for a new environment through a new behaviour of the people. A comprehensive scheme illustrating similar objectives to be followed and the actors to be involved in var-ious phases of seismic risk appropriation is shown in RISK-UE (2004). Information is important to build public ideas (as shown in the Gr¨unG¨urtel project, Frankfurt, Germany; see Koenigs, 1991). These open up ways for the strategy im-plementation. The participation is a feedback element in the urban planning operation. In this way the problems opened up by the new development are reduced to the scale of the cit-izen. Participation asserts in the first instance the problems coupled to the habitat, on the level of quality of life.
The scheme in Fig. 9 highlights the possible zoom be-tween layers at different scales and the concerns of three categories of actors at each of these. The subdivision into main layers like ‘zone’, ‘building’ and ‘element’ allows for the integration of information coming from so many different backgrounds. At each level the focus is on proprietary prob-lem statements, but communication with those bellow and above is allowed over zooming interfaces. On the right side the placement of the stages, for which specific approaches were developed, in the intermediary space between levels of
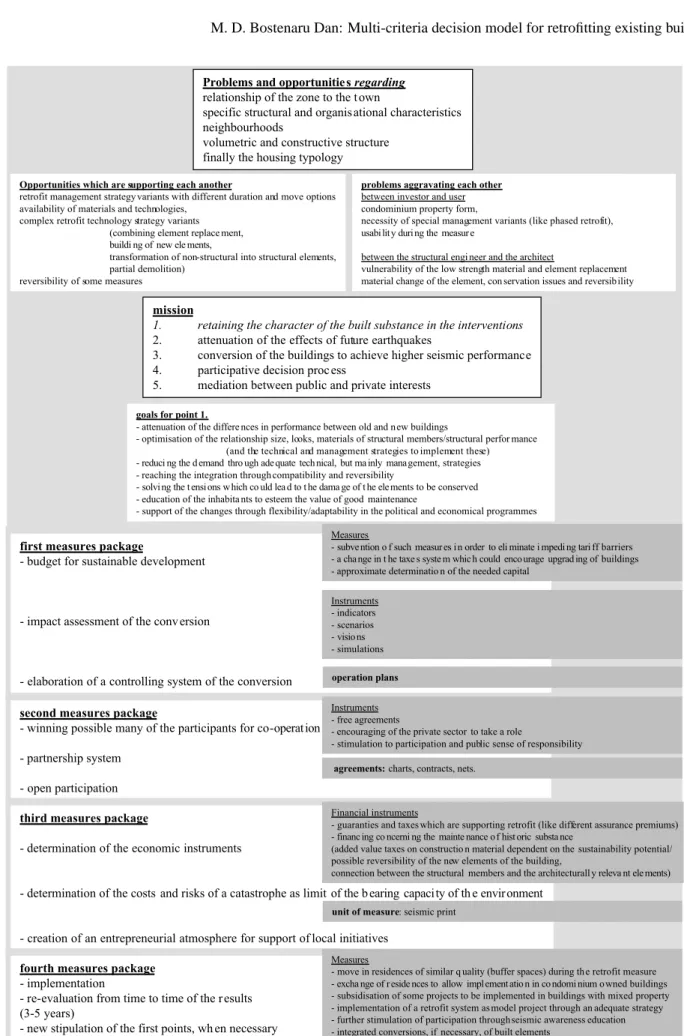
Problems and opportunitie s regarding
relationship of the zone to the t own
specific structural and organis ational characteristics neighbourhoods
volumetric and constructive structure finally the housing typology
Opportunities which are supporting each another
retrofit management strategy variants with different duration and move options availability of materials and technologies,
complex retrofit technology strategy variants (combining element replace ment, buildi ng of new ele ments,
transformation of non-structural into structural elements, partial demolition)
reversibility of some measures
problems aggravating each other
between investor and user condominium property form,
necessity of special management variants (like phased retrofit), usabi lit y duri ng the measur e
between the structural engi neer and the architect
vulnerability of the low strength material and element replacement material change of the element, con servation issues and reversib ility
mission
1. retaining the character of the built substance in the interventions
2. attenuation of the effects of future earthquakes
3. conversion of the buildings to achieve higher seismic performance
4. participative decision proc ess
5. mediation between public and private interests
goals for point 1.
- attenuation of the differe nces in performance between old and n ew buildings
- optimisation of the relationship size, looks, materials of structural members/structural perfor mance (and the technical and management strategies to implement these) - reduci ng the d emand thro ugh ade quate tech nical, but ma inly management, strategies - reaching the integration through compatibility and reversibility
- solvi ng the t ensi ons w hich co uld lea d to t he dama ge of t he ele ments to be conserved - education of the inhabita nts to esteem the value of good maintenance
- support of the changes through flexibility/adaptability in the political and economical programmes
first measures package
- budget for sustainable development
- impact assessment of the conv ersion
- elaboration of a controlling system of the conversion
Measures
- subve ntion o f such measur es i n order to eli minate i mpedi ng tari ff barriers - a cha nge in t he taxe s syste m whic h could enco urage upgrad ing of buildings - approximate determinatio n of the needed capital
Instruments - indicators - scenarios - visio ns - simulations operation plans
second measures package
- winning possible many of the participants for co-operat ion - partnership system
- open participation
Instruments - free agreements
- encouraging of the private sector to take a role
- stimulation to participation and public sense of responsibility
third measures package
- determination of the economic instruments
- determination of the costs and risks of a catastrophe as limit of the b earing capacity of th e envir onment
- creation of an entrepreneurial atmosphere for support of local initiatives Financial instruments
- guaranties and taxes which are supporting retrofit (like different assurance premiums) - financ ing co ncerni ng the mainte nance o f hist oric substa nce
(added value taxes on constructio n material dependent on the sustainability potential/ possible reversibility of the new elements of the building,
connection between the structural members and the architecturall y releva nt ele ments)
fourth measures package
- implementation
- re-evaluation from time to time of the r esults (3-5 years)
- new stipulation of the first points, wh en necessary
Measures
- move in residences of similar q uality (buffer spaces) during th e retrofit measure - excha nge of r eside nces to allow impl ement atio n in co ndomi nium o wned buildings - subsidisation of some projects to be implemented in buildings with mixed property - implementation of a retrofit system as model project through an adequate strategy - further stimulation of participation through seismic awareness education - integrated conversions, if necessary, of built elements
unit of measure: seismic print agreements: charts, contracts, nets.
Fig. 6. Some ‘ingredients’ of an urban strategic plan for seismic retrofit. From top to bottom: problems/opportunities, diagnosis, mission, measures packages with implementation means.
Table 3. Retrofit elements in the judgemental phase showing typical damages (after Bostenaru, 2003). RC = reinforced concrete, URM = unreinforced masonry, 3D = three dimensional, ‘cellular’ and ‘fagure’ are the local names for two typical Romanian construction techniques.
Table 3. Retrofit elements in the judgemental phase showing typical damages (after Bostenaru, 2003)b Type Subdivision level
#1 #2: element #3: unit
Typical damages Load bearing
direction
tower tube RC tube
volume box
cells unit RC cell
old buildings
slender column - concrete destroying and spalling
- buckling of longitudinal reinforcement at plastic articulations
Basement: corrosion of reinforced steel Columns at ground, 1st and 2nd floor: damaged
from previous earthquakes - brittle breaks with oblique 45° rifts sectioning the column
- detaching of transversal reinforcement in oblique
dislocation of columns > can directly collapse
soft story column
new buildings
middle / short column
(2,6-3m)
- rifts or brittle breaks from interaction with stairs (shorter
working height) > affect general stability
Weak floor: columns
damaged under the floor
No weak floor: URM
infill gets damaged
column rifts of different sizes with concrete dislocation, destruction at end in ground floor and 1st
floor, break of concrete section with reinforcement buckling at the end of columns and some brittle breaks with oblique rifts in ground floor and lower floors
rifts in all RC elements
old building
beam - 0°-45° rifts at end, sometimes buckling
column - horizontal rifts immediately under or over the beam perpendicular on column axis,
concrete spalling, buckling of longitudinal reinforcement, possible hazardous plastic articulations. Sometimes only the outer concrete, much weaker, spalls.
- oblique X-shaped rifts
Failure much more sever than at beam long
beam
plastic articulation, rotation near node with rifts at upper and lower part; concrete failure only at lower side
old and new building
beam short beam
rifts in oblique sections opening the beam in whole height from the lower side with isolated dislocations
both not dangerous oblique rifts have brittle character
column - rifts with concrete spalling and reinforcement buckling at lower but sometimes higher floors too
- double cone break in central parts of the column with lateral spalling of concrete, buckling of reinforcement
linear
beam - oblique or X-shaped brittle breaks at first floors and where intermediary supports was introduced
- vertical rifts where secondary beams are conduction loads
- when URM infill were present there were more rifts and they were continued in the slabs
punctual
frame
node complex state
very brittle damages
- generalised degradation of concrete in the centre of the node - concrete spalling, buckling of longitudinal reinforcement, transversal reinforcement detaching; column shortening with continued destruction in neighbouring concrete
can affect the local stability or if more cases of spalling the general stability Collapse is rare.
3D net
new buildings
infill pane variable damages
depending on:
- framing degree - panel dimension - existence and percent of openings - material quality (light concrete behaved worse than brick, even strips)
- superficial rifts in plaster or separation rifts on the contour - 45° simple or X-shaped deep rifts, dislocation especially on first floors and in construction joints, sliding, partial or total masonry collapse
- deformation of window frames with break of windows - rifts in lintels at staircase
- destructions at partition walls and facade, esp. at construction joints
area frame normal storey URM infill
old building infill pane strong rifts, dislocation, X-shaped rifts in piers
vertical elements
b RC = reinforced concrete, URM = unreinforced masonry, 3D = three dimensional, ‘cellular’ and ‘fagure’ are the local names for two typical Romanian construction techniques.
action can be seen. Setting risk evaluation criteria is based on data collection on urban scale and setting building priorities on building scale, implying hazard, vulnerability and capac-ity appraisal of the inventory. It is a step between problem definition and criterion weighting in the “intelligence” (Mal-czewski, 1999) phase. The choice takes place in the decision space between setting priorities on building scale and issuing the recommendation. Priorities are set according to decision rules agreed by the actors based on the ‘goal tree’ (Fig. 8) taken into consideration as shown in Fig. 1. The recommen-dation for a certain building retrofit system is put forward on detailed building element scale. The main constraints are the goals, the instruments, the benefits and the costs. The last step in the decision process is the efficiency evaluation. After agreeing about the retrofit system a retrofit strategy of that has to be designed. This ‘implementability’ evaluation calls for an impact study spanning between quality improve-ment, legal frame, potential acceptance and level of action as constraints and aiming at choosing a site for implementa-tion, a corresponding implementation program and adequate resources. On the left side categories of actors and their ways of acting when dealing with the problem ‘retrofit of existing buildings’ can be seen at the same three levels sketched in the zooming diagram on the right side. An “image” can be mar-keted to the wide public. This means on urban level setting landmarks (Lynch, 1960). On building level there are more specific views and the accent in marketing actions moves to-wards the silhouette and the interaction of a certain building with the built context. On the level of a building element re-lated differences are given by texture and building material.
There are more and more perception details. The operations concerning the application of a construction measure have to be managed. This is an experts’ task and is made differently at various scales. Urban plans are part of the management strategy, they act as integrating vision. On building level the planning, with more details than in the layer above, is con-cerned with project management tasks. Building elements are the object of expert simulations for the technical strategy managing a retrofit solution. The participation of active af-fected people is a process and has to be treated accordingly. On the large urban scale there is no hierarchy of the actors, only a network in order to build the “image” (Lynch, 1960) of the site. Closer, on the building layer, there is place for talks between the participants, for example in a neighbour-hood forum. Details can even request for a workgroup in special workshops.
Problem based orientation, differentiation of the actors as well as identification and activation of target groups lead to education, which accentuates personal implication and ac-tion motivaac-tion. Within the strategic planning classical plans and traditional organisation structures are not anymore out-going or endpoint of the planning procedure, but elements in a dynamic process. The plan, which can exercise its power through its integrating vision, is part of the strategy (Fig. 7).
5 Discussion
The application to the problem of building retrofit can be cast into the generic framework for multi-criteria decision analy-sis. The data examination means identifying the problems,