HAL Id: tel-01853705
https://hal-enpc.archives-ouvertes.fr/tel-01853705
Submitted on 3 Aug 2018
HAL is a multi-disciplinary open access
archive for the deposit and dissemination of
sci-entific research documents, whether they are
pub-lished or not. The documents may come from
teaching and research institutions in France or
abroad, or from public or private research centers.
L’archive ouverte pluridisciplinaire HAL, est
destinée au dépôt et à la diffusion de documents
scientifiques de niveau recherche, publiés ou non,
émanant des établissements d’enseignement et de
recherche français ou étrangers, des laboratoires
publics ou privés.
New Ways to Collect Traffic Data, New Challenges for
Road Network Authorities
Luc Charansonney
To cite this version:
Luc Charansonney. New Ways to Collect Traffic Data, New Challenges for Road Network Authorities.
Other. Université Paris-Est, 2018. English. �NNT : 2018PESC1013�. �tel-01853705�
Thèse de doctorat d’Université Paris-Est
Ecole Doctorale Ville, Transports et Territoires
Discipline : Transport
F 8 f
Nouvelles méthodes
de collecte des données de trafic,
nouveaux enjeux
pour les gestionnaires de voirie
8
New Ways
to Collect Traffic Data,
New Challenges
for Road Network Authorities
F 8 f
Luc Charansonney
Décembre 2013 – Janvier 2018
Thèse dirigée par Vincent Aguiléra
8
Thèse soutenue le mercredi 30 mai 2018
8
Jury
Alexandre Caminada, Président
Christine Buisson, Rapporteur
Cristina Pronello, Rapporteur
Mathieu Flonneau, Examinateur
Hector : C’est beau, la Grèce ? [...] Hélène : C’est beaucoup de rois et de chèvres éparpillés sur du marbre. Hector : Si les rois sont dorés et les chèvres angora, cela ne doit pas être mal au soleil levant.
— Jean Giraudoux La Guerre de Troie n’aura pas lieu
Contents
Acknowledgments 15
Foreword 17
Introduction 19
1 Context of the PhD memoir . . . 19
2 The Paris region and the author’s position . . . 19
3 Questioning . . . 20
1 Paris and its Traffic 23 1.1 Traffic: a supply and demand interaction . . . 23
1.1.1 The supply . . . 24
1.1.2 The demand . . . 24
1.1.3 Information, in between supply and demand . . . 25
1.1.3.1 Information, from demand to supply . . . 25
1.1.3.2 Information, from supply to demand . . . 26
1.1.3.3 Traffic data, traffic information . . . 26
1.2 The Paris region case . . . 28
1.2.1 The administrative status of the City of Paris and its region . . . 28
1.2.2 The development of the road network infrastructure (1930s-1970s) . . . . 30
1.2.3 The administrative landscape in charge of the road network . . . 31
1.2.4 The inception and current state of traffic management in Paris region . . 31
1.2.4.1 Paris Region State expressways . . . 32
1.2.4.2 Paris region arterials . . . 33
1.2.4.3 The City of Paris network . . . 33
1.3 The author’s missions and stance . . . 34
1.4 The author’s research question . . . 35
I
Traffic data and traffic information: linking the Traffic
Manage-ment Center and the driver
37
Introduction to the First Part 39 2 The “new” against the “old” ? The quantification of traffic 41 2.1 Introduction . . . 412.2 The inception of traffic data: from traffic census to traffic theory, early traffic variables . . . 42
2.2.2 The first aerial observations of traffic, and subsequent theorization:
1920s-1930s . . . 43
2.2.3 The work of Greenshields: 1930s-1940s . . . . 49
2.3 The era of traffic engineering manuals: 1940s–1950s . . . 54
2.3.1 The Institute of Traffic Engineers’ 1941 Traffic Engineering Handbook . . 54
2.3.1.1 Vehicular volumes and the Short Count method . . . 55
2.3.1.2 Spot Speed Studies . . . 56
2.3.1.3 Speed and delay . . . 56
2.3.1.4 Origin and destination . . . 57
2.3.1.5 Subsequent editions . . . 57
2.3.2 The Highway Capacity Manual (HCM) . . . 58
2.3.2.1 1950: the HCM’s first edition . . . 58
2.3.2.2 1965: the HCM’s second edition . . . 61
2.3.3 The Bureau of Highway Traffic’s 1955 manual: Traffic engineering . . . . 63
2.3.3.1 Definitions of speed . . . 63
2.3.3.2 The traffic volume . . . 65
2.3.3.3 The origin and destination of traffic . . . 66
2.3.4 Statistics with applications to highway traffic analyses . . . 66
2.4 Towards modern definition of traffic flow variables . . . 67
2.4.1 Wardrop’s 1952 “Some Theoretical Aspects of Road Traffic Research”: the need for theory for a practical subject . . . 68
2.4.1.1 Formalized definitions for space-mean and time-mean speeds . . 68
2.4.1.2 Wardrop’s view of the flow-speed relationship . . . . 71
2.4.1.3 Some theory for before-after studies . . . 71
2.4.1.4 Wardrop’s work reception by his fellow engineers . . . . 71
2.4.2 The traffic stream model: Lighthill and Whitham’s 1955 “On Kinematic Waves. II. A Theory of Traffic Flow on Long Crowded Roads” . . . 72
2.4.2.1 Establishing the equation system . . . 72
2.4.2.2 Kinematic waves for traffic . . . 74
2.4.3 “Discussion of traffic stream measurements and definitions” . . . 76
2.4.4 Mathematical Theories of Traffic Flow . . . 79
2.5 Traffic indicators for network assessment . . . 80
2.5.1 Vehicle miles traveled, vehicle kilometers traveled . . . 80
2.5.2 Travel-times and Speeds . . . 81
2.6 Traffic data in Paris: from manual counts to centralized collection . . . 83
2.6.1 Traffic counts . . . 83
2.6.2 Centralized traffic data collection to quantify the traffic state: from assess-ing the system performance to measure the decrease of traffic demand . . 87
2.7 Conclusion . . . 97
3 The evolving relationship between drivers and road authorities: occasional, centralized, then shared. Paris and Lyon cases, from the 1920s onward. 99 3.1 1920s to the 1950s: informing drivers, a back-burner issue for road authorities . . 101
3.1.1 Public and private devices for occasional drivers . . . 102
3.1.2 Towards signing policies to fight congestion . . . 103
3.2 1950s-1980s: drivers in a stream . . . 104 3.2.1 Traffic flow information as a key traffic management tool for roads authorities104
3.2.2 Traffic flow at the core of coordinated policies . . . 105
3.3 From the 1980s to nowadays: back to individual drivers . . . 106
3.3.1 The central systems era: public monopoly over drivers . . . 106
3.3.2 Drivers as probes: public and private conflicts . . . 107
3.4 Conclusion . . . 109
Conclusion of the First Part 115
II
“New” traffic data: expanded ways to assess traffic
119
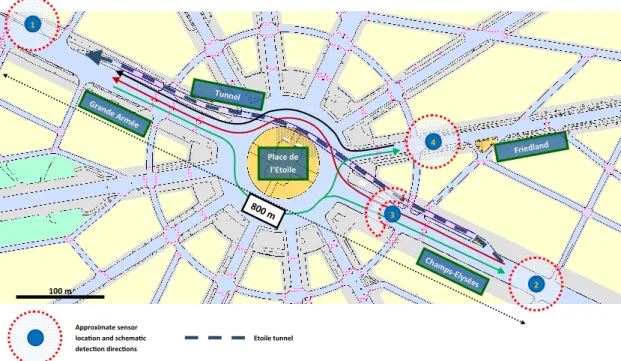
Introduction to the Second Part 121 4 Place de l’Etoile: First encounter with Bluetooth beacons 127 4.1 Closing a tunnel under one of Paris’ major traffic hubs . . . 1274.2 Diagnosis of the traffic conditions on the place de l’Etoile through the legacy sensor-based method . . . 128
4.3 The Bluetooth technology to estimate travel-time . . . 136
4.4 Setting up the Bluetooth beacons and gathering the first data . . . 137
4.4.1 Setting up the Bluetooth beacons . . . 137
4.4.2 Gathering “reference” data and first observations . . . 139
4.4.3 O-D patterns as shown by the Bluetooth detection . . . 142
4.4.4 Type of equipments distribution on the global dataset (all routes) . . . . 142
4.5 The Champs Elysées to Grande Armée route: investigating the properties of the Bluetooth travel-times . . . 144
4.5.1 Records count . . . 144
4.5.2 Equipment types . . . 145
4.5.3 Travel-time distribution (general and split by equipment type) . . . 145
4.5.4 Travel-time time series . . . 147
4.5.5 A Bluetooth fundamental diagram? . . . 149
4.6 After the tunnel’s closure: the distribution of Bluetooth travel-times . . . 154
4.6.1 The Champs Elysées to Grande Armée origin-destination . . . 155
4.6.2 The Grande Armée to Friedland origin-destination . . . 157
4.7 Conclusion . . . 162
5 Voie Express Rive Droite: Bluetooth beacons for a major road closure 165 5.1 Introduction . . . 165
5.2 Context . . . 166
5.2.1 The Seine riverbanks as a major arterial . . . 166
5.2.2 Closing the expressway . . . 167
5.2.3 A progressively widened Bluetooth deployment program to assess travel-times . . . 168
5.2.3.1 The first deployment phase . . . 168
5.2.3.2 The second deployment phase . . . 169
5.2.3.3 The third deployment phase: four additional beacons for ind-bound and outind-bound routes . . . 169
5.3 An operational issue for Bluetooth travel-times: discriminating routes on the Right Bank . . . 171
5.3.1 Possible routes for the same origin-destination pair . . . 171
5.3.2 The origin-destination travel-time distribution . . . 172
5.3.3 Ruling out heavy time variations . . . 173
5.3.4 Ruling out equipment types influences . . . 174
5.3.5 Two underlying travel-time distributions for two distinct routes . . . 175
5.4 Bluetooth detection: free-flow travel-time and traffic penetration . . . 180
5.4.1 The importance of free-flow travel-times . . . 180
5.4.1.1 Background on free-flow travel-time and free-flow space-mean speed180 5.4.1.2 Preliminary analysis of the Bluetooth travel-times on Bd Saint-Germain . . . 181
5.4.1.3 Characterizing the arterial free-flow speed . . . 181
5.4.2 Travel-times on St Germain: distribution of Bluetooth headways . . . 184
5.4.2.1 The rare event assumption for Bluetooth-enabled device occurrence185 5.4.2.2 Approximation by a homogeneous Poisson point process . . . 185
5.4.2.3 A series of homogeneous Poisson point processes for periods of constant traffic conditions . . . 186
5.5 From the Traffic Management Center’s perspective: how to deal with Bluetooth travel-times and legacy loops data . . . 189
5.6 Comparing the travel-times: operational conclusions on the operation . . . 192
5.6.1 The Right Bank . . . 192
5.6.1.1 Travel-times comparisons . . . 192
5.6.1.2 Travel-times trends . . . 196
5.6.2 The Left Bank . . . 196
5.6.2.1 Travel-times comparisons . . . 196
5.6.2.2 Travel-times trends . . . 201
5.7 Conclusion . . . 203
6 GPS speed FCD: the story of two different providers 205 6.1 Introduction . . . 205
6.2 Whereabouts of GPS FCD data . . . 206
6.2.1 The floating car, an old idea . . . 206
6.2.2 The dawn of the GPS era: first assessments of GPS use aboard a vehicle . 207 6.2.3 Late 2000s production-ready experiments: the “Mobile Century” and “Mo-bile Millenium” Experiments . . . 210
6.2.3.1 A probe-vehicle based and privacy-aware Traffic Management Center: the “Mobile Century” experiment . . . 210
6.2.3.2 The “Mobile Millenium” experiment: the proof of concept of a crowdsourced Traffic Management Center . . . 213
6.2.4 The private market issue: a gap between research programs and commer-cially available data . . . 214
6.2.4.1 Commercial GPS receivers data . . . 214
6.2.4.2 Commercial GPS FCD data . . . 215
6.3 Tendering for GPS FCD: initial tender and first encountered issues (2014) . . . . 216
6.3.1 GPS FCD: the process at stake . . . 216
6.3.2 The data available on the market . . . 218
6.3.3 The first tender data structure . . . 219
6.3.5 The distribution of instantaneous speeds . . . 221
6.3.6 Deterministic peaks . . . 222
6.3.7 The time dependency of the number of GPS FCD positions . . . 224
6.3.8 Multiple records . . . 227
6.3.9 The space dependency of the number of GPS FCD positions . . . 229
6.4 The second tender: confronting data from two providers . . . 232
6.4.1 Changes from the first tender . . . 232
6.4.1.1 A new definition for sections’ refresh rates . . . 232
6.4.1.2 A new definition for instantaneous speed data . . . 233
6.4.2 Data comparison between Provider 1 and Provider 2 . . . 233
6.4.2.1 Compared distributions of instantaneous GPS speeds . . . 233
6.4.2.2 Time series and the importance of sections’ refresh rate . . . 236
6.4.2.3 Differences in average speeds . . . 238
6.5 Conclusion: Lessons learned, a guideline of good usage . . . 242
6.5.1 The road network graph, and the question of the sections definition . . . 242
6.5.2 Offline data for statistics . . . 243
6.5.3 Final words on the Chapter . . . 243
7 GPS speed FCD: assessing speed-related policies 245 7.1 Introduction . . . 245
7.2 Background on speed-limit reduction policies . . . 246
7.2.1 Road safety . . . 246
7.2.2 Environmental aspects . . . 246
7.3 Paris 30 km.h´1 zones . . . . 248
7.3.1 The GPS data availability in the zone . . . 248
7.3.2 Comparing speed distributions . . . 250
7.4 Ringway at 70 . . . 253
7.4.1 Traffic data collection and associated indicators on the ringway . . . 253
7.4.2 Comparing GPS speed distributions . . . 256
7.4.3 Loops and GPS speeds: a question of averages . . . 261
7.5 Conclusion . . . 265
Conclusion of the Second Part 267 General conclusion 271 1 The political context: reducing motor traffic in Paris . . . 271
2 The operational context: the Poste Central d’Exploitation Lutèce, monitoring traffic on Paris arterials . . . 271
2.1 The missions of the PCE Lutèce . . . 271
2.2 A centralized and comprehensive technical infrastructure to support its missions . . . 272
2.3 Traffic indicators: quantifying the traffic and assessing congestion . . . 272
2.4 A major technological shift in traffic data collection: “new” traffic data . . 273
3 The author’s research question . . . 273
4 The author’s response to his research question . . . 274
4.1 The technical filiation of centralized traffic management: the legacy of the point observation of traffic . . . 274
4.2 Experimenting and assessing “new” traffic data: a critical analysis of the work carried out . . . 275 4.2.1 The difference of nature between GPS and Bluetooth travel-times 276 4.2.2 Assessing new travel-time measures, and the “reference” issue . . 277 4.2.3 Travel-time variability . . . 278 5 Down the road... beyond the author’s work . . . 279 5.1 Possible real-time and off-line uses . . . 279 5.2 Measuring congestion: the need for both “legacy” and “new” traffic data . 279 5.3 Decaying point traffic sensors, outsourcing traffic data: challenges for
Traf-fic Management Centers . . . 280
Bibliography 280
List of Figures 291
New ways to collect traffic data, new challenges for road
network authorities
Luc Charansonney
Thesis directed by Vincent Aguiléra
English Abstract
Road traffic evolves in a context which has undergone three major changes in the past two decades: first, a political change, reshaping the car’s role in cities; second, a technical change, through which both vehicles and drivers emit and receive information independently of road authorities’ roadside infrastructure; and finally, a financial change, as traffic management infras-tructure has heavily relied on public funding which now becomes scarcer.
From the perspective of a key road authority, the City of Paris, the Author, in charge of assessing the impact on traffic flow of major disruptive policies, addresses how “new traffic data” renews the road authority’s knowledge of the traffic, on technical grounds.
The Author has worked on Bluetooth travel-time and GPS based Floating Car Data datasets. He believes he makes two major contributions in the field.
He first shows that traffic data and traffic information have always been at the core of the road authority’s concerns, deeply related to the available technology, the missions of the road authority, and the theory attempting to bridge the gap between the two.
Through the technical assessment of traffic-related policies (road closures, speed-limit reduc-tion), based on two types of “new traffic data” (GPS speeds and Bluetooth travel-times), the Author analyzes the characteristics of the two datasets, the results they yield and how they com-plement legacy fixed-sensor based data. They allow the road authority to grasp user-perspective information whereas legacy data mostly offered a collective flow perspective. This, in turn, reshapes the decision-making process of road authorities.
Nouvelles méthodes de collecte des données de trafic,
nouveaux enjeux pour les gestionnaires de voirie
Luc Charansonney
Thèse dirigée par Vincent Aguiléra
French Abstract (Résumé en français)
Le trafic routier évolue dans un contexte qui a connu trois changements majeurs ces deux dernières décennies : changement politique tout d’abord, avec la remise en cause de la place jusque-là occupée par la voiture en ville ; changement technologique ensuite, par lequel tant le véhicule que son conducteur produisent et reçoivent des données indépendamment des infrastruc-tures de gestion du gestionnaire ; changement financier enfin, alors que les systèmes de gestion du trafic sont très dépendants de finances publiques de plus en plus contraintes.
Dans ce contexte, l’auteur, du fait de ses fonctions, adopte le point de vue d’un gestionnaire de voirie clé, la Ville de Paris. En charge de l’évaluation des conséquences techniques des politiques de circulation sur l’écoulement du trafic motorisé, il s’intéresse ici à la manière dont les “nouvelles données de trafic” renouvellent la connaissance technique du gestionnaire sur la demande.
Pour ce faire, l’auteur montre d’abord que les données de trafic et l’information trafic ont toujours été au cœur des préoccupations du gestionnaire. Données et information sont profondé-ment liées à la technologie disponible et aux missions mêmes du gestionnaire. Les développeprofondé-ments théoriques, alimentés par les données, tentent ainsi de lier les technologies avec les missions du gestionnaire.
Ensuite, à travers l’évaluation technique de politiques de circulation (fermetures de voie, réduction de la vitesse limite) sur la base de deux types de “nouvelles données” (vitesses GPS et temps de parcours Bluetooth), l’auteur analyse les caractéristiques de ces jeux de données, les résultats auxquels ils permettent de parvenir, et la manière dont ils complètent la connaissance tirée des capteurs fixes historiques. Ces “nouveaux” jeux de données permettent au gestionnaire d’obtenir une connaissance de la demande du point de vue des usagers, alors que les capteurs fixes fournissent principalement un point de vue collectif de flux. Cette richesse nouvelle d’information redéfinit les schémas de décision du gestionnaire de voirie.
Acknowledgments
I have plenty of metaphors coming to mind to describe my thesis: an odyssee across the Aegean, a winding mountain road, a foggy lake, a ride on a Paris suburban train at peak time...
Anyway, along my work, I have been accompanied, led, beared by many people.
The first person I’d like to thank here is my beloved Director, Vincent Aguiléra, for all his work and support.
At my workplace, the PCE Lutèce, I would like to thank all the colleagues. I especially thank Michel, Ghislaine and Calixte for easing my professional missions and my thesis: although the two evidently overlapped, they often followed different paths. I thank Gérard for introducing me to traffic management and the subtelties of Parisian traffic engineering. I thank Philippe for providing the required IT material and listening to my thoughts.
I would like to thank all the companies with which I have worked for the traffic data and equipments I based my work on.
At the lab, I thank the many people I’ve met, discussed with, drank (more or less good) tea with, joked with... The lab board (Pierre, Sophie), the lab administration (Sandrine, Sandrine, Virginie), the Ecole des Ponts library (Delphine), the lab researchers (Alexis, Anne, Cyril, Gaële, Laurent, Laurent, Mariane, Nicolas, Philippe, Virginie, Zoi, ...), my fellow PhD students (Aude, Benoît, Emmanuel, Joséphine, Louis, Mallory, Matthieu, Maylis, Paolo, Vincent...), and my two office mates Xavier and Jaâfar.
I also thank my family and friends; they know who they are.
From an aesthetic perspective, I thank various composers for providing the soundtrack in which this whole work evolved: Claudio Monteverdi, Michelangelo Falvetti, Franz Liszt, Mikis Theodorakis, David Bowie and many others.
At last, I would like to thank myself, for all the great moments we have had and will have together.
Foreword
In the Summer of 2013, I completed my engineering Master of Science degree at the École des Ingénieurs de la Ville de Paris (EIVP). Out of the three years of study, I was able to spend one year at the École Nationale des Ponts et Chaussées (ENPC) to specialize in Transport and Highway Engineering, which are among my lifetime passions.
Afterwards, as a civil servant of the City of Paris, and wanting to keep going inside the field of transportation, I took a then available engineer’s position at the Poste Central d’Exploitation Lutèce (PCE Lutèce), the inner Paris Traffic Management Center (TMC), which is in charge of its arterials and traffic lights. My job was to take care of the traffic statistics inside Paris, and investigate new means of collecting and analyzing traffic data, as the legacy loops infrastructure was becoming harder to maintain. Discussions had been engaged with several companies before my arrival. Moreover, there were great political expectations behind these technologies, as traffic statistics played a key role in the political agenda of the City of Paris, which aimed at further limiting motor traffic inside the city by closing off or reducing the capacity of major roads. I had drawn a PhD project related to my upcoming work on the “new” traffic data, which was accepted by my hierarchy and supported by my manager, Michel Le Bars.
Meanwhile, Vincent Aguiléra, who had followed my final internship for my engineering degree, was at the time researcher at the Laboratoire Ville Mobilité Transport, and had been working on these “new” datasets for a few years. He showed great interest to my PhD project.
My PhD report accounts for both the research and operational work I carried out in the last four years, between the Summer of 2013 and the Summer of 2017. My professional environment, namely the PCE Lutèce, offered a great opportunity to put into perspective the “new” traffic data with the dealings of an urban TMC and the heavy political agenda that caused major disruptions to the road network.
This is what you are about to read. I hope you will enjoy reading it as much as I had pleasure investigating, researching, and in the end writing it through the course of these past four years. Luc Charansonney August 2013–January 2018, PCE Lutèce, Paris, France.
Introduction
1
Context of the PhD memoir
In recent years, motor traffic, and both its stakeholders (the road authorities, the drivers) and the infrastructure it relies on (the road, the sensors), have undergone three major political, technological and financial changes.
The political change, perhaps the most emblematic of the three in European cities like Paris, is the reshaping of the “car and city” relationship. Political action in cities has since the 1990s veered from car-oriented views to policies favoring “sustainable” modes of transport (public transit, cycling, walking) and re-balancing space use between these different modes, thus reducing the car’s footprint on urban road networks.
The technological change spans throughout the 1990s and 2000s: it is the spreading use of GPS location services and mobile Internet connectivity. This quickly had direct consequences on traffic: vehicles themselves have become sensors, and nowadays the knowledge of traffic is transitioning from dedicated, roadside based sensor infrastructures (like traffic loops), managed by public bodies (road authorities) to vehicle-based sensing. The latter has become known as probe vehicle or floating car data, whose collection is managed by the private sector.
Finally, the financial change is the translation of a general recess of public spending in road infrastructures, after decades of massive road building following World War II. The centralized traffic management systems devised and set up in the 1970s-1990s were generally renewed in the 2000s-2010s so they could provide traffic signals preemption to develop segregated surface transit routes (Bus Rapid Transit, BRT, and Light Rail Transit, LRT, lines). Nonetheless, the “legacy” network of sensors they are based on are costly and complicated to maintain, and are now gradually being decommissioned in favor of vehicle-based sensing or of cheaper devices making use of these technologies. New roadside sensors are called for, like for V2X communication, but the question of funding the installation and maintenance of such devices remain yet to be solved.
2
The Paris region and the author’s position
The Paris region, at the center of which lies the City of Paris, is a key example of a complex world metropolis with dramatic congestion on both its mass transit and road networks. This is potentially a daily demand of millions people over a supply whose responsibility is split between different overlapping public and private bodies.
Within the City of Paris, the road authority role is played by the Direction de la Voirie et des Déplacements (DVD), literally the “Roads and journeys administration”.
Within the DVD, the PCE Lutèce, officially known as Section études et exploitation (SEE), is in charge of controlling projects and operating assets related to traffic. Traffic is understood
as all the modes that travel on the road network, even though the original traffic management system was mainly aimed at private car traffic.
Through the course of his doctoral thesis, the author worked as an engineer at the PCE Lutèce. His operational role, on which his doctoral thesis relies, was to investigate and assess the “new traffic data” provided by the rising traffic information intermediaries, and provide an operational framework for statistical use of these datasets.
The resulting 2013-2018 five years of work involved working with GPS-based Floating Car Data and Bluetooth-based travel-times, from exploring the datasets to delivering technical as-sessments of traffic conditions using these datasets. This does not deal with the political aspect of traffic policies assessment, which was out of the author’s scope both as an engineer and a PhD student.
The scope of this doctoral dissertation does not cover the economical aspects of the traffic information market. It also does not cover the political issues behind traffic-related policies. Its purpose is not to develop a “data-fusion” model that would mix several data sources to model traffic. The author places his work “upstream” of these issues.
3
Questioning
The author, in his doctoral dissertation, addresses the following issue: from the perspective of a road authority, what are the metrological and organizational changes induced by the technological shift triggered by the new methods of travel-time measurement?
The author believes his thesis contributes to a better understanding of the “new traffic data”, namely the Bluetooth travel-time and GPS based Floating Car Data datasets he has worked during the course of his work.
Based on a selection of key studies found within the traffic-related literature (mainly from the 1920s to the 1960s), he shows that the novelty of these datasets is in fact deeply linked to the questions traffic engineers and road authorities have been struggling with since the rise of motor traffic. The variables that can now be directly and cheaply measured or estimated by the new technologies have been sought for since the beginning of traffic engineering: travel-time (and its reciprocal, the “space-mean” or “flow” speed) estimation both through space and time. These variables complement the well-known legacy variables (flow, concentration, spot speed) of traffic engineering.
The second major contribution the author believes to have made is on the main properties and uses of these new datasets, from the perspective of a road authority that needs to assess traffic-related policies in the context introduced above. His work thoroughly describes the datasets at stake, and shows examples of their use through real-case operational studies (closure of a tunnel under one of Paris main traffic hubs, closure of a major crosstown expressway, lowered speed limits).
The dissertation is therefore organized as follows.
An introductory chapter, Chapter 1, Paris and its Traffic, sets the general context on traffic viewed as a supply and demand interaction, and on the role played by traffic information and data. It also presents the Paris case, the organization of the City of Paris as a traffic authority, and the author’s position in the structure.
The dissertation is then split in two: Part I, Traffic data and traffic information: linking the Traffic Management Center and the driver, and Part II, “New” traffic data: expanded ways to assess traffic.
Part I, Traffic data and traffic information: linking the Traffic Management Center and the driver, thus addresses the following issues:
1. How has traffic data answered the operational needs of the road authorities, and allowed the inception of both traffic engineering and of the Traffic Management Centers most urban road network are today headed by? Should “new” traffic data really be opposed to “legacy” traffic data?
2. What have the successive technical advances of the traffic data collection and traffic in-formation broadcasting, from the 1920s to the 2010s, meant for the Traffic Management Centers’ relationship with the drivers? How is that relationship challenged by today’s widespread use and collection of crowdsourced traffic data?
Within this Part, Chapter 2, The “new” against the “old”? The quantification of traffic, addresses the first of the above issues: How has traffic data answered the operational needs of the road authorities, and allowed the inception of both traffic engineering and of the Traffic Management Structures most urban road network are headed by? Should “new” traffic data really be opposed to “legacy” traffic data?
Chapter 3, The evolving relationship between drivers and road authorities: occasional, cen-tralized, then shared. Paris and Lyon cases, from the 1920s onward, addresses the second of the aforementioned issues: What have the successive technical advances of the traffic data collection and traffic information broadcasting, from the 1920s to the 2010s, meant for the Traffic Man-agement Centers’ relationship for the drivers? How is that relationship challenged by today’s widespread use and collection of crowdsourced traffic data?
Following Part I, Part II, “New” traffic data: expanded ways to assess traffic, addresses the following issues:
1. What data can the Traffic Management Center “catch” outside of its legacy sensors infras-tructure?
2. What are the operational traffic indicators these “new” traffic data provide? What opera-tional purposes can they serve for the Traffic Management Center?
Within this Part, Chapter 4, Place de l’Etoile: First encounter with Bluetooth beacons, followed by Chapter 5, Voie Express Rive Droite: Bluetooth beacons for a major road closure, focus on the travel-time indicator, as collected through Bluetooth travel-time technology to assess two major, disruptive traffic-impeding decisions. The first, in 2015, is the closure of an underpass under one of Paris major intersections, the Place de l’Etoile. The second, in 2016, is the closure of a major cross-city expressway. In both cases, the purpose was to assess Bluetooth travel-time usefulness in keeping track of travel-travel-times before and after disruptive measures, along with providing the City with a quantification of the disruptions.
Chapter 6, GPS speed FCD: the story of two different providers, then focuses on GPS-based FCD speed data, and the difficulties met in using the data. It shows that, even though not relying on authority’s ground equipments, this “new” dataset is not, as already shown by Bluetooth, straightforward or “plug-and-play”.
Chapter 7, GPS speed FCD: assessing speed-related policies, focuses on a major speed-related issue: assessing the lowering of speed limit in Paris, with two cases. The first case is the lowering from 80 to 70 km.h´1 of the speed limit on the ringway, and the second is the establishment
of 30 km.h´1 zones. GPS-based FCD allows the collection of instantaneous speeds of vehicles
throughout the network.
Chapter 1
Paris and its Traffic
1.1
Traffic: a supply and demand interaction
information information SUPPLY road network DEMAND driver-car Road authority Driver Intermediary
Figure 1.1 – Supply and demand view of traffic, along with the information intermediary.
Traffic can be described as the interaction of three elements: the driver, the vehicle, and the infrastructure (the road). From a supply and demand perspective, the driver-vehicle pair can be considered the demand and the infrastructure the supply. In other words, road users make up the demand, and the road, the supply. Traffic then results from the interacting supply and demand.
The traffic situation can either be on the side of the supply or of the demand. The supply is physically finite, as it cannot allow through more demand than it was designed for: it has a capacity. When the demand remains below the supply’s capacity, the traffic situation remains satisfying: the supply accepts the whole demand. This state is called free-flowing state. When the demand exceeds the supply’s capacity, the supply only delivers an unsatisfying, rapidly worsening answer: the more the demand exceeds the capacity, the less the supply can deliver. This state is the congested state.
1.1.1
The supply
The supply is the road, defined by Article 1 of the 1968 Vienna Convention as “the entire surface of any way or street open to public traffic” ([1]). A road can then be broken down into “carriageways” and “lanes”. A “carriageway” designates the “part of a road normally used by vehicular traffic”. A “lane” then is “any one of the longitudinal strips into which the carriageway is divisible [...], which is divisible for one moving line of motor vehicles other than motor cycles”. An intersection is where two or more roads meet. The set of roads makes up the road network. The supply is not homogeneous: there are different types of roads, from local streets to main arterials to expressways and motorways. These types introduce a hierarchy in the network. The fundamental distinction lies between all-purpose roads and motorways. The motorway is explicitly defined in the aforementionned Article 1 of the Vienna Convention, as a “road specially designed and built for motor traffic, which does not serve properties bordering on it”: its accesses are controlled by the means of grade-separated interchanges. The type of a road is generally related to the quantity of demand it can cater for (its capacity) and the maximum speed it allows the demand to travel at under free-flowing conditions.
There is one main stakeholder behind the supply: the road or highway authority. The road authority is the body in charge of the road network. Its role can be generically defined into three overlapping missions. In French it is known as the “gestionnaire de voirie”, litterally the “road manager”.
Its first mission, the most crucial, is ensuring the safety of the various users of its roads. Safety is a wide topic that goes beyond the scope of this work. It involves the safety of the road, safety between the users and the road, safety between the users themselves, either within the same category (a car and a car) or between two categories, one usually being considered more vulnerable than the other (the car driver is generally on top of the list as the least vulnerable, the pedestrian being the more vulnerable).
Its second mission is handling the demand. This is a daily, 24-hour, seven-day-a-week task. It involves delivering the best supply to the demand. “Best” covers a variety of meanings. It is seeking the adequacy between the road type and the demand: local traffic vs. through traffic. It is maintaining the infrastructure to provide users with the safest infrastructure with the maximum capacity most of the time. It is controlling the demand, enforcing the policies voted by the political authorities: road-capacity allocation favoring specific categories (mass transit, bicycles, car-sharing, etc.), routing the demand on main roads, sparing neighborhoods’ streets from through traffic. Within these lines, the road authority aims at maximising the use of the available supply while minimizing the overall time spent by the demand on the network. This mission is often designated as “traffic management”.
Its third mission is on a longer term than the two others: it involves planning, designing and implementing the layouts that serve the policies to be enforced. This spans from building a new road, to reallocating road-space, to closing a road.
Of course, the road network is attached to the territory it serves. Extra-urban issues are by far different from urban ones. Here the author focuses on the urban situation.
1.1.2
The demand
The driver-vehicle unit stands behind the demand.
A vehicle can be of various types: Article 1 of the 1968 Vienna Convention defines several types, reflecting the diversity of uses on the road: “cycle”, “moped”, “motor cycle”, “power-driven
vehicle”, “motor vehicle”, “trailer”. The driver is himself defined as “any person who drives a motor vehicle or other vehicle”. The driver-vehicle unit such designates very varied situations.
Each individual driver travels from an origin, which he leaves at departure time, to a destina-tion, which he reaches at an arrival time which may differ from his original expected arrival time. His travel, or journey, links an origin-destination pair over a route, traveled in a travel-time. The route is the series of roads he used (the supply), and the travel-time is the time difference between his departure and arrival times. Of course, origins and destinations may be shared by a great number of drivers: that’s especially the case when residential and work areas are concentrated at specific locations. This is also true for the supply: individual routes linking shared origins and/or destinations also share common sections of road. The aggregation of individual routes on the same infrastructure makes up the traffic flow.
Thus, there are two scales at which to consider the demand: the individual driver, or the collective flow, an aggregate of individual trips.
1.1.3
Information, in between supply and demand
Supply and demand as described above are in deep interaction. Theoretically, information has to be exchanged two ways and continuously between supply and demand. Technological progress have played a key role since the beginnings of motor traffic in building and transmitting the information between the two sides.
1.1.3.1 Information, from demand to supply
The information from demand to supply has historically been the major movement. In fact, the road authority’s three main missions require it to gather a quantitative and qualitative knowledge of traffic, both in the short term (real-time) and in the long term (historical data, statistics). The authority wants to ensure the demand’s safety at all times, thus to know the state of its supply (available capacity, incidents) and to act on the demand accordingly.
This brings about two possible scales of study for the demand and of the traffic it generates. The individual perspective gives the authority a thorough knowledge of origin-destinations. The downside is that historically, gathering such data was impeded by available technologies, and requires considerable manpower. Such studies therefore were rather exhaustive but on a limited perimeter, or with a small fraction of drivers but over a larger perimeter.
The collective perspective, in terms of volume and local speed, is derived from the observation at fixed roadside spots of the flow of traffic. This allows an easy automation of data collection, requiring less manpower than individual observation enquiries
The knowledge of the road authority of the demand over its network results from a trade-off between these two scales of observation. Indicators, mainly volumes (traffic counts at given points, then projected over a road section), road section travel-times (travel-time over a section of road), flow routes (significant aggregation of individual routes) ended up characterizing the demand for the road authority. Through time, these indicators rely both on the data collected during the manned or automated sensor-based observation of traffic, and on theory (reasonable assumptions, models) that generally attempts to bridge the gap between the wanted indicators and the available observation techniques and the variables yielded by the observations. This is typically the case for travel-time, which could hardly be measured in real-time over a whole network, and ended up being estimated from direct measurements on small samples, combined with models based on spot automated measurements of traffic.
1.1.3.2 Information, from supply to demand
The information delivered by the supply to the demand is funded on two aspects: the au-thority’s missions and the idea the authority holds of the supply, derived from the information it retrieves from it.
Information from the supply to the demand is both static and dynamic. The traffic signs communicate to the driver the regulations and routes enforced by the road authority. The radio is the historical medium allowing the transmission of dynamic information from the supply to the demand. It allows to act on the demand by informing it of the whereabouts of the supply (mainly, congestion issues, either caused by demand overwhelming the nominal capacity of the infrastructure, or by an incident reducing the nominal capacity). Variable Message Signs are a second tool to inform the demand, and are directly managed by the road authority. In both cases, these mediums inform the driver “in general”, as part of a flow. The most-individualized it gets is by informing the drivers traveling on the same route and to or through the same destination, like a district or an interchange.
Gradually, drivers have come to expect both reliable and invidualized information from the authority. The major technological shift happened during 1990s: onboard devices gradually meant that individualized demand-based information collection was now possible (now known as crowdsourcing), subsequently improving the preexisting supply-driven information collection (mainly done through roadside observation). This shift means that the mass collection of indi-vidualized demand data now becomes possible. The second consequence is that the authority looses its monopoly on the demand-supply link: a third actor, the private sector, comes into play and can therefore follow its own strategy.
1.1.3.3 Traffic data, traffic information
Information is at the node between supply and demand: it is through it that they get to know each other.
Information must not be confused with data. Information relies on data. As both are about the supply-demand interaction, i.e. the traffic, they are usually referred to as respectively traffic information and traffic data.
Traffic data qualifies or quantifies traffic on a road. The qualification of traffic essentially refers to its state (congested, free-flowing) and events that may affect it (accidents, construction works, etc.). The quantification refers to the variables associated with the traffic: count, flow, speed, occupancy, etc.
In 2017, traffic data comes from a variety of sources, from road sensors to the vehicles or drivers themselves, and is the result of complex decision-making processes, driven by the many parties involved.
Traffic data has been important from the start of motor traffic issues in the early XXth century. It grew in importance with the rise of massive traffic data collection systems in the 1950s-1990s period, along with the creation of a traffic-dedicated structure sitting under the traffic authority: the Traffic Management Center (TMC) [2, 3], also called Traffic Control Center, Traffic Control Unit, etc. Centralizing information coming from the network, the TMC holds a comprehensive view of it and aims at controling it, hence its name. Traffic operators can follow traffic management operations in response to traffic demand and available infrastructure supply, the supply being altered by various phenomena, like the weather, roadworks or incidents.
Traffic information is an end-product of traffic data, and is itself a data aimed at either the supply or the demand. It informs it on traffic and road conditions. It makes traffic data
intelligible to the receiving party, helping him in fulfilling his task (like, for a road user, completing his journey). The expectations of the receiving parties have evolved through time, thanks to the technological, political, environmental, economic factors.
Both the supply and demand exchange information, referred to as traffic information, that relies on data, referred to as traffic data. Each side has expectations, and each side holds an opinion of what the other side should expect and do: the road authority wants to get the broadest understanding of the demand so that it can control it, minimize the overall delay and provide it with the best supply possible both in the short and longer term. It seeks what could be called an “collective or network optimum”. The user wants an individualized, reliable information for his journey, minimize his delay, and get on time to his destination. He seeks what could be called an “individual optimum”.
The data and information that feeds the exchanges between the two aforementioned stake-holders is not necessarily entirely managed by them. There are intermediaries in between. These intermediaries have historically been occupying the supply to demand information channel, and been highly dependent on the road authority for data. This dependence was caused by both the great centralization of traffic control, supported by important public funding levels, and the associated technical limitations that made roadside based observations the most affordable and easiest way of obtaining network-scale data on traffic. An example of such intermediaries would be the private radio stations, who counted on thorough traffic information flashes to grow their audience. Starting in the late 1980s, the floating sensors revolution occurred, at first through navigation-dedicated onboard units, later supplemented by devices that not only stick to the ve-hicle, but also to the user, the smartphone being the flagship of this latter type of devices. This means network-wide, cheap traffic data and information, emanating from the vehicle, with most costs covered by the users. The providers of such equipments and associated services became new stakeholders, drawing data not only from the supply, but also from the demand. That knowledge then allows to know the demand and be able to somehow control it, without necessarily being associated with the road authorities. These intermediaries thus become a third category of traffic stakeholders: the commercial stakeholders, whose business is to collect and sell demand data and route the demand.
Questions naturally arise from these general thoughts: how are is the relationship between demand and supply, between the road authority and the road users, reshaped? How do the new intermediaries interact, or interfere, with the demand and the supply? How can a road authority enforce a policy decided by an elected government, while at the same time part of the control of the demand gets out of reach? Do the road users have anything to gain from the rising complexity associated with having more stakeholders? Who assumes the cost of running the services? Who regulates them?
From these stakeholders’ issues arise a mirrored questioning at the traffic data level. It resides within the mandatory distinction between two aspects of the traffic data, the first being the measurement of the physical phenomenon of traffic, the second the interpretation made of it by the various stakeholders, namely the driver, the traffic authority, the political arena, the commercial stakeholders.
The first aspect is the traffic data as the measurement of the physical phenomenon of traffic. The image it gives of traffic is related to the sensor itself (Eulerian or Lagrangian) and to the supply-and-demand interaction within its range of observation. This can be called the “traffic ground truth”.
In order to fulfill its missions, the road authority carries out a technical interpretation of the physical measurement. This level of interpretation is the closest to the empirical ground truth,
and is often associated with direct observation and field knowledge. This both validates the data collected, but also changes it into reliable information: along with the traffic variables, events are drawn. The road’s authority interpretation is thus very closely related to the traffic ground truth.
The other stakeholders, the driver, the commercial and the political, hold a more self-driven interpretation.
The driver holds its own interpretation of traffic. It can be considered a mix of his experience, from the origin-destination pair he travels the most (around his home or his workplace), to the locations he seldom visits. His vision is also influenced by the information he receives from other stakeholders.
The political interpretation of traffic data fuels the political decision making process that will feed policies the road authority will in turn have to enforce. The political decision will nonetheless very often override the traffic ground truth, and data will be interpreted as to serve the decision.
The commercial interpretation is an in-between between the driver, the road authority, the politicians. A key issue for commercial solutions is to be essential to drivers. The driver is a customer. This is based on several factors. The first factor is to communicate on a worsening trend of traffic conditions, while presenting the commercial solution as the way to diminish the consequences on the customer’s journey. The second factor is to present the provided information as reliable and time saving.
Traffic results from the interaction between a supply and a demand. Several stakeholders stand behind this interaction. The two major ones are the road authority, standing behind the supply, and the driver, standing behind the demand. In-between, information travels, based on data. This allows each stakeholder to carry out its missions: for the road authority, providing a safe and appropriate supply, for the driver, completing his journey while suffering the minimum delay. The way data, and thus information, is collected is deeply linked with the technolog-ical means allowing it. Therefore, the technologtechnolog-ical evolutions of the past decades, switching the collection devices from the infrastructure to the vehicles, has allowed a third category of stakeholders to emerge, focused on information.
It is necessary to separate the absolute ground truth of traffic, i.e. the traffic data itself and the interpretation carried out by the road authority, from the interpretations derived by the other stakeholders, which are more self-interest driven.
1.2
The Paris region case
This is the global picture in which the Greater Paris area case evolves. It is a key example of a complex world metropolis with dramatic congestion on both its mass transit and road networks. This is potentially a daily demand of millions people over a supply whose responsibility is split between different overlapping public and private bodies.
1.2.1
The administrative status of the City of Paris and its region
The City of Paris is at the core of a region, Île-de-France, also known as Paris region, which houses over 12 million people and 5.6 million jobs spread over 12 000 km2 [5]1. The region is split into eight Départements. Paris is at the center, surrounded by two concentric rings of
1The statistical figures for surface, population and jobs all come from the INSEE (Institut national de la
0 10 20 km Privately Managed Motorway
DIRIF (French State Agency) City of Paris (ringway) City of Paris (inner Paris arterials) D-roads
Local roads (municipalities, airports, ...) Départements boundaries
Road Authorities Around Paris (2017)
Figure 1.2 – Road authorities around Paris (2017) ([4] with author’s post-processing).
0 10 20 km
Motorways Expressways
Divided roadways (not expressways) Standard roadways Départements boundaries
Road Types Around Paris (2017)
Figure 1.3 – Road types around Paris (2017). The distinction is made between motorways, expressways, standard divided roadways (roads or streets which are not entirely grade-separated and have local accesses), standard roadways (roads or streets that do not fall in the three previous categories) ([4] with author’s post-processing).
Départements, an inner ring of Départements neighboring Paris (known as the Petite Couronne, literally “small ring”) and an outer ringer (known as the Grande Couronne, “great ring”). Each Département is itself organized into municipalities. The City of Paris and the municipalities of the Petite Couronne are also part, since 2016, of Grand Paris, Greater Paris, although this administrative structure has no authority on transport as of 2017. The City and the Petite Couronne concentrate over half the region’s population (more than 6.7 million) and jobs (more than 3.8 million) over 760 km2. The City itself is an even smaller territory, at 105 km2 with a
population of more than 2.2 million and 1.8 million jobs. These figures easily show the pressure this puts on transportation networks.
Being the capital of France, and owing to its troubled history in the XIXth century, the City of Paris status is peculiar among French municipalities. The history of Paris government can be found in [6]. Up until 2017, Paris used to be both a municipality and a Département, and its elected body, the Conseil de Paris (Council of Paris), acted as the council for both structures. In 2017, the two entities were merged and the City of Paris became a municipality.
The French State always deeply interfered with the City of Paris administration. The Préfet, named by the national government, and whose role is basically to represent the State in each Département and enforce the Law, was from 1800 to 1977 the unelected head of the City’s administration. After only two small time lapses in the XIXth century, Paris could finally elect its mayor in 1977.
Unlike other French cities, the Police forces in Paris depend from the Préfet de Police (distinct from the Préfet), i.e. the French State, since 1800. Nonetheless, in the past few years, some fields have been transferred to conventional municipal police. After the first elected mayor took office in 1977, the Préfet de Police retained major responsibilities, most notably, as far as traffic is concerned, the Police forces. In the 2010s, major reforms have watered down the Préfet’s role and handed more responsibilities over to the Council of Paris and the Mayor. Nonetheless, many matters remain shared by both the Préfet and the Mayor.
These complex layers of administrative bodies directly translate into a great diversity in road authorities. The massive post-war road building program was mostly directed by the State. This program spanned from the 1950s to 1990s. Then, the devolution process (known as décentralisation in French), increased the local authorities powers and resulted in a greater road authorities fragmentation.
1.2.2
The development of the road network infrastructure (1930s-1970s)
The growth of the region, and of its urban core centered on Paris, throughout the XXth century, was at first accompanied by an extensive streetcar network, which was supplemented, from the 1930s onward (with a hiatus from 1939 to the early 1950s), by private motoring. Rail continued to play role, but concentrated on the mainline radials and on the subway. The growth of motor traffic yielded car-dedicated infrastructure projects in the 1930s, with construction and extensive planning really picking up in the 1950s. The plan was to provide the region with radial motorways branching off an inner ringway circling Paris, and connecting successive concentric outer ringways. Motorway spurs were to cross the City of Paris and various already densely urbanized areas. By the oil crisis of 1973, most radial motorways were completed, along with the innermost ringway (Paris ringway, namely the Boulevard Périphérique) and significant sections of the two outer ones, although with altered plans.
After 1973, the radial motorways that had not been built were axed, as well as most urban spurs that were suffering intensifying opposition. The infrastructure policy then focused on
completing the two outer ringways (the second ringway, A-86, and the third ringway, A-104) and treating bottlenecks (bypasses, interchanges, widening), a work which has been going on until nowadays. While the motorway and expressway network was being built, major arterials underwent heavy upgrades, mainly through their widening and the grade-separation of major intersections.
1.2.3
The administrative landscape in charge of the road network
The general rule is that municipalities are the road authority for the local streets (C-roads or unnumbered roads). The arterial network, designating major roads with at-grade intersections and direct local access is shared between the Départements (D-roads) and the State (N-roads). These roads used to be jointly managed by the State, namely by the Direction départemental de l’équipement, Département-based agencies created in 1967 which were widely known as DDE. The devolution process meant the end of these agencies, the N-roads being managed by the State, and the D-roads by the Départements, under independent structures.
The expressway network (voie express), i.e. grade-separated roads with no direct access, is also shared between these two administrations (N- and D-roads).
The motorway network (autoroute) is shared between the State Department of Transportation (A-roads) and private companies for privately-operated motorways.
Successive decentralization movements have transferred most of the arterial network from the State to the Département. The two biggest nationwide waves of downgrading N-roads to D-roads occurred in 1973 and in 2006. Paris region was much more impacted by the 2006 move, when most N-road arterials became D-roads.
The City of Paris does not follow the traditional A-N-D-C-roads schema. Instead, the City of Paris is the road authority for all roads over its territory. Additionally, the Préfecture de Police oversees part of the arterial network and the ringway2. Therefore, on this subnetwork, the road authority is shared between the City of Paris (maintenance, planning, management) and the Préfecture (planning, management). Nonetheless, unlike other French municipalities, driving laws enforcement is still a Préfecture’s competence over the whole network.
There are therefore six major road authorities for the core Greater Paris area (“Petite Couronne”, roughly inside the A-86 orbital motorway):
• the State Department of Transportation, for the A and N-roads; • the City of Paris, for its network, including the ringway;
• the Conseil Départemental des Hauts-de-Seine, for the Hauts-de-Seine Département; • the Conseil Départemental de Seine-Saint-Denis, for the Seine-Saint-Denis Département
D-roads;
• the Conseil Départemental du Val-de-Marne, for the Val-de-Marne Département D-roads; • Cofiroute, for the tolled West segment of the A86-motorway ring, built and operated under
private management.
1.2.4
The inception and current state of traffic management in Paris
region
In line with the previous description of traffic as the result of interaction supply and de-mand, and with the administrative background of Paris region in mind, this section describes the inception of centralized traffic management for the various road authorities.
2The arterials managed by the Préfecture mainly include, since the 2017 reform, those that serve key State
Major arterials and expressways3 alike, by the traffic volume they support, have concen-trated many of the issues faced by road authorities. The authorities gradually felt the need for centralizing information collection across their networks, as the technology allowed it.
In 1971, the French State issued an instruction that made traffic plans mandatory for cities and urban areas of over 20,000 people [7]. During the 1972-1983 period, the Paris region’s main arterials and expressway network became known as the Réseau Régional Contrôlé (RRC), the Controlled Regional Network, with several aims: improving the flow of traffic, improving surface transit performances, regulating parking, and protecting two-wheelers and pedestrians.
This plan funded ground assets for Paris, the Petite Couronne and the Grande Couronne: new road layouts, but also traffic equipment such as traffic lights coordination. The network did not extend into Paris however, only including the ringway and the outermost circular boulevards, known as the Maréchaux.
In this context, the inception of traffic management centers also stemmed from the need to put workforces needed in dedicated locations to increase their efficiency, but also from the technological availability of assets that would allow a centralized supervision from a control room, reproducing power industry practices.
Therefore, the centralized systems came to rely on dedicated telecommunication networks linking the central computer housed in the TMC with ground assets that allow automatic or manned supervision of traffic.
1.2.4.1 Paris Region State expressways
Outside the City of Paris, the State is the road authority for the motorway and expressway network (motorway radials, the A-86 second ringway and the A-104/N-104 third ringway)4. The corresponding State body is the Direction des Routes d’Île-de-France (DIRIF), Roads Depart-ment of Île-de-France.
In the late 1980s, the State developed a dedicated traffic management infrastructure to man-age this network, supervised by its TMC and its underlying system named SIRIUS, Système d’information pour un réseau intelligible aux usagers, “Information system for an intelligible net-work to its users”. SIRIUS went live in 1993 as a system dedicated to the TMC operators to help them with their traffic management tasks over the network, by providing them a centralized, dynamic overview of the network. It had three fundamental functions, oriented toward the needs of the TMC:
• Give at all time the traffic conditions over the network;
• Inform users reliably, precisely and at all time on their journey conditions; • Alert users in case of a dangerous event (congestion, accident, roadworks)
It mainly relied on fixed road traffic sensors, mostly loops, which gradually equipped most of the State expressway network. The general rule was to implement one sensor per lane every 500 m. Complementary video cameras were installed at strategic locations.
The system also allowed the TMC to communicate with the road users through Variable Message signs, through which events could be signaled to them. A new generation of the system, SIRIUS2, was implemented in 2001-2005, to include automatic incident detection (especially for the tunnel, which hold specific safety regulations) and travel-time computation. User-oriented functions were added to its original operator functions inherited from the original system:
3For conciseness and clarity, expressway will be used to generically designate all expressway-like roads, including
motorways (autoroutes), except when the distinction between these two classes of road is relevant to be drawn.
4Some sections of expressways are D-roads, but they mostly act as spurs to the State network or are isolated
• Users’ safety: detecting and signaling incidents and congestion, signaling roadworks; • Traffic management: ramp metering, users’ recommendations (detours, etc.); • Users’ information: travel-times, projected traffic information, regulations in place. Communication to the user heavily relies on VMS, along with FM radio flashes. 1.2.4.2 Paris region arterials
Paris region arterials are mostly radial roads stemming from Paris ringway interchanges and a direct continuation of the City of Paris arterials. Their geometry generally includes two to three traffic lanes per way, with at-grade signalized junctions, some fitted with through-traffic overpasses or underpasses. Since the 1990s, surface transit projects, such as light rail or bus lanes, have reduced the general traffic lanes and even involved the removal of many of the grade-separating structures.
Most of these arterials used to be N-roads, and were gradually downgraded (especially in 2006) to D-roads, their authority in charge switching from the State to the Département.
In the line of the 1971-1972 traffic plan schemes, all Départements gradually had at least a few people dedicated to traffic management.
The “lowest level” of traffic management was the synchronization of traffic lights along main arterials, with a ground calculator in charge of traffic lights synchronization, and no associated TMC.
In the Petite Couronne, TMCs were set up by the Val-de-Marne and Seine-Saint-Denis by 1984-1985, following the RRC’s goals, to supervise and centralize traffic lights management. The Hauts-de-Seine followed a few years later. These three TMCs, under the authority of their respective Départements, are today in charge of D-roads arterials whose junctions are wired to the corresponding road authority’s TMC, with various degrees of spatial coverage in each Département. They also manage traffic light preemption for surface transit.
1.2.4.3 The City of Paris network
The first centralized traffic control units were developed in the City of Paris in the late 1940s and were dedicated to traffic lights synchronization. Several of these units were implemented throughout the 1950s and 1960s, each linked to a pool of signals. The completion of the ringway in 1973 led the Préfecture to consider the City’s road network as two categories.
On one side, the ringway, with its motorway-like characteristics, needed specific procedures for its maintenance and management, and a centralized system to oversee the entire road: the Poste Central d’Exploitation Berlier (PCE Berlier, or Berlier TMC) was born. The underlying system went live in the 1980s. The system’s algorithms rely on fixed road traffic sensors measuring traffic flow variables (flow, occupancy, speed). Additionally, video cameras have been in place since the 1970s for traffic monitoring. The upgrade of the system in the 1997-2002 era became known as IPER-REPER.
On the other side, the signalized arterial network needed a city-wide coordination plan to improve its efficiency: the inner Paris TMC was launched in 1979 to coordinate the central zone, replacing a former system. Today’s Poste Central d’Exploitation Lutèce (PCE Lutèce, or Lutèce TMC)was opened in 1989, and additional pools of junctions were gradually wired through the 1980s-2000s, covering most of Paris arterials by 2005. The underlying system is known as SURF, Système urbain de régulation des feux, “Urban system for signals management”. The system was aimed at:
• improving the surface public transport performance; • ease the movement of emergency vehicles;
• improve ground assets (traffic lights, controllers, etc.) availability thanks to the centraliza-tion of alarms raised by faulty equipment.
The system’s algorithms rely on fixed road traffic sensors measuring traffic flow variables (flow and occupancy), although additional sensors, not needed by the algorithms, were installed to provide complete traffic state coverage for the TMC supervision. Video cameras were also installed, for a part owned by the Préfecture and for another part owned by the City.
The historical overview of the postwar development of the Greater Paris road network did not only involve road building. The clearly “new supply”-oriented State-funded policy, came along the creation of a technical infrastructure serving the road authorities missions. The goal was to gather in real-time and in a centralized location comprehensive information on the demand over the major routes. This information included the state of assets for users safety (traffic lights, tunnel equipments), the state of traffic (traffic loops). The information on the demand remained closely related to the infrastructure and the authority in charge of it.
This centralized view of the information flows between supply and demand gradually evolved into a model split between several administrative bodies because of several related factors.
One of them is the rising awareness of motor traffic externalities, which has increasingly led to supply-decrease policies for motor traffic, in favor of rebalancing supply to the other road users (surface transit, cycles, pedestrians to name a few).
Another is the devolution process, redefining the role played by the centralized national State and reinforcing local government bodies. Roads do not escape this political shift: the main road network, formerly under the State’s jurisdiction which funded most of its development, is since 2006 split between the five aforementioned public road authorities. This means the information infrastructure is also now split between these stakeholders into independent systems.
An additional factor is the sharp reduction of public funding, meaning that road authorities concentrate on their most essential mission: the safety of the users. This means focusing on road maintenance and safety-related assets (traffic lights, tunnels safety). The pressure is even greater since most of the main network’s structures were built in the 1960s-1970s and need intensive maintenance.
Finally, the information channel is shifting away from the infrastructure into the vehicles. This does not mean no information will be generated through the infrastructure and its related stakeholders (the road authorities), but the traffic state is better derived if the vehicles themselves produce data relative to their motion, and not only fixed infrastructure based observational spots (the traffic sensors). The floating car data (FCD), which designates information produced by the vehicles, is therefore establishing a relationship between drivers and intermediaries that are independent from the road authority.
1.3
The author’s missions and stance
The author’s work falls in the context mentioned in the two previous sections: the questioning surrounding the new traffic information three-parties structure and the relationship of the road authority with both the demand and the information intermediaries.
Within the City of Paris, the road authority role is played by the Direction de la Voirie et des Déplacements (DVD), literally the “Roads and journeys administration”. In 2016, the City of Paris had an operating budget ofe7.8 billion and an investment budget of e1.9 billion euros.
![Figure 2.1 – Traffic variables at stake in Dean A.N. Johnson ’s traffic study [17], drawn upon an x ´ t diagram.](https://thumb-eu.123doks.com/thumbv2/123doknet/14503777.719738/47.892.182.774.119.788/figure-traffic-variables-stake-dean-johnson-traffic-diagram.webp)
![Figure 2.2 – Traffic variables at stake in Adams’s traffic study [21], drawn upon an x ´ t diagram.](https://thumb-eu.123doks.com/thumbv2/123doknet/14503777.719738/48.892.124.723.112.707/figure-traffic-variables-stake-adams-traffic-study-diagram.webp)
![Figure 2.3 – Traffic variables at stake in Greenshields ’s photographic method [24], drawn upon an x ´t diagram.](https://thumb-eu.123doks.com/thumbv2/123doknet/14503777.719738/51.892.174.780.472.737/figure-traffic-variables-stake-greenshields-photographic-method-diagram.webp)