HAL Id: hal-02375096
https://hal.archives-ouvertes.fr/hal-02375096
Submitted on 21 Nov 2019HAL is a multi-disciplinary open access archive for the deposit and dissemination of sci-entific research documents, whether they are pub-lished or not. The documents may come from teaching and research institutions in France or abroad, or from public or private research centers.
L’archive ouverte pluridisciplinaire HAL, est destinée au dépôt et à la diffusion de documents scientifiques de niveau recherche, publiés ou non, émanant des établissements d’enseignement et de recherche français ou étrangers, des laboratoires publics ou privés.
sea surface microlayer, influencing waves, ripples, foam
and air-sea fluxes
Ian Jenkinson, Laurent Seuront, Haibing Ding, Florence Elias
To cite this version:
Ian Jenkinson, Laurent Seuront, Haibing Ding, Florence Elias. Biological modification of mechanical properties of the sea surface microlayer, influencing waves, ripples, foam and air-sea fluxes. Elementa: Science of the Anthropocene, University of California Press, 2018, 6 (1), pp.26. �10.1525/elementa.283�. �hal-02375096�
1. Introduction
For over a century, CO2 levels in the atmosphere have been increasing at an accelerating rate. This increase is fuelled by anthropogenic CO2 release, currently at over 9 billion tonnes annually (Le Quéré, 2015). As a greenhouse gas, CO2 is leading to higher mean temperature on Earth (Friedlingstein et al., 2014) and in the world ocean, as well as increasing sea levels by thermal expansion and melting of ice caps (IPCC, 2014).
The Ocean absorbs about 25% of the anthropically pro-duced excess CO2 (Le Quéré et al., 2015). As a result, the
average surface ocean pH has decreased 0.1 units since the Industrial Revolution, i.e., a 30% increase in acidity (IPCC, 2014), and is predicted to fall another 0.3 to 0.4 units by 2100 if CO2 emissions continue in a business-as-usual scenario (Orr et al., 2005).
In order to predict, manage and adapt to future changes in CO2 dynamics, models of air-sea flux of CO2 are being refined. This flux of CO2 passes through the barrier of the sea surface microlayer (SML), here considered to be the top 50(±10) µm (Zhang et al., 1998). As the SML itself varies strongly in time and space in complex, non-linear ways, modelling the effects of the SML on CO2 flux as a function of pertinent future scenarios is also important.
The importance of the SML in biologically modulating fluxes, particularly of CO2, is increasingly appreciated, and has recently been reviewed by Wurl et al. (2016, 2017) and by Engel et al. (2017b). Therefore, the aim of this paper is to review known and suspected mechanical aspects of how biologically produced organic matter (OM) modu-lates air-sea fluxes of CO2. We particularly address thalas-sorheological observations of biologically increased 3D viscosity and elasticity, 2D compression-dilation rheology, 2D shear rheology and foam dynamics.
REVIEW
Biological modification of mechanical properties of the
sea surface microlayer, influencing waves, ripples, foam
and air-sea fluxes
Ian R. Jenkinson
*,†, Laurent Seuront
‡, Haibing Ding
§and Florence Elias
‖,¶Gas exchange reduction (GER) at the air-sea interface is positively related to the concentration of organic matter (OM) in the top centimetre of the ocean, as well as to phytoplankton abundance and primary production. The mechanisms relating OM to GER remain unclear, but may involve mechanical (rheological) damping of turbulence in the water immediately below the surface microlayer, damping of ripples and blocking of molecular diffusion by layers of OM, as well as electrical effects. To help guide future research in GER, particularly of CO2, we review published rheological properties of ocean water and cultures of phytoplankton and bacteria in both 3D and 2D deformation geometries, in water from both the surface layer and underlying water. Production of foam modulates air-sea exchange of many properties and substances, perhaps including climate-changing gases such as CO2. We thus also review biological modulation of production and decay of whitecaps and other sea foam. In the ocean literature on biological production of OM, particularly that which associates with the sea surface, the terms “surfactant” and “surface-active” have been given a variety of meanings that are sometimes vague, and may confuse. We therefore propose a more restricted definition of these terms in line with usage in surface science and organic chemistry. Finally, possible changes in OM-modulated GER are presented in relation to predicted global environmental changes.
Keywords: Sea-surface microlayer; rheology; gas exchange reduction; phytoplankton; foam; organic matter
* Institute of Oceanology Chinese Academy of Sciences, Qingdao, People’s Republic, CN
† Agence de Conseil et de Recherche Océanographiques, La
Roche Canillac, FR
‡ Centre National de la Recherche Scientifique, UMR 8187,
Laboratoire d’Océanologie et de Géoscience, Wimereux, FR
§ Key Laboratory of Marine Chemistry Theory and Technology,
Ministry of Education, Ocean University of China, Qingdao, People’s Republic, CN
‖ Laboratoire Matière et Systèmes Complexes (MSC) – Université
Paris Diderot, CNRS UMR 7057, Paris, FR
¶ Sorbonne Universités, UPMC Université 6, UFR 925, Paris, FR
We review interactions among the biomodification of SML mechanical properties (2D and 3D rheology), waves, ripples, foam including whitecaps, and air-sea fluxes of gases and other materials and properties. After first clarify-ing the sometimes conflictclarify-ing meanclarify-ings of the key terms “surfactant” and “surface-active” (see Table 1 for a glossary
of other terms used in this review), we treat OM in the oceans, particularly in association with the SML. We follow with a section on the physics of the surface ocean, par-ticular to the SML at the micrometre to nanometre scales, including mechanical (2D and 3D rheological) aspects. After relating bubbles and foam, including whitecaps, to OM and biological activity, we address poorly understood subjects, notably the effects of rough weather, and the problem of interactions among factors. To be forewarned is to be forearmed, so we look to the effects of future sce-narios, treating warming, acidification, eutrophication, including harmful algal blooms and taxon change, and decreased deposition of black carbon, ending with gen-eral conclusions.
1.1. The meanings of “surfactant” and “surface active”
This section aims to clarify the meaning of “surfactant” as used in past literature on the ocean surface, and to help avoid misunderstandings in the context of future publica-tions and research proposals in ocean science. The term “surfactant” has been used in the oceanographic litera-ture with a variety of meanings that are sometimes vague. We suggest, as a more precise use of the terminology in future, that the noun “surfactant” and the adjective “sur-face-active” be restricted to the meanings used in chemis-try. In chemical terminology, molecules of surfactant are amphiphilic. We suggest the definition, “A surfactant is a substance of which each molecule bears one or more functionally hydrophilic (polar) groups and one or more functionally hydrophobic (non-polar) groups. A further defining property of surfactants is that when they asso-ciate with a surface they reduce the surface tension, but other types of molecules can also have this effect.”
2. Organic matter (OM)
2.1. OM in the oceans
OM is frequently divided into particulate OM (POM) and dissolved OM (DOM), with a cut-off size at 0.45 µm (Nebbioso and Piccolo, 2013). Sometimes, however, an intermediate class of colloidal OM (COM) is recognized, in which case DOM may be defined as passing through a 0.2-µm filter, while POM is classified as OM retained by a 0.8-µm filter (Alderkamp et al., 2007). The total amount of OM in the oceans is estimated at 662 Pg C (Hansell et al., 2009), or about 1.2 thousand billion tonnes of OM, but this represents only about 34 to 80 µmol kg–1. A large pro-portion of this organic matter is polymeric, with complex molecules bearing lipid, amino-acid, carbohydrate and other functional groups (Van Vleet and Williams, 1983). In the ocean, DOM is partitioned into three relatively dis-tinct pools: one refractory, with half-lives considered to be around 15,000 years; and one semi-labile (tens to hundreds of years), much of which remains in the surface mixed lay-ers, particularly in the tropics, for several months or “a few
years”. The third pool consists of less than 1% of the total OM in the ocean, but it is very labile and so represents a large C flux (Hansell et al., 2009). We suggest that this fraction, generally close in space and time to areas of high productivity, is also the most rheologically active, both in the SML (Pogorzelski et al., 2005) and in the bulk phase (Jenkinson and Sun, 2010; Jenkinson et al., 2015).
2.2. OM and sea surface microlayer (SML) models
2.2.1. Oils calming troubled waters
Spreading oil on the sea surface to calm ripples has been recorded since ancient Roman times (Hühnerfuss, 2006). Franklin et al. (1774) described authenticated anecdotal reports, some written by Pliny the Elder, as well as Franklin’s own experiments on ponds, showing that small quantities of oil (sometimes olive oil) smooth ripples quickly and larger waves more slowly. In both the sea and in ponds small quan-tities of oil can smooth ripples quickly, but larger waves are damped more slowly (Alpers and Hühnerfuss, 1989).
2.2.2. The monolayer model
Some oils, including lipids and hydrocarbons, are buoy-ant, and all are hydrophobic. When hydrophobic liquids contact a water-gas interface, the water repels them; if their yield stress is lower than the external and internal stresses tending to deform them (i.e., they are function-ally solid) and they are not confined laterfunction-ally, they keep spreading on the plane of the water-gas interface until they form a monolayer. This spreading, however, can be reduced if the surface is already occupied by other mol-ecules or if sufficiently strong stress, such as that due to wind, opposes it. Lucassen-Reynders and Reynders (1970) pointed out that monolayers reduce surface tension and may impart elasticity and viscosity to the surface film. As reviewed by Soloviev and Lukas (2014), the idea that a monolayer of OM molecules covers the sea-air interface influenced much research during the 1970s and 1980s, and was partly driven by problems of petroleum seeps and spills. The premise was that a molecular monolayer cov-ers the sea surface with or without a thicker underlying layer of carbohydrate/protein or other types of OM. Many experiments were carried out and interpreted based on this monolayer assumption, and the mix of OM types in the SML were often liberally referred to as “surfactants”.
2.2.3. The gel layer model
Based on microscopical observations, the marine microbi-ologist and ecmicrobi-ologist, John Sieburth (1983), hypothesized a surface layer of finite thickness and complex chemical and biological composition, in contrast to the molecu-lar monolayer model. This gel-layer hypothesis has since been confirmed, both in slicks (Carlson, 1987) and in a more general context (Zhang et al., 1998; Cunliffe et al., 2013; Wurl et al., 2011, 2016, 2017).
2.3. OM in the SML and gas exchange reduction (GER)
2.3.1. Dissolved and colloidal OM (DOM and COM)
Part of the DOM in the ocean consists of exudates of vari-ous microalgae and macroalgae (Schilling and Zessner, 2011). Despite much progress in quantifying DOM
Table 1:
A glossar
y of terms used in this review
. DOI: https://doi.org/1 0. 1525/elementa.283.t1 Acronym or symbol Term U nits a Remarks – a Gas film – Non-turbulent boundar
y layer on the gas side of a gas-liquid interface (Liss and Slater
, 1 97 4; Figure 1 ) Gel
A substance that when subjected to a deformation stress
τ
<
τY
, where
τY
is the yield stress,
deforms elastically
. When the stress is removed, the material recovers its original shape. If a
deformation stress >
τY
is applied, the material yields, and on removing the stress, the mate
-rial’s original shape is recovered only partly
, if at all (Barnes et al., 1
989).
–
Liquid film
–
Non-turbulent boundar
y layer on the liquid side of a gas-liquid interface (Liss and Slater
, 197 4; Figure 1 ) – Surfactant –
As used by chemists and surface scientists for material consisting of am
phiphilic molecules,
i.e., molecules bearing both hydrophilic (polar) and hydrophobic (non-polar
) terminations
(Section 2
)
–
“Surfactant” (in quotes)
–
Used here when citing authors who used the term “
surfactant” in a variety of ways, generally
as OM (whether surfactant or not) associated with the air-sea surface (
Section 2
)
CD
Compression-dilation of the sea surface film
–
This is also 2D strain
CO
M
Colloidal organic matter
–
Sometimes distinguished as intermediate between DOM and POM
DOM
Dissolved organic matter
–
Generally OM that passes through a
0.2-µ
m filter (Alderkamp et al., 2007)
EPS
Extracellular polymeric substances
–
FD
Fluorescence depolarization
–
Technique used for measuring viscosity in seawater
, including slicks (
Sections 4.3.6, 4.5
)
GER
Gas exchange reduction
%
–
M
OA
Marine organic aggregate
– – OM Organic matter – – POM
Particulate organic matter
–
Generally OM that is retained by a
0.8-µ
m filter (Alderkamp et al., 2007)
SDR
Superhydrophobic drag reduction
–
In laminar flow of liquid, reduction of drag close to a hydrophobic sculpt
ured wall (Section 4.3.2 ) SML Surface microlayer –
Micrometre-scale vertical sampling of pH and other properties has sho
wn a sharp gradient at a depth of ~50 µ m (Zhang et al., 1 998, 2003b); conveniently
, glass plate and Har
vey stainless
steel mesh samplers typically take a layer of thickness
~50–80
µ
m.
Acronym or symbol Term U nits a Remarks TEP
Transparent exopolymeric substances
–
TO
C
Total organic carbon
mg m
–3
TO
M
Total organic matter
mg m –3 As a rule of thumb T OM is often considered to be T OC × 2. A
Area of a surface film constrained and controlled in a measuring apparatus
m
2
See definition for
γ2D a, b Parameters in Equation 3 – Equation 3 c The quantity HC mole m –3 (notionally) W anninkhof et al. (2009); Equation 1 ccrest For
ward speed of a breaking wave crest
m s –1 Section 5.4 ; Equation 8 C Gas concentration mol m –3 Equation 1 ; Figures 1 and 2 Ca C in air mol m –3 W anninkhof et al. (2009); Figure 2 Cg
C in the bulk gas phase
mol m
–3
Figure 1
Cl
C
in the bulk liquid phase
mol m
–3
Figure 1
Csg
C at the gas side of a gas-liquid interface
mol m
–3
Figure 1
Csl
C at the liquid side of a gas-liquid interface
mol m –3 Figure 1 Cw C in seawater mol m –3 W anninkhof et al. (2009); Figure 2 D
Diffusion coefficient of a particular gas
m 2 s –1 Equation 4 Dair D
of the gas in air
m 2 s –1 After Equation 2 Dwater D
of the gas dissolved in water
m 2 s –1 After Equation 2 Deff
The effective value of
D
compared with a calculated value
m 2 s –1 Pogorzelski and K ogut (200 1); P ogorzelski et al. (2005); Section 4.3.4 G
Modulus (i.e., stress) associated with straining in a 3D medium, used by rheologists for characterizing materials
Pa = N m –2 G ′, G ″ and G* are, respectively
, the elastic (storage) modulus, viscous (loss) modulus and total
modulus, such that
G* = G
′ +
iG
″, where i is the square root of —1 (Barnes et al., 1
989; Ewoldt and McKinley , 2009); Sections 4.3.3 , 4.3.4 . G2D , G* 2D By analogy to G
(above), modulus (stress) associated with
dilation-compression in a 2D surface film
N m –1 As above, G2D (or G*2D
) may be decomposed into
G ′2D and G ″2D ;. Section 4.3.4 ; Equation 5 . (contd.)
Acronym or symbol Term U nits a Remarks H Henr
y coefficient of solubility of gas in a liquid
Dimensionless Equation 1 , Figure 2 . k Diffusivity of gas m s –1 “Roughly proportional” to D
(Liss and Slater
, 1
97
4); see
Equation 2
ka
Diffusivity on the air side such that (
ka /α ) = 1/ Rair m s –1
Liss and Slater (1
97
4), W
anninkhof et al. (2009);
Equation 2
kw
Diffusivity on the water side such that (
ε kw ) = 1/ Rwater m s –1
Liss and Slater (1
97 4), W anninkhof et al. (2009); Equation 2 MW Molecular mass Da = g mol –1 – n Power-law dependence of k on U10 Dimensionless Equation 3 N Avogadro’s number 6.02 × 1 0 23 molecules mol –1 Equation 4 P Radius of a molecule nm
~0.3 nm for hydrated solute molecules of C
O2 or O 2 ; Equation 4 ; Section 3.3.2 R
SML resistance to vertical gas flux
s m
–1
Liss and Slater (1
97 4); text after Equation 2 Rair “Air-side ” resistance s m –1
Liss and Slater (1
97 4); text after Equation 2 Rwater “W ater-side ” resistance s m –1
Liss and Slater (1
97
4); text after
Equation 2
RR
U
niversal gas constant
8.3 1 Jmol –1K –1 Equation 4 T, TS
Temperature, Seawater temperature °C, except where other
wise
stated
Equation 4
tbub
Persistence time of a bubble in a whitecap
s
Section 5.2
U10
W
ind speed at a notional height of 1
0 m above water level m s –1 Section 3.3. 1 . et seq . W , W A , W B
Coverage fraction by total whitecaps, type A whitecaps and type B whitecaps, respectively
%
Section 5.4; Equations 5, 6, 7
and
8
α
Ostwald solubility coefficient of a gas in a liquid
Dimensionless W anninkhof et al. (2009); Equation 2 Δτ 2D
Change in stress in the surface film associated with changes in dilation-compression
N m –1 Section 4.3.4 et seq . ε A chemical “ enhancement factor
”, also referred to as “gas
reactivity” Dimensionless W anninkhof et al. (2009); Equation 2 (contd.)
Acronym or symbol Term U nits a Remarks γ
Shear in a 3D material. (Shear is a particular geometr
y of strain) m m –1, i.e., dimen -sionless
Simple shear (Barnes et al., 1
989)
γ⋅
Strain rate, including shear rate
m m
–1 s –1 = s
–1
γ2D
Dilation-compression strain in a 2D film, equal to d
A
/A
m m
–1, i.e.,
dimensionless
The use of the “2D” notation avoids the need to define the thickness o
f a film, such as the
SML; Section 4.3.4 et seq . γ2D ,shear Shear in a 2D film m m –1, i.e., dimensionless Section 4.3.5 γ2D ,shear Shear in a 2D film m m –1, i.e., dimensionless Section 4.3.5 γ⋅2D
Dilation-compression strain rate in a 2D film area
m 2 m –2 s –1 = s –1 =d γ2D /td ; Section 4.3.4 et seq . η Viscosity of a 3D medium Pa s = N s m –2 Equation 4 , Section 3.3.2 et seq . η2D,shear
2D viscosity associated with shearing in the surface film
N s m –1 Section 4.3.5 et seq . Λ (ccrest )d ccrest
Length of breaking wave crests per area of ocean surface
m m
–2 = m
–1
Equation 8
τ
Shear stress due to shearing in a 3D medium
N m –2 Section 4.3. 1 et seq . τsurf Surface tension N m –1 Section 4.3. 1 et seq . τ2D
Stress associated with dilation-compression of the surface film
N m
–1
Section 4.3.4
τ2D,shear
Stress associated with shearing of the surface film
N m
–1
Section 4.3.5
a A dash ( – ) in the “U
nits
” column denotes “
dimensionless
and POM and its constituents in the last three decades (Nebbioso and Piccolo, 2013), the proportions of their components including carbohydrates, lipids and proteins are still uncertain. It is clear, however, that many are sur-factants sensu stricto, as defined in Section 1.1.
Carbohy-drates are dominant in terms of mass, followed by pro-teins and thirdly by a lipid class comprised of free fatty acids, free fatty alcohols and triglycerides. However, lipids affect the surface electric potential and film pressure of muticomponent films much more strongly than carbohy-drates or proteins in relation to their relatively low abun-dance (Van Vleet and Williams, 1983).
The surface of water or saltwater at an interface with OM-free air possesses surface tension. This tension, by allowing the surface to compress and dilate almost with-out the dissipation of viscous energy, supports the propa-gation of surface ripples, which compress and dilate the interface. Adding surfactants to seawater-air interfaces reduces surface tension without eliminating it: ripples can still propagate. However, many surfactants form aggregates or films that have been shown to increase the 2D dilational viscosity of the surface (Jarvis et al., 1967) and to damp capillary waves (Deacon, 1979), presum-ably by viscous energy dissipation to heat. Goldman et al. (1988) added real surfactants to seawater collected from the NW Atlantic, and showed that they reduced O2 exchange (O2 GER) in laboratory measurements. These authors also found that natural OM (which they also called “surfactants”) in the SML of these waters was posi-tively related to GER. Frew et al. (1990) used identical methods to measure O2 GER in filtered and unfiltered cultures of seven marine algal species diluted with either distilled water or natural seawater. Finite O2 GER always occurred relative to culture-medium controls, with values of (1/GER) = (O2 flux in experimental material)/(O2 flux in control) ranging from 58% to 100% (their Figure 3). The
term (1/GER) showed a non-linear negative relationship with total organic carbon concentration [TOC], but also showed a high-scatter intercept around 74%, suggesting that both [TOC] and unknown factor(s) played comparably important roles in reducing O2 exchange. The authors also measured 3D shear viscosity at a high shear rate of 73.4 s–1 (Brookfield LVTD viscometer) at 20°C. Relative to cul-ture-medium controls, algal treatments increased viscos-ity from ~0 to ~400%, the highest being for Porphyridium culture (their Tables 2 and 4), but viscosity showed no clear relationship with GER.
Calleja et al. (2009) used an in-situ floating device to measure air-sea CO2 exchange in the NE Tropical Atlantic and off the Antarctic Peninsula at 10-m altitude wind speeds (U10) of 1–12 m s–1. They compared measured to modelled values of gas exchange rate (i.e., gas exchange speed |k|) and thereby effectively derived GER. Their find-ings show that [TOC] was positively related to GER at U10 values of 1–5 m s–1, and that GER values also co-varied seasonally and geographically with marine productivity. The authors found [TOC] at 5 m depth to range from 40 to 125 µmol C L–1, with corresponding [TOC] in the top 2 cm ranging from 8% lower to 73% higher. CO2 residual flux over a range of [TOC] from 60 to 120 µmol C L–1 showed
a strong negative relationship with [TOC] in the top 1 cm (Calleja et al., 2009; their Figure 4). The authors
con-cluded that the total organic carbon concentration [TOC] at the water surface suppresses air-sea CO2 gas fluxes at wind speeds at least up to 5 m s–1. [TOC] was found to be associated with reduced fluxes of other gases rather simi-larly, and they suggested that this may apply not only in the areas they studied but over the world ocean. In this respect, Sabbaghzadeh et al. (2017), in two transects in the Atlantic from 50°N to 50°S, found little or no rela-tionship between U10 and the enrichment factor of “sur-factant” concentration in the SML relative to that in 7-m deep subsurface water. Measurements were made at U10 values ranging from 0.5 to 13 m s–1, and this implies that such wind speeds cause little or no “mixing down” of the surface-associated OM.
Liss and Slater (1974) proposed a simplified equilib-rium model of air-sea gas exchange in which gas transfers through two non-turbulent boundary layers in series, one on the gas-side of the gas-liquid interface, and the other on the liquid-side (Figure 1). The gas concentrations on the
gas-side (Cgl) and on the liquid-side (Csl) of the gas-liquid interface are different in proportion to the solubility of the gas in the liquid (Henry’s Law). A quantity c may be calculated such that:
c H C= (1)
where H (the Henry’s law coefficient) = [equilibrium con-centration in the gas phase (g cm–3 of air)]/[equilibrium concentration of un-ionized dissolved gas in the liquid phase (g cm–3 of water)] for the particular gas, which is closely related to 1/α, where α is solubility in the liquid, and C is the gas concentration (Figure 2). Values of α in
seawater are given for several gases by Wanninkhof et al. (2009).
Wanninkhof et al. (2009) modified Liss and Slater’s model by plotting c rather than C across the SML (Figure 2). In this model, as long as the interface itself
provides no resistance to diffusion (e.g., by OM) then c is the same at the air side and the liquid side of the inter-face. The total resistance to transfer is therefore the sum of the respective resistances in the air and water diffusive sublayer (boundary layer); k–1 is proportional to the total resistance:
(
)
1(
)
11 / ,
a w
k− = k α − + εk − (2)
where ka/α = 1/Rair, where Rair is the air-side resistance, and εkw = 1/Rwater, where Rwater is the water-side resistance. The terms ka and kw have the units of velocity (Liss and Slater, 1974) (because they represent transfer across a large 2D surface rather than in 3D), and they are roughly pro-portional to Dair and Dwater, the respective diffusion coef-ficients (m2 s–1) of gas in air and of dissolved gas in water. In both the Liss-Slater and Wanninkhof models the inter-face is implicitly of zero thickness. In reality in the gas film and the liquid film are unlikely to be as well defined as in these two models or to show in general linear gradients of concentration as depicted in Figures 1 and 2. While the
Figure 1: Simplified conceptual two-layer equilibrium model of air-sea gas exchange. In this sketch, net transfer
from air to sea is assumed. Cl and Cg are gas concentrations in the bulk phase of the liquid and gas phases, respectively.
Csl and Csg are the concentrations, respectively, at the liquid-side and the gas-side of the gas-liquid interface. Note that
Csl < Csg because solubility of the gas in the seawater phase is <100%. (Inspired and somewhat reconceptualised from Liss and Slater, 1974). DOI: https://doi.org/10.1525/elementa.283.f1
Figure 2: Conceptual view of boundary layer concentration profiles. Resistance to gas transfer is concentrated
in the diffusive sublayers. On the left (blue line) is the activity profile for an insoluble gas with the resistance in the aqueous-side diffusive sublayer. On the right (red line) is the profile for a soluble gas with resistance in the air-side diffusive sublayer. Soluble gases have an Ostwald solubility >100. The figure assumes no resistance to diffusion (e.g., by OM) at the interface. C indicates gas concentration; H, Henry coefficient of solubility; subscript a, in air; and sub-script w, in seawater. (Redrawn and reconceptualised from Wanninkhof et al., 2009). DOI: https://doi.org/10.1525/ elementa.283.f2
diffusive sublayers (Figure 2) need further modeling and
in situ investigation, the key determinants of gas
trans-fer speed k are likely to be the concentration gradients on both the water- and air-sides where they intercept with the interface.
As Liss and Slater (1974) suggested, any contaminants would contribute to the resistance of the phase in which they occur. The work of Goldman et al. (1988) and of Calleja et al. (2009), both discussed above, has empirically strongly supported Liss and Slater’s earlier conjecture.
The transfer velocity k of gases with α > ~100, for gases that react rapidly in water, is controlled by processes on the airside of the interface, and not on the waterside (Liss and Slater, 1974; Wanninkhof et al., 2009; Figure 1). For
gases with values of α < ~1, as well as those with high reac-tivity ε, however, k is limited by processes on the water-side. For CO2, which has a low to intermediate value of α (0.727) at 20°C and 35 psu (Wanninkhof et al., 2009) and a high value of ε, k may thus be controlled by processes on both sides of the interface.
While consideration of GER in this section has, for sim-plicity, mainly assumed a stagnant-water model, gas flux and GER in the real ocean take place under a wide range of meteorological, hydrological and biological conditions. Wanninkhof et al. (2009) have reviewed much work on determining k for CO2 and other gases under calm and moderate wind speed conditions (U10) in situ and in the laboratory (considering calm conditions as 0–3.6 m s–1, moderate as 3.6–13 m s–1,and rough as >13 m s–1). Under moderate conditions, work at sea becomes more diffi-cult, and laboratory simulations perhaps less realistic. Determination of k in calm and moderate conditions gen-erally gives a power law relationship:
10n,
k = +b a U (3)
where b represents k under stagnant conditions, and n lies between 2 and 3, with an empirically determined coefficient a. Measured values, however, give considera-ble scatter, and an unknown fraction of this scatter may be due to GER produced by biopolymers (Calleja et al., 2009). Under calm and moderate winds, understanding of air-sea exchange of gases, heat, humidity, momen-tum as well as wave propagation and foam formation will be improved in future by more sophisticated, high-speed, high-resolution 3D filming of surface processes, and may improve phenomenological understanding of CO2 k.
Polymer molecules tend to be rheologically active. In 3D, particulate, colloidal and dissolved polymers in ocean water, including transparent exopolymeric parti-cles (TEP) and organic aggregates (OAs), produce elasticity and increase viscosity in the bulk phase of both underly-ing water and in water sampled from the SML. In 2D, by binding electrically to or otherwise associating with the surface film, they produce viscosity in it (Van Vleet and Williams, 1983) and change its elasticity both in the SML and on the surfaces of bubbles and droplets.
As much DOM and TEP and many OAs are sticky or sur-face-active, and in some cases buoyant (Riebesell, 1992;
Mari, 2008), a fraction of this material accumulates at the surface. The hydrophobic (non-polar) fraction largely becomes electrically bound to the surface (Žutic´ et al., 1981; C´osovic´ et al., 2005), while the hydrophilic (polar) fraction will be electrically repelled by it (van Oss et al, 2005), but may float by buoyancy just below it. Surfactant
sensu stricto molecules will tend to become incorporated
into the film just below the hydrophobic fraction. This organic surface “film” material is visible in calm weather when it forms slicks, which have marked surface rigidity, causing structure in the water surface at scales that can exceed 100 m and 100 min when the sea is calm (Peltzer et al, 1992; Figure 5).
In surface samples taken from the NW Atlantic, from coastal waters of the USA to a point about 1000 km offshore near Bermuda, as well as in some from the Caribbean, Goldman et al. (1988) measured O2 GER under turbulent conditions in the laboratory. They found that O2 GER values related to surface OM, which they called “surfactant”, and they were much higher for inshore sam-ples (~50%) than for offshore samsam-ples (~10%). Calleja et al. (2009) compared GER (CO2) in spring, summer and autumn in the North Atlantic and the Southern oceans, at wind speeds up to 5 m s–1, and found GER positively related to total organic matter (TOM) in the top cm or so, covarying also with marine productivity. Precise measure-ment of gas exchange at higher wind speeds is crucial but remains difficult.
Assuming that the covariation between OM con-centration and GER across the SML is because the OM actually causes GER, then what is the mechanism? Two classes of mechanism appear the most plausible: 1) reduction in vertical movement of water containing the dissolved gas by partial gelling (increased elasticity) in and/or near the SML (Jenkinson, 1993b; Jenkinson and Biddanda, 1995); and 2) reduction of molecular diffu-sion of the gas due to obstruction by molecules or larger structures of OM. Two further mechanisms might also be possible: 3) adsorption of the gas onto OM molecules; and 4) electrical effects close below and/or close above the air-sea surface. We next consider these four possible mechanisms.
Concerning the boundary between the turbulent layer and the diffusive sublayer on both sides (water and air) of the air-sea interface (Figure 2), such boundaries still
remain complex and difficult to model (Adrian, 2010; Marusic et al., 2010). The presence of biopolymers of various rheological and surface properties complicates the situation even further. We suggest that there is a long way to go before models incorporating the diffu-sive and turbulent fluxes, particularly on the water side of the air-sea interface, can be adequately conceived and tested. The “economical” approach – assuming OM does not affect fluxes – has now been shown false. Therefore, while the difficult phenomenological models of turbulence and rheology are catching up, the best way forward may be empirical laboratory and field measure-ments of fluxes within the ambient envelope of physical and biological sea-surface conditions over a wide range of scales.
2.3.2. Gel and non-living POM
The Einstein relation states that the diffusion coefficient:
(
)
/ 6 ,
D RR T= π ηN P (4)
where RR is the universal gas constant (8.31 J mol–1 K–1),
T is temperature (Kelvin units), η is the viscosity (Pa s), N
is Avogadro’s number (6.02 × 10²³), and P is the hydrated radius of the solute molecules (~0.3 nm for CO2 and O2) (Conlisk, 2013). This relationship is very well known, but it was derived for systems with only small, roughly spheri-cal molecules. For polymeric systems, applying this rela-tionship is generally inappropriate. Where the polymers form a gel-type network of fibrils, molecules smaller than the mesh size between the fibres will diffuse more or less unhindered (Sonnenburg et al., 1990), while the gel net-work adds elasticity to the material at length scale larger than mesh length scale. The dependence of D on η in poly-mer solutions and gels thus becomes a function of length scale and geometry. In such cases neither viscosity nor diffusion coefficient can be predicted from Equation 4,
and measurements need to be conducted case by case at the scale(s) and geometry(ies) appropriate to the problem in hand. However, extending the approach of Calleja et al (2009) might be more pragmatic.
2.3.3. Living POM
Anthropically driven eutrophication and climate change are leading to increasing biomass of phytoplankton in coastal waters (Glibert et al., 2005), in particular the occurrence of taxa such as Karenia mikimotoi, Phaeocystis spp. and Ostreopsis ovata (Lassus et al., 2016), which mark-edly increase seawater viscosity, while Phaeocystis also produces large quantities of foam (Seuront et al., 2006; Jenkinson et al., 2015; Giussani et al., 2015). Engel et al. (2017a) found that blooming of Phaeocystis pouchetii in Arctic waters east of Greenland are also strongly associated with massive production of TEP (up to several hundreds of µg Xeq L–1). Phaeocystis antarctica also blooms over huge swathes of the Southern Ocean (Smith et al., 2003; Seuront et al., 2010), and floating macroalgae, including
Enteromorpha prolifera (Zhou et al., 2015) and Sargassum
spp. (Smetacek and Zingone, 2013) are increasing around the world. These algae may be modifying surface proper-ties, gas exchange and wave propagation not only by OM secretion but also directly by the mechanical properties of their filaments and thalli which may hinder diffusion. Filamentous cyanobacteria such as Trichodesmium spp. float on the surface of many oceans (Capone et al., 1997), as do Aphanizomenon spp. and Nodularia spumigena in the Baltic (Ploug, 2008) and some Phycoma stages of spe-cies of the prasinophyte Halosphaera (Jenkinson, 1986b; Throndsen, 1996) in the North Atlantic.
2.4. Conclusions concerning OM
The huge pool of OM in the oceans, over 1 × 10¹² tonnes, represents only a mean concentration of ~40 µmol C kg–1 in the water. It consists predominantly of DOM. For thousands of years, the effect of adding oil to ocean and lake water has been observed to calm the surface,
predominantly ripples. As addition of oil was observed to spread rapidly on the surface to form what could be calcu-lated as a molecular monolayer, early models of ripple and wave damping, as well as gas exchange by oils, solvents and natural OM were based on the concept of a monolayer of OM at the surface. For natural OM, such a monolayer was generally assumed to be dominated by lipid. Later, biologists contributed observations of the SML, showing that it consists of a characteristic ecosystem, is composed of an OM layer more like a gel, and is thicker than previ-ously thought. This gel-type material consists principally of carbohydrates and proteins as well as lipids. Many of these components are present as terminations on the same polymeric molecules. Most ocean DOM is refractory, having a half-life estimated at thousands of years, but a small part (<1%) is labile (hours to days), and thus repre-sents a proportionately large C flux.
Much work on the 2D dilation-compression rheology (dynamic surface tension studies) of the SML, carried out in the 1980s and 90s (and reviewed here), was also accompanied by some work on SML rheology combined with work on GER. Most of this work addressed O2, but the findings also seem relevant to CO2 GER. This work and later, more extensive, work has found GER to co-vary with OM in the SML, as well as with primary production.
Study of the physical structure of the SML in relation to gas diffusion and solubility dynamics has been domi-nated by models, with experimental verification notably by Liss and Slater (1974), and later by Wanninkhof and co-workers (Wanninkhof et al., 2009, and citations therein). Such work needs to continue, combined with that on the effects of OM on GER.
Considering living POM, the little work on the effects of different phytoplankton species on both 3D and 2D thalassorheology, as well as on gas exchange, has shown huge differences among species. This work is particularly important as it suggests that switches in species domi-nance could have large effects on gas diffusion and aero-sol production, especially as the climate changes.
Finally, lipids affect the surface electric potential of the surface proportionately more than other OM components in relation to their abundance. This electrical potential effect due to lipids and other OM is not included in detail in the present review, but may be very important in deter-mining surface film dynamics, and thus GER. Earlier elec-trochemical studies have not been followed up; this field may require greater diligence, particularly in relation to GER, aerosols and climate change.
3. SML physics
3.1. Some mechanisms for reduction of vertical water movement in and near the SML
Close to the air-sea surface, vertical movement of water is produced by both cooling and evaporation at the sur-face, two often negatively correlated processes, as well as any turbulence forced from the water below or from the air above. Defined relative to the surface, and neglecting rain and evaporation, upward and downward movement of water has to be equal, and must involve lateral water
movement as well, necessarily forming circulation cells and patterns, potentially detectable at the surface. Verti-cal water movement is resisted by the two main stratify-ing mechanisms, input of heat (solar radiation or warm air) or freshwater (rain, snow, runoff from land, melting ice, condensation of water vapour) to the surface. Quan-tification of these processes, to be most useful, must be made at the scales involved in them. Some types of OM, notably those forming networks of polymer fibrils or even larger structures such as thalli of floating macroalgae, are likely to increase viscoelasticity and hence resist water movement thus damping turbulence (Jenkinson, 1986a, 1993a, 1993b). Similarly, the scales of these structures and of any resistance they make to water movement must be correctly identified and used in measurements and mod-elling. Anisotropic horizontal layering of structures is likely to be the most effective geometry in resisting verti-cal water movement. Conversely, output of heat (outward radiation, cold air) or loss of water (evaporation) from the surface to the air increases density and reduces or even destroys stability.
3.2. Micrometre- and nanometre-scale physics
The air side of water-air interface may be considered as the most hydrophobic, non-polar surface known (van Oss et al., 2005). When surfactant molecules get sufficiently close to a water-gas surface or a water-oil surface, they orientate with the hydrophobic heads projecting into the hydrophobic phase and the hydrophilic tails into the water phase. This molecular-scale attraction to the sur-face pushes them to spread out on the sursur-face to form a monolayer unless opposed by other sufficiently strong forces, such as wind drag. By comparison, when hydro-phobic molecules get sufficiently close, a few nanome-tres (van Oss et al., 2005), to a water-gas or a water-oil surface, molecular-scale forces attract them into the oil or gas phase. Correspondingly, on the water side of such an interface, polar molecules, such as sugars and neutral salts are then sterically excluded from the surface, leav-ing a layer of essentially pure water a few nanometres thick. Any surfactant macromolecules larger than a few nanometres, however, would span the otherwise pure layer. If the water-gas surface is the SML of a calm sea, gravity will oppose this repulsion so that the oil or lipid (if pure) would sit suspended slightly (a few nanometres) above the surface without binding to it. This hydropho-bic repulsion may allow drag reduction to occur between the hydrophobic surface layer and the underlying water and dissolved, colloidal or particulate polar material. If hydrophobic material but no surfactant is present at the interface, then a slip layer of functionally reduced viscos-ity between the water and hydrophilic matter on the one hand and the overlying hydrophobic matter on the other could result, as proposed by Jenkinson and Sun (2014) to explain laminar drag reduction found in cultures of bacteria and marine microalgae. The thickness of this slip layer would depend on the degree of hydrophobicity and on the details of roughness of the hydrophobic surface (Rothstein, 2010).
3.3. Thalassorheology of ocean water in the top 100 m and the top 1 mm
3.3.1. General considerations
In 3D geometries, the rheological (“thickening”) effects of OM in the SML, and in the metre or so below it, have been assessed by both viscometry and rheometry meas-urements and reported as increases in seawater viscosity η, as stress τ vs. shear γ, and/or as τ vs. shear rate γ⋅, and in capillary-tube-flow. In 2D geometries, dilational rheome-try (also known as dynamic surface tension measurement) measures and reports changes in surface tension τsurf vs. surface dilation-compression strain γ2D and/or as τsurf vs. surface dilation-compression strain rate γ⋅2D.
3.3.2. Organic matter and the mechanical (rheological) properties of the SML
The most labile pool of DOM in the oceans consists of less than 1% of the total DOM, but its very lability represents a large C flux. This labile DOC pool is variable in molecular composition, from one location to another, but the major part of it originates from secretions and cell breakdown in the primary-production-driven food web. It consists of acid and neutral carbohydrates, lipids, proteins, nucleic acids and other organic molecules, but the exact proportions of its components are still poorly known due to difficulties in marine OM analyses, despite major recent advances. Much of the labile pool of DOM is known to be in rapid exchange with TEP, active at surfaces and, like TEP, gener-ally sticky (Mari et al., 2016). The labile pool is believed to be the part of DOM mainly responsible for both elastic-ity and for the non-Newtonian “excess” viscoselastic-ity, not due to water and salts alone, in the seawater bulk phase (Jen-kinson, 1993b; Jenkinson and Sun, 2010; Jenkinson et al., 2015). For instance, Jenkinson and Biddanda (1995) found that elasticity and excess viscosity were positively related to chlorophyll concentration at scales of metres to thou-sands of kilometres.
Surface effects on the cellular surfaces of plankton, including possible superhydrophobic drag reduction (SDR), have been addressed by Jenkinson (2014). The sea surface, too, is hyperhydrophobic (van Oss et al., 2005), and the implications of this characteristic are considered in Section 4.3.4.
3.3.3. Differing effects of taxa, physiological state and life stage
Some marine (Jenkinson, 1986a, 1993a) and freshwater (Petkov and Bratkova, 1996) phytoplankton species in cul-ture have been found to contribute strongly to 3D elastic-ity and excess 3D viscoselastic-ity, but others had less or no meas-urable effect, suggesting that differences between species, and perhaps physiological state, may add variance to the above-mentioned relationship between viscoelasticity and chlorophyll concentration. Jenkinson and Sun (2010) have summarized these measurements.
Portela et al. (2013) and Patricio et al. (2015) made rheological measurements on cultures of the bacterium
Staphylococcus aureus. As in Phaeocystis (Seuront et al.,
changed markedly with growth phase, and not simply with cell density or time. The viscous modulus G″ and the elastic modulus G′ showed different power-law relation-ships with shear rarte, as in the different planktonic algae measured by Jenkinson (1986a). In bacterial cultures, the power law exponents also changed as a function of growth phase. These observations suggest a promising area of research, as similar work following life cycle stages in cultures of phytoplankton would be easy to implement.
3.3.4. 2D dilational rheological properties of the surface film The accumulation of buoyant, hydrophobic or amphiphi-lic material at the surface of water lowers the apparent surface tension of water. Compared to the air interface of most other liquids, that of pure water shows an exception-ally high surface tension, –τsurf = 72.8 mN m–1 at 20°C (van Oss et al., 2005). A drop of floating hydrophobic material deposited on water reduces |–τsurf| locally. The local gra-dient of surface tension generates a net force that tends to spread the drop from the low surface tension region towards the high surface tension region. This tendency explains why, when a drop of low-viscosity oil or soap solu-tion is spread on a calm pond, the surface rapidly with-draws from the position of the drop. If the oil or soap has high viscosity, however, the withdrawal will be slower.
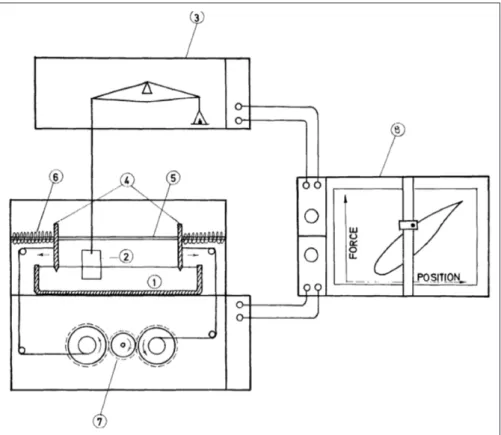
Using an apparatus similar to those in Figures 3 and 4,
a range of workers (e.g., Dragcˇevic´ et al., 1979; Dragcˇevic´
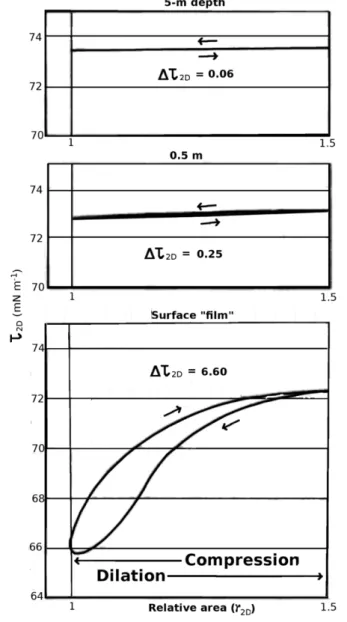
and Pravdic´, 1980, 1981; Williams et al., 1980, 1986; Van Vleet and Williams, 1983; Goldman et al., 1988; Frew and Nelson, 1992a, b; Frew et al., 2006) have compared the 2D rheological properties of both surface “film” samples taken with a stainless steel mesh sampler with samples taken by bottle from depths of 0.5 m and 5m. Oscillation of the wiper (slider) in the apparatus gave Lissajous plots (Ewoldt and McKinley, 2009) of τ2D vs. γ2D (not shown), where the strain γ2D = dA/A is the relative variation of the total area in the experiment. As the wipers compressed the surface-film material, the apparent surface tension τ2D measured by the Wilhelmy plate decreased by an amount Δτ2D up to 6.6 mN m–1 for the surface “film” of water itself sampled from the surface “film” in situ, but only 0.06 mN m–1 for water from 5m depth (Figure 6). Δτ
2D represents the total resistance by the surface layer to compression. It increases during compression, pushing back against this compression. By analogy with the pressure of a 3D gas (but with a change in dimensions from Pa = N m–2 to N m–1), the difference Δτ
2D = τ0 – τ2D is called the surface pressure of the microlayer. The compressive motion of the wiper was stated by the authors to be sinusoidal. The peak in compression rate dγ2D/dt = γ⋅2D therefore occurs at mid-trajectory, γ2D = 1.25. Such behaviour is typical of a visco-elastic material described by a surface viscoe-lastic modulus G*2D, such that Δτ2D = G*2D γ2D. G*2D is a complex quantity, G2D* = G′2D + iG″2D, the real part G′2D
Figure 3: Apparatus for measuring dilation rheology of the surface film. The depicted setup is to measure
water-air dynamic surface tension (allowing surface visco-elasticity to be determined) with a Langmuir trough (aluminium lined with polytetrafluoroethylene [PTFE; i.e., Teflon]): 1 – rectangular sample trough; 2 – platinum-foil Wilhelmy plate; 3 –microbalance; 4 –twin oscillating PTFE blades; 5 – guide for blade travel; 6 – springs forcing blades towards centre of tough; 7 – motor-operated pulley opposing force exerted by the springs; 8 – chart recorder. For further details see Dragcˇevic´ et al. (1979). DOI: https://doi.org/10.1525/elementa.283.f3
being associated with the elastic response of the material, and the imaginary part G′2D associated with the viscous response. The Lissajous plots of 2D dilation-compression give the modulus |G*2D| = Δτ2D/Δγ2D as equal to the slope of the ellipse axis, where Δγ2D is the total amplitude of variation of γ2D and the viscous modulus G″ is equal to the maximum vertical extent within the ellipse. In this 2D material subject to sinusoidal 2D compression-dilation strain, G*2D is referred to in the literature as the 2D dila-tional visco-elastic modulus. It is defined as:
2 2 2 2 D D D D d d G A dA d Δ ∗ = − τ = τ γ (5)
The figure traced may be considered a deformed prolate ellipse, with an axis increasing in slope with compression (smaller value of γ2D) and a vertical extent also increas-ing with compression. This indicates that with increasincreas-ing compression the surface material became more rigid (high 2D modulus |G*2D|) and more viscous (high value of G″2D).
From Lissajous plots of dynamic surface tension τ2D vs. compression-dilation, 2D rheological properties (2D elastic modulus G′2D and 2D viscous modulus G″2D) can be derived. Lipids and complex surfactant molecules may modify surface properties and bulk-phase rheological properties (Jenkinson and Sun, 2010) more strongly. As the carboxyl (sugar) groups composing carbohydrates are hydrophilic, they will not associate with the water-gas film at molecular scale, but as many carbohydrates are buoyant and associated with TEP (Mari et al., 2016), a fraction of them rise by buoyancy, sometimes aided by incorporated gas bubbles (Wurl et al., 2011), to form a layer of more-or-less broken-up gel just below the film (Wurl and Holmes,
2008). Some of the carbohydrate material is present as functional groups on large molecules that are surfactants
sensu stricto (Z´utic´ et al., 1981), and such molecules will
tend to associate with the surface at polymer-molecule length scale. Buoyancy of TEP is negatively related to pH, so ocean acidification is likely to increase the fraction of TEP associating with the surface film (Mari et al., 2016), and so tend to increase SML rigidity as well as GER.
Analyses of organic matter in the surface layer (Larsson et al., 1974) show concentrations of up to 75 µg L–1 of sat-urated and unsatsat-urated 16C and 18C fatty acids. Dragcˇevic´ et al. (1979) and Dragcˇevic´ and Pravdic´ (1981) have dis-cussed whether these fatty acids may or may not form micelles totally or partially reversibly under compression. Such micelle formation, or indeed crumpling of the film downwards into the bulk phase, would absorb energy in separating adsorbed or floating material from the micro-layer. At low molecular concentrations in the microlayer, clockwise hysteresis curves of τ2D vs. γ2D (see Figure 6)
were recorded by Dragcˇevic´ et al. (1979) and by Van Vleet and Williams (1983), representing positive dissipa-tion of energy; anticlockwise curves were also recorded by Dragcˇevic´ et al. (1979). The values of this “negative energy” contained in the anticlockwise curves were very small, however, and it is not clear whether they repre-sent measurement artefacts or a real phenomenon. (The phenomenon of “negative energy” in Lissajous curves is addressed by Ewoldt and McKinley, 2009).
The time taken to fully form the mechanical properties of a freshly cleaned sea surface (in the laboratory) were found using surface compression rheometry to be at least 2 h (Dragcˇevic´ et al., 1979; see their Figure 5) for North
Adriatic water.
Figure 4: Apparatus for measuring dilation rheology of the surface film together with surface electrical field on the air side. Surface visco-elasticity and surface potential are measured with a Langmuir trough (single
oscil-lating surface PTFE blade, Wilhelmy plate and differential electrometer): 1 – sample trough; 2 – reference trough; 3 - gold-electrode sensors of electrical potential; 4 – electrical ground connection; 5 – radioactive ionization probes; 6 – vertically adjustable electrode holder; 7 – Faraday’s cage; 8 – position transducer; 9 – sweep motor and drive; 10 – Wilhelmy-plate surface-tension sensor; 11 – surface tension electrobalance; 12 – PTFE surface sweeper; 13 – dif-ferential electrometer; 14 and 15 – recording devices; 16 – sweep-rate controller (Pravdic´ and Dragcˇevic´, 1985). DOI: https://doi.org/10.1525/elementa.283.f4
Dragcˇevic´ et al. (1979) considered that there are three possible processes of surface film formation:
(1) release of film-forming agent from particulate matter or micelles (aggregates possibly of surfactant matter);
(2) 2D surface spreading, a process familiar from observing oil slicks; and
(3) transport from the bulk of the water by diffusion, convection or both to the sea-air surface or to bubbles either in the bulk-water phase or in whitecaps, as well as by mixing and bubble scavenging.
Dragcˇevic´ et al. (1979) further considered that although the source of the film-forming material is the same for the bubble surfaces and the sea surface, fluid dynamics pro-cesses, as well as surface spreading and bubble flotation, may fractionate the various components of the material differently. These authors concluded that the transport and binding of ionic and molecular material at the bubble-water and air-sea interfaces should depend strongly on the properties of the OM in the subsurface layer. Important for modulating gas exchange among these near-surface fluid dynamic processes might be: wind, wave spectra, tur-bulence from below, surface convergence and divergence, and photosynthetic O2 production.
The viscous part of the visco-elastic dilational modu-lus comes from two components: 1) the internal dynam-ics of the vertical exchanges between the solid, colloidal and dissolved material in the bulk and the surface of the water; and 2) horizontal compression-dilation straining of material closely associated with the surface layer. These exchanges may have many different origins, each process being associated with a characteristic time (Dragcˇevic´ and Pravdic´, 1981). How to separate these two nents is still not resolved. Concerning the first compo-nent, Pogorzelski and Kogut (2003) concluded from their work on the Baltic and Mediterranean Sea surfaces that, “The stress-relaxation measurements revealed a two-step
relaxation process at the interface with characteristic times
t1 = 1.1–2.8 and t2 = 5.6–25.6 seconds [which] suggest[s] the presence of diffusion-controlled and structural organ-isation relaxation phenomena. The[se]… results suggest that natural films are a complex mixture of biomolecules covering a wide range of solubility, surface activity and molecular masses with an apparent structural organisa-tion exhibiting a spatial and temporal variability.”
Concerning vertical molecular diffusion Pogorzelski (2001), Pogorzelski and Kogut (2001) and Pogorzelski et al. (2005), reviewing previous work, calculated molecu-lar mass MW from plots of surface pressure, Δτ2D vs. t for short (t → 0) and long (t → ∞) times, and also calculated diffusion coefficient D as if it had been composed of monomers rather than polymeric clusters. Values of Mw scattered widely from 2 to 166 kDa, with a typical value of 50 kDa. The real diffusion rates Deff were mostly lower than D, strongly suggesting that diffusion of the molecules
Figure 5: Redistribution of surface-associated OM and slick patterns by passage of a ship. Surface
wake pattern 100 min after passage of a ship, showing contrast between undisturbed and disturbed surface film patterns. Remastered from Peltzer et al. (1992). DOI: https://doi.org/10.1525/elementa.283.f5
Figure 6: Lissajous plots of measured dynamic sur-face tension vs. change in sursur-face area. Values of
surface tension τ2D vs. γ2D similar to those in Figures 3
and 4. (Redrawn from Dragcˇevic´ et al., 1979). DOI:
is hindered by an adsorption barrier crowded with other molecules. Values of Deff were measured, and values of
Deff/D presented. In Baltic Sea waters, values of Deff/D in the surface film ranged from 0.16 to 0.01; and in surface films from waters of nearby lakes and rivers, from 0.87 to 0.001. In both the Baltic Sea and in freshwaters, values of Deff/D nearest to unity occurred in February, while the lowest values occurred in May or August, suggesting that reduction in Deff was related to polymers produced by pri-mary production. To account for values of Deff/D far lower than 1, especially in later spring and summer, the authors suggested that the biopolymer molecules must have been aggregated, which concurs with present consensus on the seasonality of primary productivity. Pogorzelski’s findings of molecular diffusion reduced relative to calculated dif-fusion represent evidence that concurs with observations by Sieburth (1983), Wurl and Holmes (2008) and Wurl et al. (2011, 2016), as well as model-aided conclusions of Mari et al. (2016) of more-or-less broken-up gel associated with the surface microlayer. Where foam is present (Section 4),
corresponding exchanges take place also between the bulk water, the SML and the foam (Johnson et al., 1989).
3.3.5. 2D shear rheological properties of the surface film
Kuhnhenn et al. (2006) carried out measurements of sur-face shear rheology on the sursur-face of seawater and algal cultures. Measurements were started after the surface film had been removed in order to follow the rate of film for-mation. The authors reported their results in surface shear viscosity and surface shear rigidity, referring to both the methodology used in a previous study (Krägel et al., 2003) and the website of the apparatus manufacturers (Sinterface Technologies, 2017). However, recovering the surface shear stresses from the data in Kuhnhenn et al. (2006) is not possible. The authors reported how surface
rheologi-cal parameters changed over up to 18 h in cultures of the diatoms Thalassiosira rotula (9.8 × 10³ mL–1), T. punctigera (11.4 × 10³ mL–1) and Nitzschia closterium (2.27 × 10⁶ mL–1), and the haptophyte Phaeocystis sp. (0.12 × 10⁶ mL–1), as well as f/2 culture medium and seawater of salinity 31. Initial values of surface shear viscosity η2D,Shear ranged from 2 µN s m–1 for seawater to 7–8 for Thalassiosira and
Phaeo-cystis to 12 µN s m–1 for Nitzschia. Over time, η
2D,shear for
the seawater remained practically unchanged up to 200 min, and it decreased for the other materials except for
Nitzschia, for which it markedly increased to 33 µN s m–1 after 610 min before declining slightly. In considering the relatively large surface rheological effects produced in the Nitzschia closterium culture, bear in mind firstly that its concentration was much higher in these experiments than those of the Thalassiosira species investigated, and that its cell size and carbon content are much larger than
Phaeocystis, and secondly that in nature N. closterium,
although frequently found in coastal plankton, associates facultatively with benthic biofilms.
The only other measurements of surface shear rheo-logical properties on the surface film of seawater and phytoplankton cultures appear to have been made by Jenkinson (1993b) to understand interference by sur-face effects on measurements in the bulk phase, using a Contraves/Mettler LS 40 rheometer and Couette shear-ing system with a surface bob suspended at the liquid-air interface. Figure 7 (right-hand side) illustrates the
meas-uring system. In this figure, the right-hand insert shows a schematic profile view of a cup and a surface bob for measurements of shear rheology of the air-liquid inter-face. During measurements, the Couette system was pro-tected from air currents by two Plexiglas boxes, one inside the other. Surface shear stress τ2D,shear was found to oscil-late with a frequency equal to that of the rotating cup, suggesting more-or-less deformable plaques of material
Figure 7: System for measuring 3D bulk-phase shearing rheology and 2D surface-phase shear rheology. Detail
of the Contraves/Mettler LOWSHEAR 30 rheometer used by Jenkinson, 1986a, 1993b) and by Jenkinson and Biddanda (1995). Remodelled from manufacturers’ promotion literature. DOI: https://doi.org/10.1525/elementa.283.f7
at the water-air interface attached to menisci at the cup and the bob, rubbing past each other. Deionized double distilled water that had been kept in a laboratory wash bottle for several days was also measured under continu-ous rotation for τ2D,shear. τ2D,shear on the surface of this water was again found to oscillate with a frequency equal to that of the cup rotation, suggesting a quasi-stable plaque structure formed here as well. For filtered (0.2 µm) sea-water the half-amplitude of τ2D,shear varied from 0.17 mN m–1 to 0.34 mN m–1, while a filtered Skeletonema culture gave even higher half-amplitude values, up to 2.0 mN m–1. The filtered culture gave τ
2D,shear values that increased
quasi-exponentially with time on standing in the cup (Jenkinson, 1993b), reminiscent of the observation by Kuhnhenn et al. (2006) for Nitzschia closterium culture.
3.3.6. Viscosity of water from the SML measured by fluorescence depolarization
Using fluorescence depolarization (FD), Carlson’s team (Carlson, 1987; Carlson et al., 1987) sampled bulk seawater with bottles, and used a glass plate to sample from SMLs, with and without slicks, from eastern and western coastal waters of the USA. For unfiltered samples, unslicked SMLs showed viscosity that was not significantly different from bulk water. In contrast, slicks were significantly more vis-cous (mean increase of 6%), and filtered (3 µm) slicks were 3% more viscous. Filtered (0.2 µm) unslicked SMLs did not differ from either unslicked SML or bulk water.
Jenkinson and Sun (2010) suggested that a disadvan-tage of the FD technique was its lack of an association with explicit scales of shear rate or length. It may be pos-sible, however, to calculate length and shear-rate scales from the rotation of the fluorescent molecules (Kuimova et al., 2009), and thus to cross-calibrate them against the specific scales of measurements made with mechanical rheometers.
3.3.7. 3D shear rheology of seawater from the SML
As far as we are aware, the only other rheological measure-ments comparing the SML with bulk water were made by Jenkinson and Biddanda (1995) in the North Sea during a bloom of Phaeocystis sp. and Noctiluca scintillans at three stations. The weather was calm and the sea glassy smooth. Rheological measurements were made in a classical low-shear rheometer using a Couette (bob-in-cup) measuring system with the cup rotating back and forth sinusoidally. The mean excess complex (i.e., viscoelastic) modulus was 7 times as high in the SML as in the bulk samples, and the ratio of the elastic modulus to the excess viscous modulus was 52 times as high in the SML as in the bulk samples. Only three SML samples were taken, however, and the dif-ferences between the SML and bulk water were not statis-tically significant.
Zhang et al. (2003a), using capillary flow in an Ubbelohde viscometer, measured viscosity in water from the SML and from underlying water off Jiaozhou Bay, China, in September 2001. Viscosity and DOC values were consistently higher in the SML than in the underlying water, and viscosity in both the SML and the underlying water showed a daily cycle, with highest values between
12h00 and 15h00. DOC values in the SML also showed highest values around this time of day, but any cycle of DOC in the underlying water was less clear.
3.3.8. 3D shear rheology from underlying ocean water Bulk-phase 3D rheological properties have been measured as a function of phytoplankton taxon. Viscosity and elas-ticity were measured using Couette geometry (Figure 7,
left-hand side) at low shear rates (<1 s–1). During meas-urements, the Couette system was protected from air cur-rents by two Plexiglas boxes, one inside the other. Meas-urements were made of cultures of Prorocentrum micans,
Protoperidinium trochoideum, Gonyaulax sp., Amphidinium
sp., Dunaliella marina, Dunaliella sp., and a mixed culture of Noctiluca scintillans and D. marina (Jenkinson, 1986a), and in a culture of Karenia mikimotoi (as Gyrodinium cf.
aureolum) and a net-sample from a bloom of N. scintillans
(Jenkinson, 1993a).
Some species of phytoplankton gave their cultures elas-ticity and a mostly shear-thinning viscosity in excess of the non-Newtonian viscosity of their culture media. Other spe-cies, however, showed no measurable effect. Viscosity η was increased up to 400 times that of the culture medium at a shear rate γ⋅ of 0.002 s–1, which would be typical of the shear rate in much of the ocean below the surface-mixed layer. These results indicate that many species of phyto-plankton are able to control the physical properties of the water in which they live, presumably under genetic con-trol and subject to Darwinian-type evolution (Jenkinson and Wyatt, 1995; Wyatt and Ribera d’Alcalà, 2006).
Markedly increased viscosity and even gelling (produc-tion of infinite viscosity η at low enough deforma(produc-tion stress τ) has been measured using ichthyoviscometry (flow through gills of dead fish) in cultures of Karenia
mikimo-toi (Jenkinson and Arzul, 1998, 2002) and Chattonella
spp. (Jenkinson et al., 2007). Viscosity and elasticity have also been measured in oligotrophic Mediterranean water and in a P. globosa-dominated bloom in the North Sea (Jenkinson, 1993b; Jenkinson and Biddanda, 1995).
Viscosity measurements in blooms of Phaeocystis
glo-bosa showed that values of viscosity varied dramatically, in
both absolute values and a shift from positive to negative correlation with chlorophyll a at a small scale (centime-tre to decime(centime-tre), as functions of the increase and decline phases of P. globosa blooms (Seuront et al., 2007). The authors ascribed the change in correlation sign to motile flagellates leaving the polymer-rich zones with which they were first associated. Foam only occurred during the decline phase.
Seuront et al. (2010), again using a piston-in-cylinder viscometer at sea, found total viscosity η in the Southern Ocean to be increased biologically by up to 85% in subsur-face waters, where the increase was associated with bacte-rial abundance, and up to 78% in the deep chlorophyll maximum, where it was associated with specific phyto-plankton taxa.
In freshwater phytoplankton cultures of Scenedesmus,
Chlorococcum, Porophyridium and Spirulina,
viscos-ity measured by falling ball or rolling ball was in many cases found markedly increased (relative to uninoculated