HAL Id: hal-00298835
https://hal.archives-ouvertes.fr/hal-00298835
Submitted on 30 May 2007HAL is a multi-disciplinary open access
archive for the deposit and dissemination of sci-entific research documents, whether they are pub-lished or not. The documents may come from teaching and research institutions in France or abroad, or from public or private research centers.
L’archive ouverte pluridisciplinaire HAL, est destinée au dépôt et à la diffusion de documents scientifiques de niveau recherche, publiés ou non, émanant des établissements d’enseignement et de recherche français ou étrangers, des laboratoires publics ou privés.
Temporal stability of soil moisture spatial variability at
two scales and its implication for optimal field
monitoring
X. Zhou, H. Lin, Q. Zhu
To cite this version:
X. Zhou, H. Lin, Q. Zhu. Temporal stability of soil moisture spatial variability at two scales and its implication for optimal field monitoring. Hydrology and Earth System Sciences Discussions, European Geosciences Union, 2007, 4 (3), pp.1185-1214. �hal-00298835�
HESSD
4, 1185–1214, 2007
Temporal stability of soil moisture spatial
variability X. Zhou et al. Title Page Abstract Introduction Conclusions References Tables Figures ◭ ◮ ◭ ◮ Back Close
Full Screen / Esc
Printer-friendly Version Interactive Discussion
EGU
Hydrol. Earth Syst. Sci. Discuss., 4, 1185–1214, 2007 www.hydrol-earth-syst-sci-discuss.net/4/1185/2007/ © Author(s) 2007. This work is licensed
under a Creative Commons License.
Hydrology and Earth System Sciences Discussions
Papers published in Hydrology and Earth System Sciences Discussions are under open-access review for the journal Hydrology and Earth System Sciences
Temporal stability of soil moisture spatial
variability at two scales and its
implication for optimal field monitoring
X. Zhou, H. Lin, and Q. Zhu
Department of Crop and Soil Sciences, The Pennsylvania State University, University Park, PA 16802, USA
Received: 3 May 2007 – Accepted: 10 May 2007 – Published: 30 May 2007 Correspondence to: X. Zhou ([email protected])
HESSD
4, 1185–1214, 2007
Temporal stability of soil moisture spatial
variability X. Zhou et al. Title Page Abstract Introduction Conclusions References Tables Figures ◭ ◮ ◭ ◮ Back Close
Full Screen / Esc
Printer-friendly Version Interactive Discussion
EGU
Abstract
Soil moisture spatial distribution is a key component in characterizing and modeling water movement at multiple scales. The temporal stability of soil moisture spatial dis-tribution at multiple depths was investigated at the 7.9-ha Shale Hills Catchment in central Pennsylvania with a year-round monitoring of 77 sites distributed across the
5
catchment. For this catchment with heterogeneous soils and landforms, integration of soils information into the temporal stability assessment provided a more accurate loca-tion of representative monitoring sites for capturing mean soil moisture. The temporal stability pattern of soil moisture at the swale scale was similar to that at the catch-ment scale, suggesting that the swale could be used as a representative unit in the
10
catchment study in terms of mean soil moisture dynamics. The temporal stability of soil moisture variability in this catchment varied over space and seasons. Temporally stable sites were found in the northwestern and southeastern parts of the catchment, while the areas near the stream and some swale areas had lower temporal stability. The spatial distribution of soil moisture was more stable over time during wet seasons,
15
but less stable during transitional periods (i.e. drying or recharging periods). The tem-poral stability concept helps the optimal design of field monitoring sites and sampling strategies. On the other hand, the temporally unstable sites provide insights regarding the hydrological processes behind the spatial variability of soil moisture.
1 Introduction
20
Soil moisture spatial distribution is a key component to characterize and model soil water movement and the associated nutrient transport at the catchment scale. Soil moisture often shows a high spatial variation among different landscapes, soil types and vegetations, yet the general pattern of spatial variability in soil moisture is much more stable over time than would be expected from random processes (Vachaud et al.,
25
HESSD
4, 1185–1214, 2007
Temporal stability of soil moisture spatial
variability X. Zhou et al. Title Page Abstract Introduction Conclusions References Tables Figures ◭ ◮ ◭ ◮ Back Close
Full Screen / Esc
Printer-friendly Version Interactive Discussion
EGU
al., 2001). For example, the observations of soil moisture content at some locations are consistently higher than, equal to, or lower than the mean soil moisture content over an entire study area. Such persistent association between spatial location and soil moisture over time has been explored within the context of temporal stability con-cept, initially proposed by Vachaud et al. (1985). Temporal stability suggests that the
5
areal mean soil moisture estimates could be determined from few point measurements of time-stable sites. In precision farm management, an accurate estimation of field mean soil moisture content is the key to guide irrigation activities. Correct definition of antecedent mean soil moisture condition is also critical to simulate and predict the soil moisture dynamics responding to the rainfall inputs in hydrological modeling. The
10
temporal stability of soil water spatial pattern has been investigated to select represen-tative monitoring sites with the aim to optimize or minimize the number of monitoring sites needed in a study area (Grayson and Western, 1998; Cosh et al., 2004; Martinez-Fernandez and Ceballos, 2005).
Soil moisture content is closely related to soil properties and topography, e.g. clay
15
soils often have higher moisture content than sandy soils, and hilltop soils are usually drier than valley floor soils. While the temporal stability of spatial variation in soil mois-ture status depends on hydrologic processes (Kachanoski and de Jong, 1988; Grayson and Western, 1998), particularly lateral flow, the spatial distributions of soil types and landforms are among the first controls of soil moisture dynamics and landscape
hy-20
drologic processes (Chappell and Ternan, 1992; Lin, 2006). The desirable time-stable locations have been found to be related to soil texture and other soil properties, such as soil particle size and soil retention properties (Vachaud et al., 1985; Jacobs et al., 2004; Starr, 2005). Due to the high cost and time-consuming of long-term soil moisture monitoring at the catchment scale, it is rare, if not impossible, that the monitoring sites
25
are uniformly distributed to cover the entire study region. Instead, the design of moni-toring sites is usually irregular or located in selected transects (Famiglietti et al., 1998; Gomez-Plaza et al., 2000; Martinez-Fernandez and Ceballos, 2005; Starr, 2005; Lin, 2006). However, the arithmetic mean of all the monitoring sites is generally adopted to
HESSD
4, 1185–1214, 2007
Temporal stability of soil moisture spatial
variability X. Zhou et al. Title Page Abstract Introduction Conclusions References Tables Figures ◭ ◮ ◭ ◮ Back Close
Full Screen / Esc
Printer-friendly Version Interactive Discussion
EGU
represent the mean field soil moisture for monitoring sites selection in terms of tempo-ral stability concept. Consequently, the selected monitoring site(s) may not represent the true mean soil moisture content in an area without grid samplings particularly with heterogeneous soil constitutions and complex topography.
In previous applications of temporal stability to identify representative mean soil
5
moisture monitoring sites, most of the studies were based on the soil moisture dis-tribution (Cosh et al., 2004) or water storage (Kachanoski and de Jong, 1988; Grayson and Western, 1998) over certain depths. The mean catchment soil moisture content at multiple depths is important to understand and model the surface and subsurface wa-ter flow dynamics (Martinez-Fernandez and Ceballos, 2005; Pachepsky et al., 2005).
10
Such mean soil moisture contents at different soil depths, however, may not be repre-sented by the same sets of representative monitoring sites (Tallon and Si, 2003; Lin, 2006), which makes it less feasible for the monitoring site selection based on the tem-poral stability concept. The representative sites are likely not even adjacent in terms of spatial location (Tallon and Si, 2003). An alternative way to locate a set of
rep-15
resentative monitoring sites, which can be used to represent the mean soil moisture condition at various depths, would be desirable for monitoring sites selection based on the temporal stability concept.
The objective of this study was to investigate the soil moisture spatial distribution at two spatial scales – the catchment and the swale scales – and to use soil-landscape
20
features to enhance of the use of the temporal stability concept for locating represen-tative soil moisture monitoring sites
2 Materials and methods
2.1 The Shale Hills Catchment
The study area was the 7.9-ha Shale Hills Catchment in central Pennsylvania.
Ele-25
HESSD
4, 1185–1214, 2007
Temporal stability of soil moisture spatial
variability X. Zhou et al. Title Page Abstract Introduction Conclusions References Tables Figures ◭ ◮ ◭ ◮ Back Close
Full Screen / Esc
Printer-friendly Version Interactive Discussion
EGU
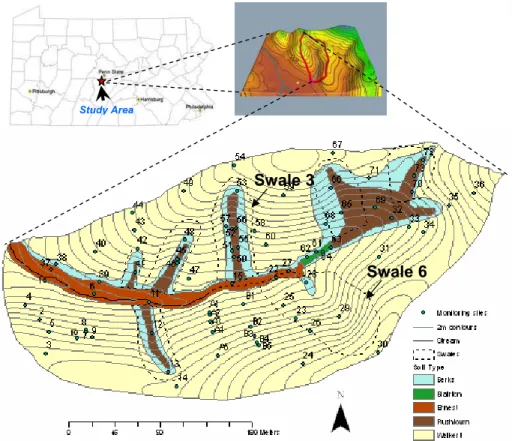
The catchment has steep slopes (up to 25%–40%) and narrow ridges. Four basic landforms has been recognized: 1) south-facing slope with deciduous forest and un-derbrush, 2) north-facing slope with deciduous forest and thicker unun-derbrush, 3) valley floor or floodplain of a first-order headwater stream with evergreen trees along the western side and deciduous forest on the eastern side, and 4) topographic depression
5
areas (swales) with deciduous forest cover and deeper soils. Seven distinct swales located on the both sides of the valley were mapped using a Trimble Pro XR Global Positioning System (GPS) (Fig. 1). The underlying bedrock in the catchment is com-posed of Rose Hill shale with more than 200 m thick (Berg et al., 1980). The soil depth varies from very shallow (<0.25 m) on the ridge tops and upper side slopes to very
10
deep (>2–3 m) in the valley floor and swales.
The soils of the Shale Hills Catchment were originated from shale colluvium or residuum, with channery shale fragments (2–150 mm) throughout most soil profiles. Soils on the hillslopes are characterized by silt loam texture, moderately developed soil structure, and high permeability (Lin et al., 2006). A detailed Order I soil survey
15
was conducted at the catchment using standard grid-transect method (Soil Survey Di-vision Staff, 1993). The soil boundaries were further refined by additional augering and Ground Penetrating Radar investigations (Lin et al., 2006). A total of five soil se-ries, namely Berks (loamy-skeletal, mixed, active, mesic Typic Dystrudepts), Blairton ( fine-loamy, mixed, active, mesic Aquic Hapludults), Ernest (fine-loamy, mixed,
su-20
peractive, mesicAquic Fragiudults), Rushtown (loamy-skeletal over fragmental, mixed, mesic Typic Dystrochrepts), and Weikert (loamy-skeletal, mixed, active, mesic lithic Dystrudepts), were identified and mapped, as shown in Fig. 1 (Lin et al., 2006).
Based on the detailed mapping of landforms and soils in the catchment, 77 sites were selected throughout the catchment to monitor soil moisture at multiple depths (0.1,
25
0.2, 0.4, 0.6, 0.8, and 1 m or until the maximum soil depth). These 77 sites covered four landform units (hilltop, hillslope, swale, and valley floor) and all soil types in the catchment (Fig. 1). Soil moisture content was measured approximately weekly from 23 September 2004 to 30 October 2005 using the Time Domain Reflectometry (TDR).
HESSD
4, 1185–1214, 2007
Temporal stability of soil moisture spatial
variability X. Zhou et al. Title Page Abstract Introduction Conclusions References Tables Figures ◭ ◮ ◭ ◮ Back Close
Full Screen / Esc
Printer-friendly Version Interactive Discussion
EGU
No data were collected from mid-December 2004 to mid-February 2005 because of snow cover and frozen soils. We used the T3 TDR probe and the TRIME-FM3 mobile meter (IMKO, Germany) to collect volumetric soil moisture content at the desired depths inside a 0.051-m diameter Schedule 40 PVC access tube at each of the monitoring sites. Two sets of readings were taken with the probe rotated 90 ˚ and the
5
average was used to represent the soil moisture content at that depth. Further details of our soil moisture data collection can be found in Lin (2006).
2.2 Temporal stability analysis
The relative difference of soil moisture content was used to investigate the spatial vari-ability of soil water status over time (Vachaud et al., 1985). The mean relative difference
10
(
−
δi) over time at site i during the monitoring period at a given depth is defined as
− δi = 1 m m X j =1 θi j − − θj − θj (1)
where θi j is the measured soil moisture content at that depth for site i on day j ; m is the number of sampling days;
−
θj is the mean soil moisture content among all the sampling sites within the study area on day j , which is calculated as
15 − θj = 1 N N X i =1 θi j (2)
where N is the total number of sampling sites at a specified soil depth in the catchment. The mean relative difference
−
δi and its temporal standard deviation σ(δi j) have been used to select potential monitoring sites (Grayson and Western, 1998; Mohanty and Skaggs, 2001). The value of
−
δi indicate the soil moisture status of a given site as
HESSD
4, 1185–1214, 2007
Temporal stability of soil moisture spatial
variability X. Zhou et al. Title Page Abstract Introduction Conclusions References Tables Figures ◭ ◮ ◭ ◮ Back Close
Full Screen / Esc
Printer-friendly Version Interactive Discussion
EGU
compared to the mean soil moisture of the entire study region. A wetter site possesses a positive
−
δi, and a drier site possesses a negative value. The value of σ(δi j) is an indicator of temporal stability of soil moisture at a site in comparison to the overall mean of the entire study area. A small standard deviation close to zero indicates a high temporal stability. Sites with
−
δi≈0 and small σ(δi j) are desirable, if the monitoring
5
purpose is to determine the mean soil water status in a study region, although other sites with small value of σ(δi j) can also be used. It should be noted that those sites may not be the optimal sites for other monitoring purposes, e.g. the sites with lower temporal stability may be the hotspots if the underlying hydrologic processes is the focus of a study.
10
Based on the definition of temporal stability, the soil moisture of a time-stable site at a given day could be deduced if the value of
−
δi between the sites and the catchment mean soil moisture are known (Grayson and Western, 1998). For two temporal stable sites, i and k, soil moisture content at site k on day j (θkj) can be estimated from the site i on the same day j (θi j), which may be regularly monitored:
15 θkj≈δk + 1 δi + 1 θi j (3) where − δi and −
δk are the mean relative difference for site i and k at a given soil depth,
respectively.
The temporal stability of soil moisture spatial variability was evaluated at two scales in this study – the catchment and the swale scales to compare the temporal stability
20
pattern at these two spatial scales. At the catchment scale, the mean soil moisture content on each monitoring day was obtained by averaging the values over all the monitoring sites and used in the relative difference calculation. At the swale scale, only the monitoring sites located within the selected swale were used for temporal stability analysis. The swale #3 (Fig. 1) was chosen in this study because of its typical V shape
HESSD
4, 1185–1214, 2007
Temporal stability of soil moisture spatial
variability X. Zhou et al. Title Page Abstract Introduction Conclusions References Tables Figures ◭ ◮ ◭ ◮ Back Close
Full Screen / Esc
Printer-friendly Version Interactive Discussion
EGU
and relatively large number of monitoring sites (a total of 8 sites) within the swale. To better visualize the spatial pattern of temporal stability at the Shale Hills catch-ment, the values of σ(δi j) of all monitored sites were interpolated using the Inverse Distance Weighted (IDW) method to generate the temporal stability maps of the entire catchment. Other spatial interpolation methods (e.g. ordinary kriging, universal kriging,
5
and co-kriging) were tested but the IDW method provided the smoothest map. Because of the shallow soil depth at the hilltops and hillslopes, the interpolated maps of tempo-ral stability were created only for 10-, 20-, and 40-cm soil depths, while only the point values were displayed for the 60- and 80-cm depths without IDW interpolation due to reduced number of points (Fig. 2).
10
3 Results and discussion
3.1 Temporal stability distribution across the catchment
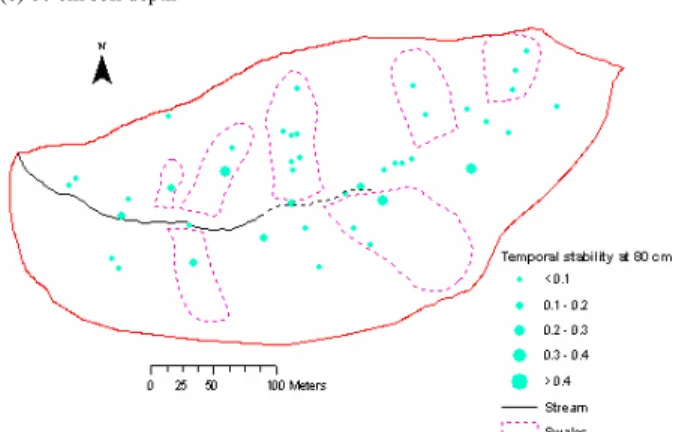
The temporal stability maps at different depths showed that the northwestern and southeastern areas of the catchment had higher temporal stability (i.e. smaller σ(δi j)), while the locations near the stream and some swale areas had lower temporal
stabil-15
ity (i.e. larger σ(δi j)). The area where the stream starts showed the lowest temporal stability throughout the soil profile within the whole catchment (Fig. 2). The nearby swale #6 (Fig. 1) has large contribution area and shallow soil depth, which appears to have quick response to rainfall inputs and likely supply source water to the beginning of the stream. Consequently, the area where the stream starts showed high hydrologic
20
dynamics and thus low temporal stability of soil moisture. The intermittent portion of the stream area (along the broken line in Fig. 1) also showed a lower temporal stabil-ity because of the higher fluctuation of soil moisture over time. Unlike other hillslope sites, the site 13 at the north-facing hillslope had low temporal stability at 40- and 60-cm depths due to its locally flat topography (Fig. 1). Perched water table has been
25
topog-HESSD
4, 1185–1214, 2007
Temporal stability of soil moisture spatial
variability X. Zhou et al. Title Page Abstract Introduction Conclusions References Tables Figures ◭ ◮ ◭ ◮ Back Close
Full Screen / Esc
Printer-friendly Version Interactive Discussion
EGU
raphy was also observed by Mohanty and Skaggs (2001). The other less stable area was located near the stream outlet (Fig. 2). The northwestern and southeastern areas of the catchment had higher temporal stability regardless of the soil depth (Fig. 2). 3.2 Temporal stability at two spatial scales
The concept of temporal stability and plots of relative difference were used to
character-5
ize the spatial variability of soil moisture over time at two spatial scales: the catchment and the swale scales. The geometry of a catchment can be regarded as a self-similar object. A swale, for example, when enlarged could resemble the larger catchment. Therefore, swales may provide a meaningful physical base in the temporal analysis of catchment hydrology.
10
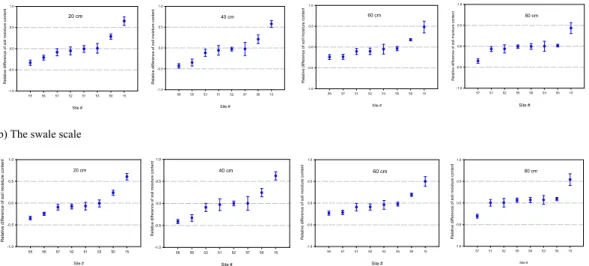
The pattern of relative differences plots (mean ± standard deviation) at different soil depths at the swale scale, as exemplified by the swale #3 in this study, showed similarity to that at the catchment scale (Fig. 3). The temporal stability at each site represented by the standard deviation is almost the same at both scales. Since the temporal stability is an indicator of the temporal variation of relative difference, which is determined by
15
the mean soil moisture content, it suggests that the average soil water status of the entire catchment could be estimated from the swale scale.
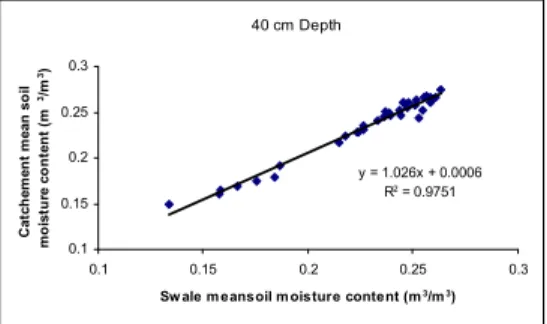
The mean volumetric soil moisture content estimated from 77 sites (the catchment scale) corresponding to each sampling day was plotted against the mean volumetric soil moisture content of the 8 sites within the swale #3 (the swale scale). A very good
20
linear regression was established for each soil depth (Fig. 4), with R2 ranging from 0.96 to 0.99. Overall, the estimates of mean soil moisture content from the swale were about 90% to 100% of the catchment mean, with the best estimate at the 40-cm depth (Fig. 4). The deviation from a 1:1 relationship between the swale and the catchment scales is probably due to the proportions of sites representing various soil types and
25
topographic locations being different at each of the two scales. The Berks soil, for example, has 14.3% (11/77) of sites at the catchment scale, but 50% (4/8) of sites at the swale scale.
HESSD
4, 1185–1214, 2007
Temporal stability of soil moisture spatial
variability X. Zhou et al. Title Page Abstract Introduction Conclusions References Tables Figures ◭ ◮ ◭ ◮ Back Close
Full Screen / Esc
Printer-friendly Version Interactive Discussion
EGU
More importantly, such relationship between the swale and catchment mean soil moisture contents persists at each soil depth. As a result, a few sites covering the basic topographic and soil variation within a swale could be used to represent the mean soil moisture condition for the whole catchment at multiple depths (which are often best represented by different sites, as shown in Fig. 5). This may circumvent the challenge
5
of more representative sites needed for multiple depths monitoring. 3.3 Role of soil distribution in temporal stability analysis
Soil moisture content varies among different soil types and landforms (Lin, 2006; Lin et al., 2006). The mean soil moisture content of the Ernest soil series at 10 cm during the entire monitoring period was 0.32 m3/m3, while the mean soil moisture at the same
10
depth was only 0.19 m3/m3for the Weikert soil series. With the detailed soil map, we were able to determine the area of each soil series. Approximately 5.3% of the catch-ment was mapped as the Ernest soil series, and 77.9% as the Weikert. The proportion of monitoring sites representing these two soil series, however, was 10.4% and 53.2%, respectively. Hence, the selection of average soil moisture monitoring sites using
tem-15
poral stability concept based on simple arithmetic average may not truly represent the mean soil moisture condition in the study area, which have been widely adopted in other studies (Vachaud, 1985; Grayson and Western, 1998). In a catchment with het-erogeneous soil distribution and high spatial variation of landforms, it is necessary to integrate soil and topographic information into the temporal stability assessment. Since
20
the delineation of the soil series in this catchment is closely related to topography (Lin et al., 2006), only the soil spatial variation (as portrayed by soil map) was taken into account in the temporal stability assessment for this study.
The area-weighted mean soil moisture content on each sampling day was obtained by first calculating the arithmetic mean for each soil series, and then area-weighting the
25
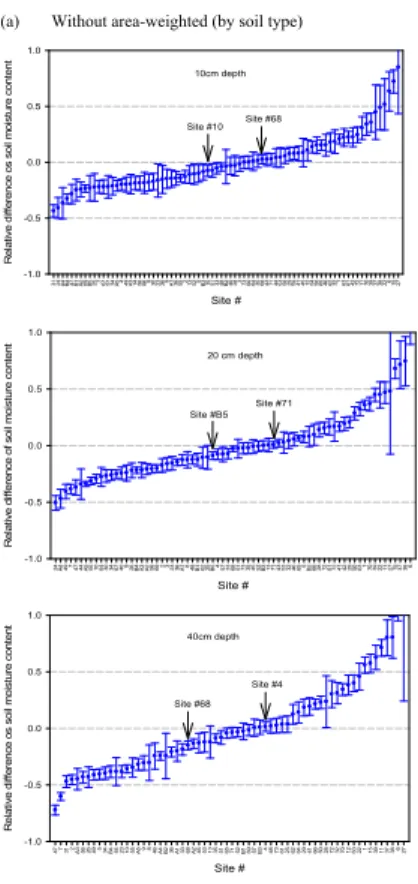
mean by the proportion of each soil series’ area in the catchment. The representative monitoring sites based on such area-weighted mean were different from the sites using the simple arithmetic mean (Fig. 5). For soil depth at 10-cm, for example, the
repre-HESSD
4, 1185–1214, 2007
Temporal stability of soil moisture spatial
variability X. Zhou et al. Title Page Abstract Introduction Conclusions References Tables Figures ◭ ◮ ◭ ◮ Back Close
Full Screen / Esc
Printer-friendly Version Interactive Discussion
EGU
sentative monitoring site with small mean relative difference and high temporal stability was site #68 when using the classical formula without area-weighted (Eq. 2), but site #10 was clearly the choice when area-weighted by soil types (Fig. 5). Similarly, sites #71 and #B5 was the most representative mean soil moisture site at 20-cm depth for the non-weighted and weighted approach, respectively; and sites #4 and #68 at 40-cm
5
depth. Since the soil depth of dominant Weikert series is generally less than 50 cm, the area-weighted mean soil moisture content was not calculated for 60- and 80-cm depths in this study.
3.4 Influence of wet-dry transition period on temporal stability
The soil moisture content of a given depth at the Shale Hills Catchment has the
fol-10
lowing general decreasing trend among different soil series and landforms: Ernest ≥ Blairton > Rushtown > Berks ≥ Weikert, and Valley floor > Swale > Hillslope > Hilltop (Lin, 2006; Lin et al., 2006). This is illustrated in Fig. 6. The changes of soil moisture over depths were a function of time and soil types, and hence did not show a clear trend (Lin, 2006). As shown in Fig. 6, soil moisture content at 80-cm generally was
15
greater than that at 20-cm depth, but the site #57 had the opposite trend.
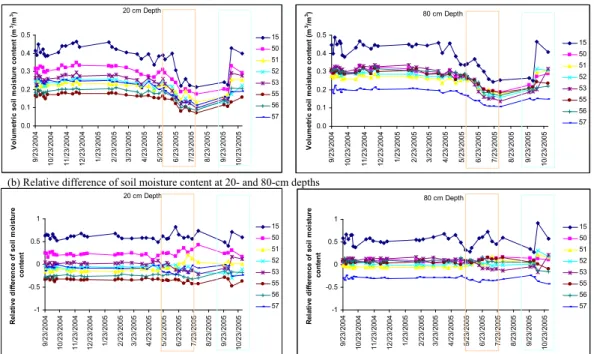
The soil moisture content and relative difference of the sites within the swale #3 were plotted over the entire monitoring period (Fig. 6). During this period, soils were wet during the winter and early spring, then dried down staring from April, and wetted up again in September. The spatial variation of soil moisture during the wet periods
20
was higher than dry periods (Fig. 6), probably due to lateral redistribution (Lin, 2006). During the fall and winter seasons, there was little variation of relative difference of soil moisture over time, indicating a high persistence of soil moisture spatial distribution. In this period, soils maintained a wet condition and soil moisture content showed little change over time, even though the topographic redistribution of soil moisture might still
25
exist. During soil moisture transition periods (i.e. dry down or recharge), the temporal stability was low (Fig. 6). This disruption of temporal stability of soil moisture spatial pattern during recharge periods may be caused by some hydrological processes,
par-HESSD
4, 1185–1214, 2007
Temporal stability of soil moisture spatial
variability X. Zhou et al. Title Page Abstract Introduction Conclusions References Tables Figures ◭ ◮ ◭ ◮ Back Close
Full Screen / Esc
Printer-friendly Version Interactive Discussion
EGU
ticularly lateral redistribution of soil moisture (Martinez-Fernandez and Ceballos, 2003; Lin, 2006). Kachanoski and de Jong (1988) examined the temporal persistence of soil water storage for drying and recharge events, and concluded that spatial variability in soil water was induced during recharge but not drying. In our study, however, the tem-poral stability was low during both dry down and recharge periods (Fig. 6). During the
5
drying periods, the process of uneven evapotranspiration and root water uptake may be the major controls on the soil moisture spatial distribution, even though little lateral redistribution might be involved. This was particularly the case at near-surface soil lay-ers (Fig. 6). Such dynamic process also contributes to the overall variability of spatial distribution of soil moisture over time.
10
The temporal stability not only changed over seasons or overall moisture status of the study area, but also exhibited difference among the sites. The wetter sites tended to have higher variability than the drier sites. As shown in Fig. 6, site #15 and #50 had higher moisture content but less stable than the other sites within the swale #3, even during winter season. These two sites were located at or near the valley floor, and
15
hence had higher clay content and water-holding capacity. Mohanty and Skaggs (2001) found that fields with silt loam soils had poor temporal stability than those containing sandy loam soils. Furthermore, our results showed that the spatial distribution of soil moisture were more stable at 80-cm depth than at 20-cm depth (Fig. 6).
Among the 77 monitoring sites, stable and unstable sites displayed different temporal
20
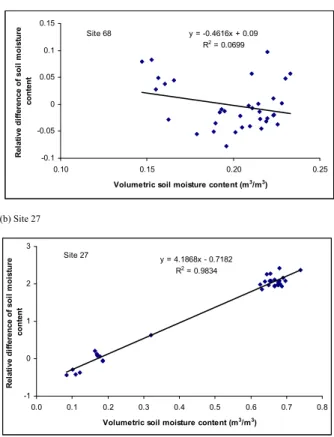
stability patterns. For time-stable sites, site #68 for example, the relative difference is not sensitive to the soil moisture content and the variation is small (Fig. 7). For time-unstable sites, the variation of relative difference is high and shows some trend with soil moisture content. For instance, the relative difference showed a positive linear relationship with the soil moisture content at site #27 (Fig. 7). This often occurs for the
25
HESSD
4, 1185–1214, 2007
Temporal stability of soil moisture spatial
variability X. Zhou et al. Title Page Abstract Introduction Conclusions References Tables Figures ◭ ◮ ◭ ◮ Back Close
Full Screen / Esc
Printer-friendly Version Interactive Discussion
EGU
3.5 Implication of temporal stability for optimal field monitoring
In the application of temporal stability concept, the time-stable sites have been the focus of many past studies while the less-stable sites were often ignored (Vachaud et al., 1985; Kachanoski and de Jong, 1988; Grayson and Western, 1998). Those time-stable sites provide potential monitoring locations to represent mean soil moisture for
5
the entire area of interest. In many situations, however, we monitor soil moisture at various locations and depths to understand and model water flow dynamics and flow pathways at the hillslope or catchment scales, rather than the mean catchment soil moisture condition. With this in mind, those sites with low temporal stability may be more of interest than the stable sites.
10
Soil moisture content of a time-stable site can be estimated from another stable site using Eq. (3). For example, soil moisture contents at site #33 were estimated from the measurements at site #68, and plotted against the measured values at 10-, 20-, and 40-cm depths (Fig. 8). The estimated values match the measured values quite well for site #33 (Fig. 8) and many other sites in the catchment with high temporal stability
15
(Fig. 2). This suggests that we might not need to monitor all the time-stable sites since their soil moisture could be derived from other time-stable sites with accepted accuracy. In our study catchment, most of the stable sites are located at the shallow Weikert and Berks soils (Figs. 1 and 2). Although these two soil types occupy more than 80% of the area at this catchment, only a small number of sites may be sufficient to capture
20
representative soil moisture in these two soils. The reduction of total monitoring sites without significant loss of information would benefit the long-term field monitoring at larger scales, which often requires a large number of monitoring sites throughout the region that are costly and challenging to remain (Cosh et al., 2004).
On the other hand, the soil moisture contents at the sites with low temporal stability
25
can not be accurately estimated from the stable sites, as illustrated for site #38 (Fig. 9). Those temporally unstable sites may provide more insights on the hydrologic processes behind the spatial variability of soil moisture. For example, lateral flow and redistribution
HESSD
4, 1185–1214, 2007
Temporal stability of soil moisture spatial
variability X. Zhou et al. Title Page Abstract Introduction Conclusions References Tables Figures ◭ ◮ ◭ ◮ Back Close
Full Screen / Esc
Printer-friendly Version Interactive Discussion
EGU
is believed to be a major process responsible for the temporal instability of soil moisture spatial pattern at the catchment scale (Kachanoski and de Jong, 1988; Grayson and Western, 1998; Lin, 2006).
The temporal stability of soil moisture may also be used to guide the data collection schedule. Our results showed that the pattern of soil moisture spatial distribution varied
5
over seasons. Temporal stability was relative high during the fall and winter seasons in this catchment. This would be useful for guiding our field sampling strategies. During wet seasons, we may not need to do data collection as frequently as during the dry seasons if monitoring field mean soil moisture dynamics is the main purpose.
4 Summary and conclusion
10
The temporal stability distribution maps at different soil depths revealed that the Shale Hills catchment has more temporally stable sites in the northwestern and southeastern parts of the catchment where shallow Weikert soil dominants, while the areas near the stream and some swale areas have lower temporal stability. Areas in valley floor showed low temporal stability because of the fluctuation of water table, particularly in
15
areas with the intermittent portion of the stream. The temporal stability of the monitor-ing sites also varied over seasons. The spatial distribution of soil moisture was rather persistent over time during wet seasons, but less persistent during transitional periods, including drying and recharging periods.
The spatial pattern of soil moisture distribution at multiple depths at the Shale Hills
20
showed that the temporal stability of soil moisture spatial pattern at the swale scale was quite similar to that at the catchment scale, suggesting that the swales may be viewed as a miniature of the whole catchment in terms of mean soil moisture dynamics. Excellent linear relationships were established between the swale and the catchment scale mean soil moisture contents.
25
For a catchment with heterogeneous soils and landforms, integration of soils infor-mation into the temporal stability assessment provided a more accurate location of
HESSD
4, 1185–1214, 2007
Temporal stability of soil moisture spatial
variability X. Zhou et al. Title Page Abstract Introduction Conclusions References Tables Figures ◭ ◮ ◭ ◮ Back Close
Full Screen / Esc
Printer-friendly Version Interactive Discussion
EGU
representative monitoring sites for capturing mean soil moisture of the whole catch-ment. Area-weighted mean soil moisture of each soil series can be used to obtain the catchment mean soil moisture content of each sampling day rather than the classical arithmetic mean. We have identified representative monitoring sites for catchment-wide mean soil moisture using this approach.
5
The behavior of temporally unstable sites have often been overlooked in temporal stability analysis in many previous studies, giving the focus on capturing mean soil moisture of a study area. However, temporally unstable sites provide important in-sights regarding hydrological processes behind the spatial variability of soil moisture, e.g. subsurface lateral flow, evaportranspiration, and perched water table dynamics.
10
Appropriate use of temporal stability concept can benefit optimal design for field mon-itoring, but must be used with a clear purpose in mind. For example, soil moisture of time-stable sites could be estimated from other stable sites, and thus can reduce the number of monitoring sites needed in a large area.
References
15
Berg, T. M., Geyer, A. R., Edmunds, W. E., et al.: Geological map of Pennsylvania. Pennsylva-nia Geological Survey, 4th ser., Map 1. Harrisburg, PA, 1980.
Chappell, N. A. and Ternan, J. L.: Flow path dimensionality and hydrological modeling, Hydrol. Proc., 6, 327–345, 1992.
Cosh, M. H., Jackson, T. J., Bindlish, R., and Prueger, J. H.: Watershed scale temporal and 20
spatial stability of soil moisture and its role in validating satellite estimates, Rem. Sens. Env., 92, 427–435, 2004.
Famiglietti, J. S., Rudnicki, J. W., and Rodell, M.: Variability in surface moisture content along a hillslope transect: Rattlesnake Hill, Texas, J. Hydrol., 210, 259–281, 1998.
Gomez-Plaza, A., Alvarez-Rogel, J., Albaladejo, J., and Castillo, V. M.: Spatial patterns and 25
temporal stability of soil moisture across a range of scales in a semi-arid environment, Hy-drol. Proc., 14, 1261–1277, 2000.
HESSD
4, 1185–1214, 2007
Temporal stability of soil moisture spatial
variability X. Zhou et al. Title Page Abstract Introduction Conclusions References Tables Figures ◭ ◮ ◭ ◮ Back Close
Full Screen / Esc
Printer-friendly Version Interactive Discussion
EGU
nitrogen and selected soil properties, Soil Science Society of American Journal, 57, 372– 381, 1993.
Grayson, R. B. and Western, A. W.: Towards areal estimation of soil water content from point measurements: time and space stability of mean response, J. Hydrol., 207, 68–82, 1998. Jacobs, J. M., Mohanty, B. P., Hsu, E. C., and Miller, D.: SMEX02: Field scale variability, time 5
stability and similarity of soil moisture, Rem. Sens. Env., 92, 436–446, 2004.
Kachanoshi, R. G. and de Jong, E.: Scale dependence and the temporal persistence of spatial patterns of soil water storage, Water Resour. Res., 24, 85–91, 1988.
Lin, H., Kogelmann, W., Walker, C., and Bruns, M. A.: Soil moisture patterns in a forested catchment: A hydropedological perspective, Geoderma, 131, 345–368, 2006.
10
Lin, H.: Temporal stability of soil moisture spatial pattern and subsurface preferential flow path-ways in the Shale Hills catchment, Vadose Zone Journal, 5, 317–340, 2006.
Mohanty, B. P. and Skaggs, T. H.: Spatio-temporal evolution and time-stable characteristics of soil moisture within remote sensing footprints with varying soil, slope, and vegetation, Adv. Wat. Resour., 24, 1051–1067, 2001.
15
Martinez-Fernandez, J. and Ceballos, A.: Mean soil moisture estimation using temporal stability analysis, J. Hydrol., 312, 28–38, 2005.
Pachepsky, Y. A., Guber, A. K., and Jacques, D.: Temporal persistence in vertical distributions of soil moisture contents, Soil Science Society of American Journal, 69, 347–352, 2005. Pires da Silva, A., Nadler, A., and Kay, B. D.: Factors contributing to temporal stability in spatial 20
patterns of water content in the tillage zone, Soil Tillage Research, 58, 207–218, 2001. Starr, G. C.: Assessing temporal stability and spatial variability of soil water patterns with
im-plications for precision water management, Agricultural Water Management, 72, 223–243, 2005.
Tallon, L. K. and Si, B. C.: Representative soil water benchmarking for environmental monitor-25
ing, Environmental Informatics Archives, 1, 581–590, 2003.
Van Pelt, R. S. and Wierenga, P. J.: Temporal stability of spatial measured soil matric potential probability density function, Soil Science Society of American Journal, 65, 668–677, 2001. Vachaud, G., Passerat de Silans, A., Balabanis, P., and Vauclin, M.: Temporal stability of
spa-tially measured soil water probability density function, Soil Science Society of American Jour-30
HESSD
4, 1185–1214, 2007
Temporal stability of soil moisture spatial
variability X. Zhou et al. Title Page Abstract Introduction Conclusions References Tables Figures ◭ ◮ ◭ ◮ Back Close
Full Screen / Esc
Printer-friendly Version Interactive Discussion EGU Swale 3 Swale 6 Study Area
Fig. 1. The study catchment in central Pennsylvania and the distribution of soil types, swales, and soil moisture monitoring sites.
HESSD
4, 1185–1214, 2007
Temporal stability of soil moisture spatial
variability X. Zhou et al. Title Page Abstract Introduction Conclusions References Tables Figures ◭ ◮ ◭ ◮ Back Close
Full Screen / Esc
Printer-friendly Version Interactive Discussion
EGU (a) 10 cm soil depth
(b) 20 cm soil depth
Fig. 2.Temporal stability maps of soil moisture content (i.e. distribution of σ(δi j) values) at (a)
10-, (b) 20-, (c) 40-, (d) 60-, and (e) 80-cm depths for the monitoring duration from 23 Septem-ber 2004 to 24 OctoSeptem-ber 2005. The maps at 10-, 20-, and 40-cm depths were interpolated using the inverse distance weighted method. The dash line represents the intermittent portion of the stream.
HESSD
4, 1185–1214, 2007
Temporal stability of soil moisture spatial
variability X. Zhou et al. Title Page Abstract Introduction Conclusions References Tables Figures ◭ ◮ ◭ ◮ Back Close
Full Screen / Esc
Printer-friendly Version Interactive Discussion EGU (c) 40 cm soil depth (d) 60 cm soil depth Fig. 2.Continued.
HESSD
4, 1185–1214, 2007
Temporal stability of soil moisture spatial
variability X. Zhou et al. Title Page Abstract Introduction Conclusions References Tables Figures ◭ ◮ ◭ ◮ Back Close
Full Screen / Esc
Printer-friendly Version Interactive Discussion
EGU (e) 80 cm soil depth
Figure 2
HESSD
4, 1185–1214, 2007
Temporal stability of soil moisture spatial
variability X. Zhou et al. Title Page Abstract Introduction Conclusions References Tables Figures ◭ ◮ ◭ ◮ Back Close
Full Screen / Esc
Printer-friendly Version Interactive Discussion
EGU (a) The catchment scale
20 cm Site # 55 56 57 52 51 53 50 15 -1.0 -0.5 0.0 0.5 1.0 40 cm Site # 56 55 53 51 52 57 50 15 -1.0 -0.5 0.0 0.5 1.0 60 cm Site # 56 57 51 52 53 55 50 15 -1.0 -0.5 0.0 0.5 1.0 80 cm Site # 57 51 52 55 56 53 50 15 -1.0 -0.5 0.0 0.5 1.0 Re la ti ve d if fe re nce o f soi l m o ist u re con te n t R e la ti v e di ff er enc e o f s o il moi s tu re c o n te nt R e la ti v e dif fe re nc e of s o il mois tu re c ont en t Rela ti v e d if fer enc e of s o il m o is tu re c onte n t
(b) The swale scale
20 cm Site # 55 56 57 52 51 53 50 15 -1.0 -0.5 0.0 0.5 1.0 80 cm Site # 57 51 52 55 56 53 50 15 Re la ti ve d iff e re nce o f so il m o ist u re con te n t -1.0 -0.5 0.0 0.5 1.0 40 cm Site # 56 55 53 51 52 57 50 15 -1.0 -0.5 0.0 0.5 1.0 60 cm Site # 56 57 51 52 53 55 50 15 -1.0 -0.5 0.0 0.5 1.0 R e lat iv e dif fe renc e of s o il m o is tu re c ont ent R e lat iv e dif fe renc e of s o il m o is tu re c ont ent R e la ti v e d if fe re n c e of s o il mo is tu re c o nt en t
Fig. 3. Ranked relative deviation from the mean soil moisture content at (a) the catchment scale and (b) the swale scale at 20-, 40-, 60-, and 80-cm depths. The mean relative differences of all sites at each of the two scales were ordered from the lowest to highest, with the error bars representing one standard deviation.
HESSD
4, 1185–1214, 2007
Temporal stability of soil moisture spatial
variability X. Zhou et al. Title Page Abstract Introduction Conclusions References Tables Figures ◭ ◮ ◭ ◮ Back Close
Full Screen / Esc
Printer-friendly Version Interactive Discussion EGU 40 cm Depth y = 1.026x + 0.0006 R2 = 0.9751 0.1 0.15 0.2 0.25 0.3 0.1 0.15 0.2 0.25 0.3
Sw ale m eansoil m oisture content (m3/m3)
C a tc h e m e n t m e a n s o il m o is tu re c o n te n t (m 3/m 3) 60 cm Depth y = 0.8761x + 0.0347 R2 = 0.9616 0.150 0.200 0.250 0.300 0.350 0.15 0.2 0.25 0.3 0.35
Sw ale m ean soil m oisture content (m3/m3)
C a tc h m e n t m e a n s o il m o is tu re c o n te n t (m 3/m 3) 80 cm Depth y = 0.9023x + 0.0428 R2 = 0.9897 0.15 0.2 0.25 0.3 0.35 0.15 0.20 0.25 0.30 0.35
Sw ale m ean soil m oisture content (m3/m3)
C a tc h e m n t m e a n s o il m o is tu re c o n te n t (m 3/m 3) 20 cm Depth y = 0.9038x + 0.014 R2 = 0.9872 0.100 0.150 0.200 0.250 0.300 0.1 0.15 0.2 0.25 0.3
Sw ale m ean soil m oisture content (m3/m3)
C a tc h e m e n t m e a n s o il m o is tu re c o n te n t (m 3/m 3) Figure 4
Fig. 4.Mean volumetric soil moisture content at various depths (20-, 40-. 60-. and 80- cm) in the swale #3 versus the entire catchment.
HESSD
4, 1185–1214, 2007
Temporal stability of soil moisture spatial
variability X. Zhou et al. Title Page Abstract Introduction Conclusions References Tables Figures ◭ ◮ ◭ ◮ Back Close
Full Screen / Esc
Printer-friendly Version Interactive Discussion
EGU
(a) Without area-weighted (by soil type) 1 Site # 31 24 A4 B4 47 B1 A2 69 B5 257 67 57 34 A54 49 A3 14 56 668 30 23 269 A1 36 552 13 525 B3 10 51 33 48 B2 40 283 73 60 64 35 68 43 71 44 53 58 29 59 41 45 12 54 50 65 46 62 321 63 61 42 72 11 70 39 37 38 226 15 27 R e la ti v e d if fe re n c e o s s o il m o is tu re c o n te n t -1.0 -0.5 0.0 0.5 1.0 Site #68 Site #10 10cm depth 2 Site # 24 A4 49747 44A5 551064 3034 6740926 B4 A3 A2 56 69232336 A1848 B1 62 25 B54573368 51 73354552 B3 13 71 43 53 32 46 655B2662812 61 7241 4229 5063170 392211 2715 37386 R e la ti ve d if fe re n c e o f s o il m o is tu re c o n te n t -1.0 -0.5 0.0 0.5 1.0 Site #71 Site #B5 20 cm depth 3 Site # 477312A3562649534B444231055A59846A4B236A13368A24553133551657152B16957B34487361256264294166502872327012632211539113738627 R e la ti v e d if fe re n c e o s so il m o is tu re c o n te n t -1.0 -0.5 0.0 0.5 1.0 Site #4 Site #68 40cm depth 4 5
Fig. 5. Ranked relative deviation from the mean spatial moisture content for the entire catch-ment: (a) without area-weighted and (b) with area-weighted (by soil type) at 10-, 20-, and 40-cm depths. Two sites were identified as the best monitoring sites representing the catchment mean soil moisture at each depth for both cases (with or without area-weighted).
HESSD
4, 1185–1214, 2007 T emporal stability of soil moisture spatial v ariability X. Zhou et al. Title P age Abstr act Introduction Conclusions Ref erences T ab les Figures ◭ ◮ ◭ ◮ Bac k Close Full Screen / Esc Pr inter-fr iendly V ersion Inter activ e Discussion EGU 1 (b) W ith a re a-w ei ght ed (by s oi l t ype ) S ite # 31 24 A4 B4 47 A2 57 69 B1 34 B57 49 A5 67 25 56 66 8 4 A3 14 30 52 A1 55 26 2 369 23 13 5 B3 10 51 33 28 48 73 40 64 B2 60 3 44 35 71 53 43 68 29 45 59 41 58 12 65 54 50 46 32 62 72 42 1 63 61 11 70 39 37 22 386 15 27Relative difference of soil moisture content
-1. 0 -0. 5 0.0 0.5 1.0 Si te #6 8 S ite #10 10c m dep th 2 Si te # 24 A4 497 47 44 A5 55 10 64 30 34 67 40 9 26 B4 A3 A2 56 692 3 23 36 A18 48 B1 62 25 B54 57 33 68 51 73 35 45 52 B3 13 71 43 53 32 46 655 B2 66 28 12 61 41 72 42 29 50 631 70 39 22 11 27 15 37 38 6
Relative difference of soil moisture content
-1. 0 -0. 5 0.0 0.5 1.0 Si te #71 S ite #B 5 20c m de pt h 3 Si te # 47 7 31 2 A3 26 56 49 5 34 44 23 B4 10 55 A59 8 B2 A4 46 36 A1 33 68 13 45 A2 53 51 35 52 65 71 B1 69 4 48 57 61 B3 25 73 62 64 29 41 66 50 28 32 72 70 12 63 221 15 39 11 37 386 27
Relative difference of soil moisture content
-1 .0 -0 .5 0.0 0.5 1.0 Sit e #4 Si te # 6 8 40 c m de pt h 4 5 F igure 5 Fig. 5. Contin ued. 1208
HESSD
4, 1185–1214, 2007
Temporal stability of soil moisture spatial
variability X. Zhou et al. Title Page Abstract Introduction Conclusions References Tables Figures ◭ ◮ ◭ ◮ Back Close
Full Screen / Esc
Printer-friendly Version Interactive Discussion
EGU
(a) Soil moisture content at 20- and 80-cm depths
Figure 6 20 cm Depth 0.0 0.1 0.2 0.3 0.4 0.5 9 /2 3 /2 0 0 4 1 0 /2 3 /2 0 0 4 1 1 /2 3 /2 0 0 4 1 2 /2 3 /2 0 0 4 1 /2 3 /2 0 0 5 2 /2 3 /2 0 0 5 3 /2 3 /2 0 0 5 4 /2 3 /2 0 0 5 5 /2 3 /2 0 0 5 6 /2 3 /2 0 0 5 7 /2 3 /2 0 0 5 8 /2 3 /2 0 0 5 9 /2 3 /2 0 0 5 1 0 /2 3 /2 0 0 5 V o lu m e tr ic s o il m o is tu re c o n te n t (m 3/m 3) 15 50 51 52 53 55 56 57 80 cm Depth 0.0 0.1 0.2 0.3 0.4 0.5 9 /2 3 /2 0 0 4 1 0 /2 3 /2 0 0 4 1 1 /2 3 /2 0 0 4 1 2 /2 3 /2 0 0 4 1 /2 3 /2 0 0 5 2 /2 3 /2 0 0 5 3 /2 3 /2 0 0 5 4 /2 3 /2 0 0 5 5 /2 3 /2 0 0 5 6 /2 3 /2 0 0 5 7 /2 3 /2 0 0 5 8 /2 3 /2 0 0 5 9 /2 3 /2 0 0 5 1 0 /2 3 /2 0 0 5 Vo lu m e tr ic s o il m o is tu re c o n te n t (m 3/m 3) 15 50 51 52 53 55 56 57
(b) Relative difference of soil moisture content at 20- and 80-cm depths
20 cm Depth -1 -0.5 0 0.5 1 9 /2 3 /2 0 0 4 1 0 /2 3 /2 0 0 4 1 1 /2 3 /2 0 0 4 1 2 /2 3 /2 0 0 4 1 /2 3 /2 0 0 5 2 /2 3 /2 0 0 5 3 /2 3 /2 0 0 5 4 /2 3 /2 0 0 5 5 /2 3 /2 0 0 5 6 /2 3 /2 0 0 5 7 /2 3 /2 0 0 5 8 /2 3 /2 0 0 5 9 /2 3 /2 0 0 5 1 0 /2 3 /2 0 0 5 R e la ti v e d if fe re n c e o f s o il m o is tu re c o n te n t 15 50 51 52 53 55 56 57 80 cm Depth -1 -0.5 0 0.5 1 9 /2 3 /2 0 0 4 1 0 /2 3 /2 0 0 4 1 1 /2 3 /2 0 0 4 1 2 /2 3 /2 0 0 4 1 /2 3 /2 0 0 5 2 /2 3 /2 0 0 5 3 /2 3 /2 0 0 5 4 /2 3 /2 0 0 5 5 /2 3 /2 0 0 5 6 /2 3 /2 0 0 5 7 /2 3 /2 0 0 5 8 /2 3 /2 0 0 5 9 /2 3 /2 0 0 5 1 0 /2 3 /2 0 0 5 R e la ti v e d if fe re n c e o f s o il m o is tu re c o n te n t 15 50 51 52 53 55 56 57 Figure 6
Fig. 6. (a)Volumetric soil moisture content and (b) relative difference of soil moisture content at 20- and 80-cm depths of the monitored sites within the swale 3. Red and blue windows represent the drying and recharging periods, respectively.
HESSD
4, 1185–1214, 2007
Temporal stability of soil moisture spatial
variability X. Zhou et al. Title Page Abstract Introduction Conclusions References Tables Figures ◭ ◮ ◭ ◮ Back Close
Full Screen / Esc
Printer-friendly Version Interactive Discussion EGU (a) Site 68 y = -0.4616x + 0.09 R2 = 0.0699 -0.1 -0.05 0 0.05 0.1 0.15 0.10 0.15 0.20 0.25
Volumetric soil moisture content (m3/m3)
R e la ti v e d if fe re n c e o f s o il m o is tu re c o n te n t Site 68 (b) Site 27 y = 4.1868x - 0.7182 R2 = 0.9834 -1 0 1 2 3 0.0 0.1 0.2 0.3 0.4 0.5 0.6 0.7 0.
Volumetric soil moisture content (m3/m3)
R e la ti v e d if fe re n c e o f s o il m o is tu re c o n te n t 8 Site 27 Figure 7
Fig. 7.Relative difference of soil moisture content versus soil moisture content at 40-cm depth for (a) the time-stable site 68 and (b) the time-unstable site 27.
HESSD
4, 1185–1214, 2007
Temporal stability of soil moisture spatial
variability X. Zhou et al. Title Page Abstract Introduction Conclusions References Tables Figures ◭ ◮ ◭ ◮ Back Close
Full Screen / Esc
Printer-friendly Version Interactive Discussion EGU (a) 10 cm depth 10 cm at site 33 y = 1.0035x - 0.0002 R2 = 0.9233 0.10 0.15 0.20 0.25 0.30 0.10 0.15 0.20 0.25 0.30
Measured soil moisture content (m3/m3)
Pr e d ic te d s o il m o is tu re c o n te n t (m 3/m 3) (b) 20 cm depth 20 cm at site 33 y = 0.8985x + 0.0434 R2 = 0.8683 0.10 0.15 0.20 0.25 0.30 0.10 0.15 0.20 0.25 0.30
Measured soil moisture content (m3/m3)
Pr e d ic te d s o il m o is tu re c o n te n t (m 3/m 3) (b)
Fig. 8. The soil moisture content estimated from the time-stable site 68 versus the measured soil moisture content for the stable site 33 at (a) 10-, (b) 20- and (c)40-cm depths.
HESSD
4, 1185–1214, 2007
Temporal stability of soil moisture spatial
variability X. Zhou et al. Title Page Abstract Introduction Conclusions References Tables Figures ◭ ◮ ◭ ◮ Back Close
Full Screen / Esc
Printer-friendly Version Interactive Discussion EGU (c) 40 cm depth 40 cm at site 33 y = 0.9827x + 0.002 R2 = 0.9054 0.10 0.15 0.20 0.25 0.10 0.15 0.20 0.25
Measured soil moisture content (m3/m3)
Pr e d ic te d s o il m o is tu re c o n te n t (m 3/m 3) Figure 8 Fig. 8.Continued.
HESSD
4, 1185–1214, 2007
Temporal stability of soil moisture spatial
variability X. Zhou et al. Title Page Abstract Introduction Conclusions References Tables Figures ◭ ◮ ◭ ◮ Back Close
Full Screen / Esc
Printer-friendly Version Interactive Discussion EGU (a) 10 cm depth 10 cm at site 38 y = 0.6086x + 0.1284 R2 = 0.7765 0.10 0.15 0.20 0.25 0.30 0.35 0.40 0.45 0.50 0.10 0.15 0.20 0.25 0.30 0.35 0.40 0.45 0.50
Measured soil moisture content (m3
/m3 ) Pr e d ic te d s o il m o is tu re c o n te n t (m 3// m 3) (b) 20 cm depth 20 cm at site 38 y = 0.6163x + 0.1491 R2 = 0.8015 0.20 0.25 0.30 0.35 0.40 0.45 0.50 0.20 0.25 0.30 0.35 0.40 0.45 0.50 0.55
Measured vsoil moisture content (m3/m3)
P re d ic te d s o il m o is tu re c o n te n t (m 3/m 3)
Fig. 9. The soil moisture content estimated from the time-stable site 68 versus the measured soil moisture content for the less stable site 38 at (a) 10-, (b) 20- and (c) 40-cm depths.
HESSD
4, 1185–1214, 2007
Temporal stability of soil moisture spatial
variability X. Zhou et al. Title Page Abstract Introduction Conclusions References Tables Figures ◭ ◮ ◭ ◮ Back Close
Full Screen / Esc
Printer-friendly Version Interactive Discussion EGU (c) 40 cm depth 40 cm at site 38 y = 0.5076x + 0.2094 R2 = 0.7862 0.20 0.25 0.30 0.35 0.40 0.45 0.50 0.55 0.20 0.25 0.30 0.35 0.40 0.45 0.50 0.55 0.60
Measured soil moisture content (m3
/m3 ) P re d ic te d s o il m o is tu re c o n te n t (m 3/m 3) Figure 9 Fig. 9.Continued.