HAL Id: hal-00304949
https://hal.archives-ouvertes.fr/hal-00304949
Submitted on 1 Jan 2004HAL is a multi-disciplinary open access archive for the deposit and dissemination of sci-entific research documents, whether they are pub-lished or not. The documents may come from teaching and research institutions in France or abroad, or from public or private research centers.
L’archive ouverte pluridisciplinaire HAL, est destinée au dépôt et à la diffusion de documents scientifiques de niveau recherche, publiés ou non, émanant des établissements d’enseignement et de recherche français ou étrangers, des laboratoires publics ou privés.
catchments
C. Neal, H. P. Jarvie, A. J. Wade, M. Neal, R. Wyatt, H. Wickham, L. Hill,
N. Hewitt
To cite this version:
C. Neal, H. P. Jarvie, A. J. Wade, M. Neal, R. Wyatt, et al.. The water quality of the LOCAR Pang and Lambourn catchments. Hydrology and Earth System Sciences Discussions, European Geosciences Union, 2004, 8 (4), pp.614-635. �hal-00304949�
The water quality of the LOCAR Pang and Lambourn catchments
Colin Neal
1, Helen P. Jarvie
1, Andrew J. Wade
2, Margaret Neal
1, Roger Wyatt
1,
Heather Wickham
1, Linda Hill
1and Ned Hewitt
11Centre for Ecology and Hydrology, Wallingford, OXON, OX10 8BB, UK
2Department of Geography, University of Reading, Whiteknights, PO Box 227, Reading, RG6 2AB, UK
Email forcorresponding author: [email protected]
Abstract
The water quality of the Pang and Lambourn, tributaries of the River Thames, in south-eastern England, is described in relation to spatial and temporal dimensions. The river waters are supplied mainly from Chalk-fed aquifer sources and are, therefore, of a calcium-bicarbonate type. The major, minor and trace element chemistry of the rivers is controlled by a combination of atmospheric and pollutant inputs from agriculture and sewage sources superimposed on a background water quality signal linked to geological sources. Water quality does not vary greatly over time or space. However, in detail, there are differences in water quality between the Pang and Lambourn and between sites along the Pang and the Lambourn. These differences reflect hydrological processes, water flow pathways and water quality input fluxes. The Pangs pattern of water quality change is more variable than that of the Lambourn. The flow hydrograph also shows both a cyclical and uniform pattern characteristic of aquifer drainage with, superimposed, a series of flashier spiked responses characteristic of karstic systems. The Lambourn, in contrast, shows simpler features without the flashier responses. The results are discussed in relation to the newly developed UK community programme LOCAR dealing with Lowland Catchment Research. A descriptive and box model structure is provided to describe the key features of water quality variations in relation to soil, unsaturated and groundwater flows and storage both away from and close to the river.
Keywords: water quality, nitrate, ammonium, phosphorus, pH, alkalinity, nutrients, major elements, trace elements, rainfall, river, Pang,
Lambourn, LOCAR
Introduction
Development of the community programme LOCAR (Lowland Catchment Research: www.nerc.ac.uk/funding/ thematics/locar/) emphasises the hydrological and water quality functioning of lowland permeable catchments in the UK in relation to issues of water resources, water quality and surface water ecology (Mainstone and Parr, 2002; Neal et al., 2002a, Withers and Lord, 2002). The Thames Basin has provided a major focus for work in relation to LOCAR and extensive earlier and ongoing studies (Neal and Whitehead, 2002). For LOCAR, three river basins are considered, the Tern in the English Midlands, the Pang/ Lambourn in the Thames Basin of southern-central England, and the Frome of southern England. Within the Thames basin, the Pang and Lambourn have been studied previously in relation to water quality functioning (Prior and Johnes, 2002; Neal et al., 2000a). This work has been complemented
by research on the adjacent River Kennet (Flynn et al., 2002; Neal et al., 2000b, 2002b; Jarvie et al., 2002a,b) and the main stem of the Thames (Neal et al., 2002c; Jarvie et al., 2002c).
Here, the water quality of the Pang and Lambourn is examined to elucidate major source contributions. in relation to spatial and temporal relationships This is done to provide a firm base for further detailed process-based water quality studies of these rivers under LOCAR. In extending previous studies of these rivers and the Thames Basin as a whole, this work complements a study of the Pang and Lambourn which examines input-output mass balance relationships (Neal et al., 2004a). It also forms a base for conceptualising the key processes controlling water quality for newly developing environmental impact models (OShea, 2002; Wade et al., 2002a,b; Whitehead et al., 2002).
Study area
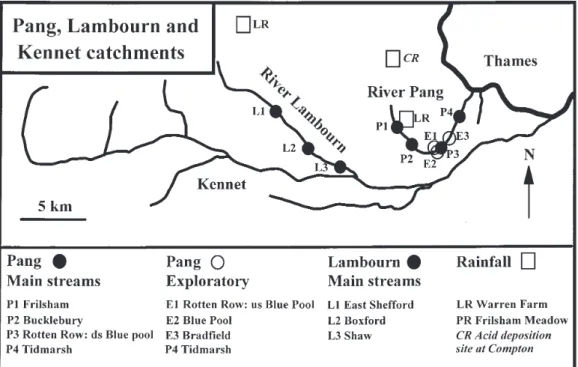
The Pang and Lambourn are adjacent tributaries of the River Thames, the principal river in the south-east of England (Fig. 1). Their areas are approximately 171 km2 for the Pang and
about 234 km2 for the Lambourn. The Pangs source is to
the east of its catchment and it discharges to the Thames at Pangbourne. The Lambourn drains east south-eastwards from springs near the village of Lambourn and discharges to the River Kennet at Newbury. The catchments lie approximately 90 km from the south coast and from the Thames estuary to the east and land-use is largely rural to moderately intensive farming. The geology is predominantly Cretaceous Chalk with a matrix dominated by the mineral calcite (CaCO3). The Pang has only one significant tributary
stream input, the Bourne, to the south of the catchment, draining Eocene clays, while the Lambourn has one significant tributary input, the Winterbourne.
LOCATION OF MONITORING SITES
For the Pang, monitoring began several years before the commencement of the LOCAR programme (Neal et al., 2000a). In contrast, monitoring of the Lambourn began only with the implementation of the core field component of the LOCAR programme. The details are as follows.
During the pre-LOCAR phase of the study of the Pang, the work centred on monitoring water quality at weekly intervals on the lower Pang near the village of Tidmarsh. Here, the Pang is within 3 km of Pangbourne and its
confluence with the Thames. At Tidmarsh, the Pang catchment has an area of about 150 km2 (about 90% of the
catchment as a whole). This site provides information on the downstream chemistry of the Pang without the confounding influence of point source sewage inputs at Pangbourne. Weekly monitoring began in August 1997 and is ongoing. Three other sites were established at the same time as the Tidmarsh site and they represent secondary exploratory sites which were monitored for a year on a monthly basis to examine the spatial variability in water quality. Detailed information on these sites is provided in Neal et al. (2000a). These secondary sites were:
1. Rotten Row (upstream of the Blue Pool)
This site, near the hamlet of Rotten Row, provides information on the upper part of the Pang and is referred to in Neal et al. (2000a) as the Upper Pang. This site, the downstream limit of the upper Pang above which it is ephemeral, is just upstream of a spring input to the Pang (the Blue Pool) that makes a major contribution to baseflow under very dry conditions.
2. The Blue Pool
This site represents a single groundwater input that contributes the main source of water from the upper catchment during summer baseflow periods. It is also near the hamlet of Rotten Row and its confluence with the Upper Pang is less than two km away, where it forms the lower Pang. Immediately after the Blue Pool, the water flows
through watercress beds before entering the main channel. The water was sampled within the pool itself and near to groundwater entry points at the bottom of the pool. These entry points were recognised by the continual resuspension of bottom sediments of calcite which precipitated in the pool. 3. Bradfield
This site is just downstream of the village of Bradfield but upstream of the small sewage outflow for the village. The Bradfield site is roughly half way between the Upper Pang/ Blue Pool sites and Tidmarsh some 8 km to the east-northeast.
Within the LOCAR study, four stream monitoring points were established on the Pang and three on the Lambourn; they cover the upper mid and lower stretches of each river fairly uniformly. Upstream to downstream, the sites on the Pang are at Frilsham, Bucklebury, Rotten Row (just downstream of the Blue Pool input to the main stem of the Pang), and Tidmarsh: the Rotten Row and Tidmarsh sites were sampled prior to and during the LOCAR research. The corresponding sites for the Lambourn are at East Shefford, Boxford and Shaw (Fig. 1). The LOCAR stream monitoring was weekly, and monitoring began in April 2002. Rainfall, also measured within the project, is addressed in Neal et al. (2004a).
STREAM SAMPLING AND ANALYSIS
Stream waters were collected weekly as instantaneous grab samples and filtered in the field through 0.45 mm membranes: unfiltered samples were collected for pH and Gran alkalinity, chlorophyll-a, total phosphorus (soluble plus particulate P) and suspended sediment concentrations. On return to the CEH Wallingford laboratories, a wide range of water quality determinands was assayed. The methods of analysis employed included electrometric and colourimetric methods as well as inductively coupled optical emission spectroscopy and ion chromatography (see Neal et al., 2004a, for details).
Hydrological setting
The rainfall and runoff characteristics for the catchments are available for several sites on the Pang and Lambourn (Marsh and Lees, 2003). For the present study, the primary hydrological gauging sites for the Pang and Lambourn are the Pang gauging site near Pangbourne where the river is near its confluence with the Thames and the Lambourn gauging site at Shaw/Newbury, close to its confluence with the Kennet.
High evaporation of the rainfall input occurs within the catchment (over 65%). Due to the highly permeable nature of the Chalk, both the Pang and the Lambourn are primarily groundwater fed but an exact water balance is difficult to assess because of uncertainty over the groundwater flow pathways and the possibility of bypass mechanisms (Bradford, 2002).
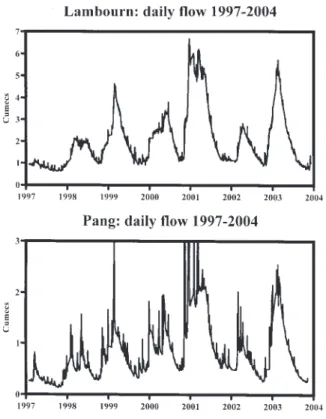
Figures 2, 3 and 4 illustrate the patterns of flow over time and between catchments for the Pang at Pangbourne and the Lambourn at Shaw. Figure 2 shows the long-term variations in daily average flow and the correlation of Pang and Lambourn flows during this period (1969 to 2003). Figure 3 provides daily flow time series for the period of monitoring (1997 to 2003) and Fig. 4 plots daily flows on the Pang versus those on the Lambourn for the full period of record. There are six main features of the hydrographs. 1. There are clear annual cycles. The winters of 1976/1977,
1992/1993 and 1997/1998 had particularly low winter flow maxima. The larger winter maxima occurred the periods 1993 to 1996 and 1999 to 2003, with the largest occurring in 2002/2003.
Fig. 2. Long term (1979 to 2003) temporal changes in daily average
flow for the Pang and Lambourn, and the relationship between their daily average flows.
2. The flow response showed a broadly uniform whale-back pattern typical of groundwater fed systems and a marked rising limb towards the end of each year as the catchment wetted up following the autumn recharge period. However, superimposed on this is a more dynamic short-term response, which gives rise to spiky hydrograph features associated with particular rainfall events.
3. The short-lived spiky response is most noticeable for the Pang. During these high response times the flow of the Pang can be as high as or higher than that of the Lambourn even though the Lambourn catchment has a greater area than the Pang. Note that with regard to features 2 and 3, the data are for daily average values and that the true spiky character of the response will be greater than that depicted in Figs. 2, 3 and 4. N.B. The flow structure at Pangbourne can be drowned by backwater at high flows and this may affect the accuracy at such times. However, the greater spikiness of the Pang occurs not just at very high flows and clearly the hydrology differs from that of the Lambourn.
4. The flows are highly correlated, but the flows for the Pang are generally lower than for the Lambourn: PangFlow = 0.41±0.01*LambournFlow 0.07±0.56 with
r2 = 0.65 and N=12770.
5. There seems to be a linear bound to the plot of flow for the Pang versus the flow for the Lambourn. However, there is a marked scatter to higher flows for the Pang away from this bound around the time of spikiness on the Pang. Occasional marked hysteresis covering several days to weeks may be linked to the issues of water backing up from the Thames as flagged in 3 above. 6. During the study period for the Pang (1997 to 2003),
the hydrograph time series divides into three groups. Firstly, winter maxima and summer minima increased for the first five years of record (1997 to 2001). Secondly, there is an intermediate response in 2002. Thirdly, there is an increased response for 2003 to values intermediate between 2000 and 2001.The year to year irregularity of patterns of flow correspond to the issue of climate instability for the UK (Marsh and Sanderson, 1997).
Thus, there are two main points to note. Firstly, there are clearly long-term variations in the hydrograph response and during the water quality monitoring period, flows have increased for the first five years and levelled thereafter. Secondly, despite the strong whaleback pattern for the two hydrographs, the Pang shows a more spiky response to rainfall and this is more characteristic of bypass flows linked with karstic features of dual or multiple porosity aquifers. This is illustrated by differences in the baseflow index (BI) Marsh and Lees, 2003) across the catchments, with lower values for the Pang:
Fig. 3. Temporal changes in daily average flows for the Pang and
Lambourn covering the period 1997 to 2003. Note that for the Pang, the daily flow can exceed 3 cumecs (values up to about 8 cumecs occur see Fig. 4). However, to show the spiky nature of the hydrograph, the y scale has been expanded, but as a consequence the highest flows have been truncated.
l For the Pang, the BI is 0.43 at Bucklebury and 0.86 at Pangbourne; this implies that the Pang is more karstic in its upper reaches. However, the lower Pang has water input from a tributary, the Bourn, which drains clays and this too will induce a spiky response to rainfall l For the Lambourn, the BI is 0.97 at both East Shefford
and Shaw.
Results
GENERAL OVERVIEW
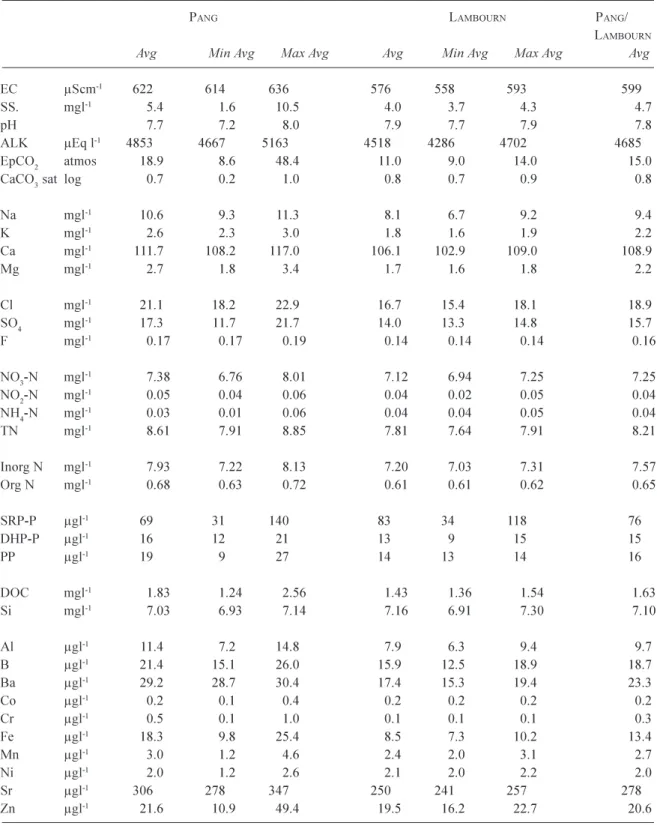
The Pang and the Lambourn river water is a calcium bicarbonate type (on an equivalents of charge basis), characteristic of rivers fed from Chalk aquifer sources and it also contain Na, Cl, SO4 and NO3 as major ions (Table 1: c.f. Neal et al., 2000a,b,c). For Table 1, the average water quality concentration is provided for sites across the Pang and across the Lambourn, together with their respective ranges in average across the sites. Within Table 1, the average concentration for the Pang and Lambourn is also provided as the average of the averages both. The Pang and Lambourn have an average calcium concentration of 108.9 mg l1 (5445 mEq l1) and an average Gran alkalinity (which
essentially equals bicarbonate) concentration of 4685 mEq l1. The calcium is mainly derived from weathering of the
calcium carbonate (calcite) dominated Chalk aquifer matrix. Correspondingly, the bicarbonate comes from +solubilisation of calcite and from respiratory processes associated with the vegetation and with bacterial breakdown of organic carbon within the aquifer in approximately equal measure: CaCO3(mineral) + CO2(biogenic) + H2O = Ca2+ +
2HCO3. By this process, the waters become saturated and
then oversaturated with respect to calcite and they are often an order of magnitude or more oversaturated with respect to CO2 in the atmosphere. This degree of over-saturation is
represented as the excess partial pressure of CO2 (EpCO2),
the number of times saturation with respect to atmospheric pressure. The groundwaters may be two orders of magnitude oversaturated with respect to CO2, but part of this CO2
degasses to the atmosphere and, during the day, is taken up by photosynthesising plants once the groundwater enters the river.
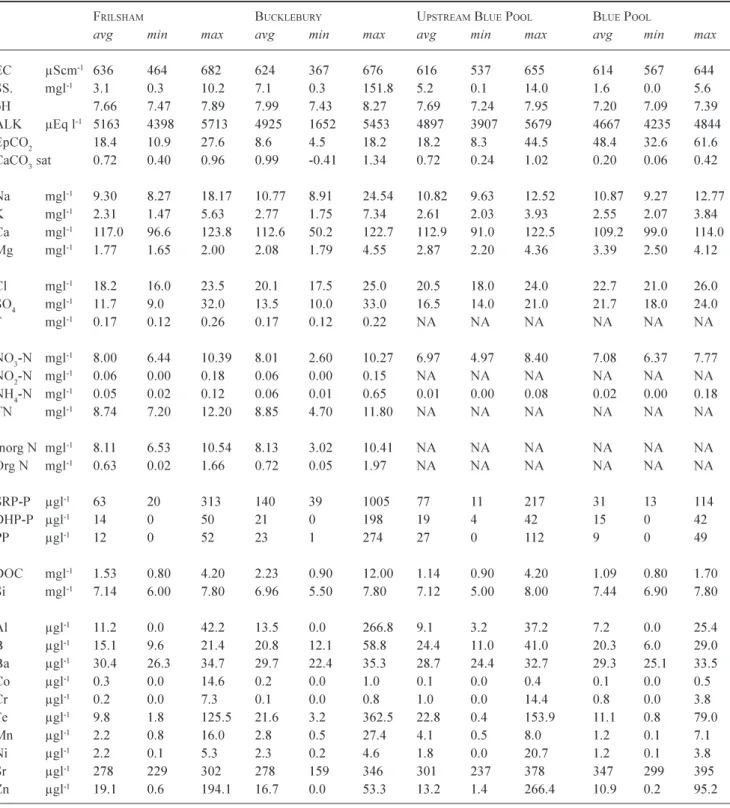
The groundwater for the area is typically close to saturation with respect to calcite, but within the river, degassing/uptake of CO2 leads to an increase in pH, resulting
in calcite over-saturation. This aspect is dealt with in more detail by Neal et al. (2000a,b,c; 2002b). However, the salient features are illustrated in Appendix Tables 1 and 2, where the information for the Blue Pool, which is essentially a groundwater endmember, is compared with Pang river
waters, both in terms of average and range: Appendix Table 3 provides the corresponding information for the Lambourn. The Blue Pool has:
l Lower pH. l Higher EpCO2.
l CaCO3 (calcite) saturations are nearer to zero (i.e. close to saturation): the rivers are oversaturated.
l Lower soluble reactive phosphorus (SRP) concentrations.
l Similar chemistries in other respects.
The nearness to calcite saturation and the low SRP concentrations for the Blue Pool, may reflect calcite-SRP interactions (co-precipitation), which acts as a process of P-removal (a self-cleansing mechanism) within the groundwater matrix (Neal, 2001, 2002a).
The Pang and Lambourn waters are also Na, Mg, Cl and SO4 bearing due to both atmospheric and point source
sewage treatment inputs. Their average concentrations are 9.4, 2.2, 18.9 and 15.7 (as SO4) mg l1, respectively: i.e.
around 408.7, 181.8, 533.1 and 327.1 mEq l1, respectively:
Mg and SO4 also have geological sources. Of the nutrients,
nitrogen is predominantly in the form of nitrate (average about 7.25 mg NO3-N l1, 517.9 mEq l1) and phosphorus
mainly in inorganic form (SRP, averages around 76 mg P l1)
and these come from both agricultural and point, sewage, sources. The other main nutrient in the water is silicon averaging 7.10 mg Si l1. Average concentrations of the trace
elements Ba and Sr are 29 and 300 mg l1, respectively. As
with calcium, Ba and Sr in the water are associated with dissolution of the calcite matrix in the aquifer (Ba and Sr substitute for Ca within the calcite lattice: Deer et al., 1975). Boron is also present and this is associated with both atmospheric and point sewage source inputs. The main trace metals are Al and Fe (average 10 and 20 mg l1, respectively),
which are probably derived from mobilisation of oxide minerals in the soils, Al and Fe in the rivers are present mainly as micro particulates which pass through the 0.45 mm membrane filters used to separate dissolved and particulate fractions. Zinc is also present with occasional (pollutant) spikes increasing average concentrations to 20 mg l1.
SPATIAL VARIATIONS
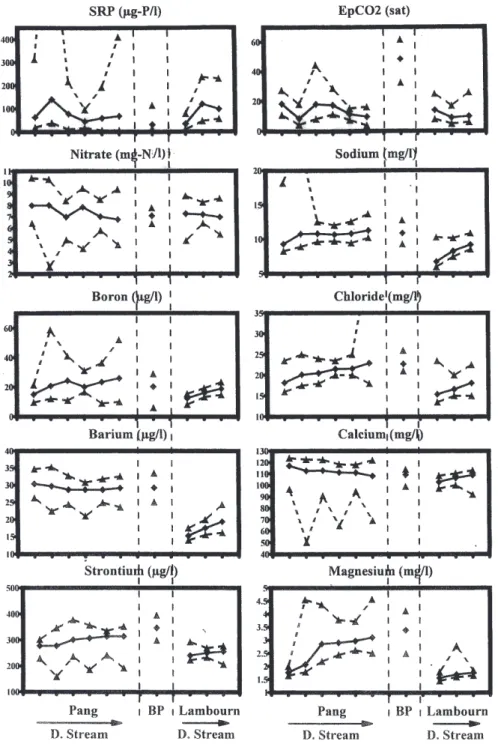
The longitudinal changes in concentration across the Pang and Lambourn are relatively small (Fig. 5) and in many cases not of statistical significance. The small differences that do occur are:
Table 1. Averages and range in averages for sites along the Pang and Lambourn.
PANG LAMBOURN PANG/
LAMBOURN
Avg Min Avg Max Avg Avg Min Avg Max Avg Avg
EC µScm-1 622 614636 576 558 593 599
SS. mgl-1 5.4 1.6 10.5 4.0 3.7 4.3 4.7
pH 7.7 7.2 8.0 7.9 7.7 7.9 7.8
ALK µEq l-1 4853 4667 5163 4518 4286 4702 4685
EpCO2 atmos 18.9 8.6 48.4 11.0 9.0 14.0 15.0
CaCO3 sat log 0.7 0.2 1.0 0.8 0.7 0.9 0.8
Na mgl-1 10.6 9.3 11.3 8.1 6.7 9.2 9.4 K mgl-1 2.6 2.3 3.0 1.8 1.6 1.9 2.2 Ca mgl-1 111.7 108.2 117.0 106.1 102.9 109.0 108.9 Mg mgl-1 2.7 1.8 3.41.7 1.6 1.8 2.2 Cl mgl-1 21.1 18.2 22.9 16.7 15.418.1 18.9 SO4 mgl-1 17.3 11.7 21.7 14.0 13.3 14.8 15.7 F mgl-1 0.17 0.17 0.19 0.140.14 0.14 0.16 NO3-N mgl-1 7.38 6.76 8.01 7.12 6.947.25 7.25 NO2-N mgl-1 0.05 0.040.06 0.040.02 0.05 0.04 NH4-N mgl-1 0.03 0.01 0.06 0.040.04 0.05 0.04 TN mgl-1 8.61 7.91 8.85 7.81 7.647.91 8.21 Inorg N mgl-1 7.93 7.22 8.13 7.20 7.03 7.31 7.57 Org N mgl-1 0.68 0.63 0.72 0.61 0.61 0.62 0.65 SRP-P µgl-1 69 31 140 83 34 118 76 DHP-P µgl-1 16 12 21 13 9 15 15 PP µgl-1 19 9 27 1413 14 16 DOC mgl-1 1.83 1.242.56 1.43 1.36 1.54 1.63 Si mgl-1 7.03 6.93 7.147.16 6.91 7.30 7.10 Al µgl-1 11.47.2 14.8 7.9 6.3 9.4 9.7 B µgl-1 21.415.1 26.0 15.9 12.5 18.9 18.7 Ba µgl-1 29.2 28.7 30.417.415.3 19.4 23.3 Co µgl-1 0.2 0.1 0.40.2 0.2 0.2 0.2 Cr µgl-1 0.5 0.1 1.0 0.1 0.1 0.1 0.3 Fe µgl-1 18.3 9.8 25.48.5 7.3 10.2 13.4 Mn µgl-1 3.0 1.2 4.6 2.4 2.0 3.1 2.7 Ni µgl-1 2.0 1.2 2.6 2.1 2.0 2.2 2.0 Sr µgl-1 306 278 347 250 241 257 278 Zn µgl-1 21.6 10.9 49.4 19.5 16.2 22.7 20.6
downstream of the Blue Pool site. This represents local inputs of groundwater which have had less chance to degas within the river (c.f. Neal et al., 2000a). l Small increases in Mg and Sr for the Pang at the same
location as the EpCO2 increase upstream of the Blue
Pool. Ba and Sr show small increases downstream for
the Lambourn. These features may link to local differences in aquifer hydrogeochemistry.
l Small increases in Na, Cl and B downstream for both the Pang and Lambourn. This may reflect local point sewage source inputs. For B, there is also a small rise in concentration in upstream and downstream parts of
Fig. 5. Examples of longitudinal changes in concentration across the Pang and Lambourn. For the plots, maxima and minima (dashed lines)
and averages are plotted (solid line), for the Pang (upstream to downstream in sequence along the river: Frilsham, Bucklebury, Rotten Row upstream of Blue Pool, Rotten Row downstream of Blue Pool, Bradfield and Tidmarsh), the Blue Pool (this is represented separately as it is a groundwater source not directly part of the stream) and the Lambourn (upstream to downstream in sequence along the river; East Shefford, Boxford and Shaw).
the Pang, with an offset to lower concentrations half way along the catchment just upstream of the Blue Pool input. l With the local sewage inflows to the rivers, SRP inputs would also be expected with concentrations perhaps varying in a similar way to Na, Cl and B. However, the SRP concentrations show a more complex pattern with
increases immediately downstream of sewage discharge points, but subsequent reductions in SRP downstream of point sources. Within-river processing may lead to downstream losses as a result of uptake onto bottom and suspended sediments as well as uptake by biofilms and periphyton (Jarvie et al., 2002a,b,c).
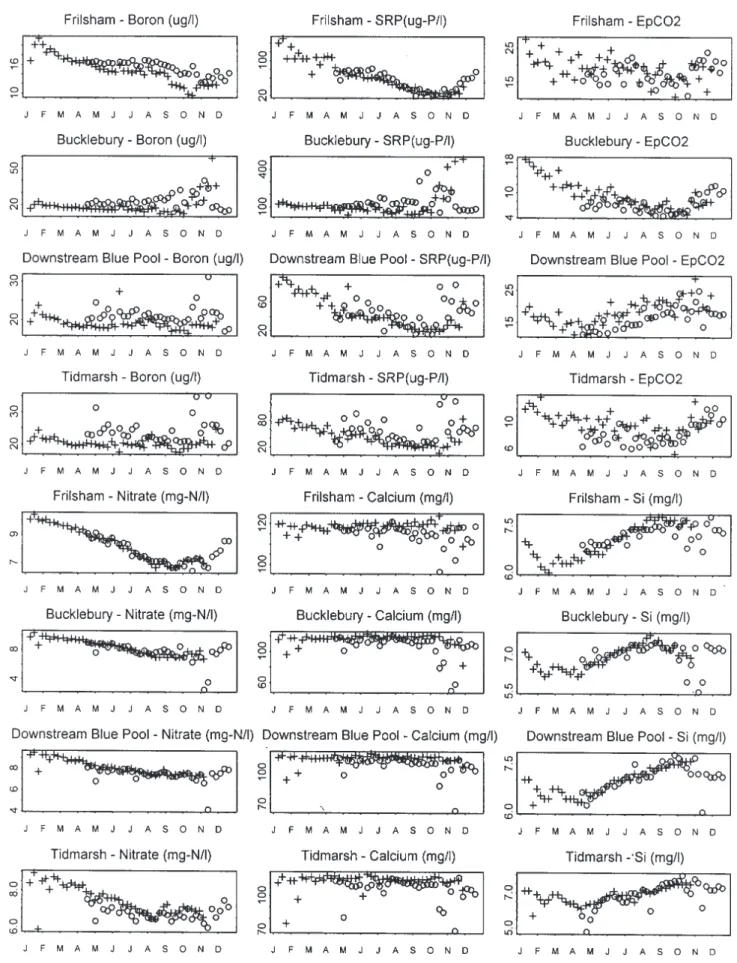
Temporal variations, linkages to flow and season and Inter-element relationships
Although the concentrations of most major ions, nutrients and trace elements are relatively uniform for the Pang and Lambourn, there are some seasonal patterns, which are, in many cases, linked to seasonal variations in river flows (Figs 6 and 7). In general, patterns are less complex in the Lambourn than in the Pang; this provides the clearest dostinction between point and diffuse input sources. The Pang, in part, shows similar features but hydrological influences produce a more complex concentration response. The salient features are as follows:
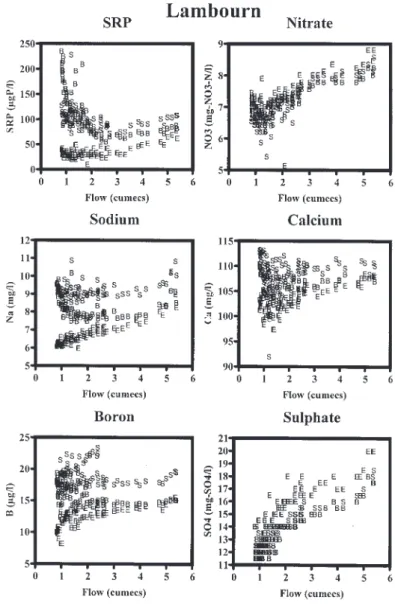
The Lambourn
Relationships between concentration and flow (Fig. 8) show that some determinands plot together and thus exhibit similar behaviour at all sites on the Lambourn. In other cases, there is a clear separation between sites: this may result from a different range in concentrations (but similar responses with changing river flows) or from contrasting responses to changing flows for different sites. Examples of the types of pattern are shown in Fig. 8 where the concentrations of selected determinands are plotted against the flow at Shaw and the seasonality in concentrations for the two LOCAR sampling years is shown in Fig.6.
The groups of determinands that show similar behaviour across the Lambourn sites are:
l pH, EpCO2 and Si show little variation with flow but with a small dip for EpCO2 and Si together with a small
increase in pH at intermediate flows. The primary Si minimum occurs in April, increasing downstream from East Shefford to Shaw, with a secondary dip in August/ September. EpCO2 minima occur from April to June.
l DOC, F, Sr trace metals, NH4 and NO2 exhibit no consistent pattern with flow change and no pronounced seasonality. Rather, there is a variable/ spiky response: given the little systematic structure and to minimise the large number of diagrams presented, these components are not plotted here.
l NO3 concentrations show a dip followed by an increase with increasing flow. NO3 concentrations decrease from
January to August, and then flatten out and rise again with increasing flows in November.
l SO4 and K show an increase with increasing flow. The seasonal patters for SO4 are very similar to those for
nitrate, whereas K concentrations are dominated by periodically high concentration spikes during August 2003 and the onset of higher flows in October/ November.
The reasons for these patterns are:
l pH and EpCO2 variations are controlled by photosynthesis and respiration processes and by the degassing of CO2 from the water column to the
atmosphere. Clearly, a dynamic equilibrium state is occurring including perhaps a strong diurnal cycle associated with these processes that is not monitored within this study, but which are seen in studies of similar rivers within the Thames basin (Neal et al., 2002b). l Si is derived from the weathering of silicates/
aluminosilicates within the aquifer and river channel. However, the major variation in Si concentrations is linked to spring diatom blooms, which cause a pronounced reduction in concentrations in April and a secondary minor bloom in August. Si concentrations are highest in the late-summer/early-autumn period. With the onset of higher winter flows, Si concentrations decrease and this probably links to inputs from water with shorter residence times within the catchment. However, the decline is small due to the long storage times expected for such an aquifer-sourced river and because an equilibrium might be set up with flints and other forms of quartz in the river sediments (Casey and Neal, 1984).
l NO3 and SO4 show a strong increase in concentration with increasing river flows as a result of increases in runoff from the agricultural land when excess fertilisers in the soils will be leached. For NO3, mineralisation
will be higher during the autumn period and crop uptake will reduce concentrations during the spring and summer months. The initial decline in NO3 may also be
linked to within channel removal processes associated with algae and macrophyte development.
l DOC, F, Sr, trace metals, K, NH4 and NO2 show little seasonal variability or linkage with flow. The major variability in concentration is a spiky response with intermittent inputs, which may be strongly linked to storm-events and near-surface runoff generation/fissure flow during the summer and the early autumn when baseflow dilution is low. Several of these determinands (the trace metals in which are easily hydrolysable in particular) are linked to particulate transport including colloidal movement and particulate-solute interactions. Studies of particulate transport in an adjacent chalk stream, the River Kennet (Jarvie et al., 2002a) have also shown similar spikes in particulate concentrations linked to relatively small-scale increases in river flow. These can produce pronounced responses in particulate concentrations under summer/early autumn baseflow, possibly linked to local near-surface runoff generation
Fig. 6. Seasonal patterns of selected water quality determinands for the Lambourn: circles represent time series for 2002 and crosses 2003. from roads or other sources close to the stream channel
such as slurry sources and septic tanks. For NH4 and
NO2, the spikes may well be related to intermittent
slurry/septic tank contributions as groundwater levels rise in the autumn, producing seasonal inputs and noisy data.
The determinands that show spatial variations in their flow-concentration relationships are Gran alkalinity, B, Ba, Ca, Cl, Mg, SRP and Na: illustrations of the relationships encountered are provided in Fig. 8. The primary spatial separation is between East Shefford and the two sites downstream, Boxford and Shaw. At East Shefford, concentrations of these determinands (with the exception
of Ba) increase with flow, while at Boxford and Shaw the concentrations decrease then level off and subsequently increase again as flow increases. The important points to note for this group are (c.f. Neal et al., 2004a):
l Na and Cl are correlated (R2 = 0.667, N =244) as they
have the same sources, the atmosphere and sewage effluent.
l Alkalinity and Ca are correlated (R2 = 0.697, N =244)
due to their common hydrogeological sources. l Mg is highly correlated with the above two groups (R2
= 0.628, N =243 with Cl and R2 = 0.628, N =242 with
Gran alkalinity). This would be expected as Mg can be derived from atmospheric, sewage effluent and hydrogeological sources. Mg, Ca and NO3 show similar
seasonal patterns at East Shefford. However, at Boxford and Shaw, the seasonal similarity between Mg, Ca and
NO3 breaks down and Mg shows a closer link with
EpCO2.
l B and SRP show some correlation for Boxford: SRPBoxford = 18.4±5.3*BBoxford 180±73 with r2 = 0.39
and N=87 (units mg l1). However, for the other
Lambourn sites there is a poor correlation (R2 = 0.11
for N = 83 at East Shefford and R2 = 0.03 for N = 83 at
Shaw). There is a marked difference between the flow relationships and seasonality for SRP and B comparing East Shefford with Boxford and Shaw. At East Shefford, the highest concentrations of SRP occur during the winter high-flow period (January and February), suggesting a predominantly diffuse source of SRP and B at East Shefford. For SRP, concentrations at East Shefford decline rapidly between January and April and then remain approximately constant at around 30 mg-P l1 over the summer. In contrast, a reverse pattern is
observed at Boxford and Shaw, with highest concentrations during the summer/autumn, reaching a maximum of about 200 mg l-1 at Boxford and 120 mg l1 at
Shaw, linked to low summer baseflow dilution of point source inputs. SRP concentrations increase in a near-linear trend between April and October/November, prior to the onset of winter high river flows. With the onset of winter high flows, SRP concentrations decrease rapidly as result of greater dilution of point-source inputs. The higher SRP concentrations at Boxford in late summer and autumn of 2003 may reflect lower river flows and, thus, lower point-source dilution and higher SRP concentrations. Boron shows a more complex flow/ seasonal response than SRP. Like SRP, B concentrations are higher during the winter high flows at East Shefford and higher during summer low flows at Boxford: at Shaw, this is less clearly defined, particularly for 2003. However, all the Lambourn sites show a higher degree of variability during the summer for B compared with SRP. Firstly, at all sites, B concentrations are higher during the 2002 spring/summer period than the spring/ summer of 2003. Secondly, during 2003, there are consistent dips in B concentration which occur at all sites in June and August/September. These results suggest that the primary source of SRP and B is diffuse at East Shefford and point source at Boxford, with a mixture of source contributions at Shaw. However, for B, there are additional source/dilution/in-stream effects during the summer months. Indeed, there may be some indication of within-catchment/within-river loss of B during the periods of high biological activity. Uptake of B can occur because B is an essential trace nutrient and it can be incorporated into the growing biomass. This, for example has been observed for a site in the British uplands where about 30% of the atmospheric input is retained by the catchment (Neal, 1997). In terms of the point source nature of the SRP input at Boxford, the gradient of 18.4±5.3 mg-P l1:mg-B l1 is at least twice
as high as that for typical sewage treatment works effluent (Neal et al., 2004b) and it seems that either the effluent is enriched due to some other input or there is another point source input that is high in SRP but not B. For Ba there is a decrease then a levelling off with increasing flow across all three Lambourn sites; the decrease is greatest at Shaw. All sites show a similar pattern of Ba concentration with minima from March to May and increasing concentrations reaching a peak in the autumn. However, there are clear differences in concentration for the three sites. The pattern of seasonality for Ba is similar to that for EpCO2 with higher concentrations in the autumn;
the reason for this behaviour for Ba is not clear. The Pang
Across the sites there is temporal variability in concentrations linked primarily to flow (Fig. 9) and season (Fig.7). The salient features are:
l NO3 shows a small but marked increase during the winter months in line with flushing of fertiliser sources from the land: NO3 mineralisation during the autumn
period and crop uptake will reduce concentrations during the spring and summer months. There may also be within-channel removal processes during the spring/ summer months when within-river biological activity is high. The clearest pattern occurs at Frilsham, but all other sites show similar features, combined with short-lived downward spikes in NO3 concentration,
particularly during the autumn. Thus, at Bucklebury and downstream of the Blue Pool, NO3 concentrations
decrease early November 2002 (a less marked dip occurs at Frilsham and at Tidmarsh): there is also a dip late January 2003 which increases in size downstream (Bucklebury, downstream of the Blue Pool and Tidmarsh, respectively). The intermittent reductions in nitrate concentrations are presumably linked to rainfall events and possibly near-surface runoff generation/ fissure flow delivery, which dilutes the background signal, but this does not match specific high flow events. l Ca, Sr, Ba and Gran alkalinity correlate with each other and they also show small but clear drops in concentration across all the sites, particularly during the autumn. Despite the consistency, there is no clear link with flow even though these determinands might well be expected to decrease as the input of rainfall increases to dilute the background signal. The largest depressions seem to occur on the rising limb to the peak of the seasonal pattern, but none of the very high flow spikes mentioned earlier in the paper in the context of general hydrology have been picked up (i.e. the weekly monitoring has missed the sub-weekly spikes). There is a drop in streamwater NO3 as well as Ca in November
2002 and this implies a dilution of the groundwater by near surface runoff. In terms of the strength of the correlations, with N = 553, Ca is most strongly correlated with Gran alkalinity (r = 0.930) and then with Ba and Sr (r = 0.742 and 0.497, respectively): the correlation between Sr and Ba is r = 0.454.
l Mg and SO4. Although, Mg and Ca are hydrogeochemically similar, their behaviour shows quite a different pattern and there is a generally negative relationship (r = 0.544, N = 553). Also, Mg behaves
Fig. 9. Concentration flow relationships for selected determinands at sites across the Pang (B = Bradfield, Bu = Bucklebury, D =
downstream of the Blue Pool, F = Frilsham, T = Tidmarsh, U = upstream of the Blue pool).
differently at Frilsham compared to the downstream sites. At Frilsham, there is a marked peak during the winter months, while for the other sites, the reverse occurs and there is a much more spiky signal, with high concentrations particularly during the spring and autumn of 2002. The time series patterns are very similar for downstream of the Blue Pool and Tidmarsh. Mg is correlated with SO4 (r = 0.767, N = 553), and they in
part follow B, Na and Cl (the correlation coefficients being of the order of 0.5 to 0.6, N =553. This feature links to sewage source inputs as discussed below. l SRP shows a clear seasonal pattern of change at
Frilsham, with higher concentrations in winter, reaching a minimum in the autumn prior to the onset of higher winter flows. This pattern follows that of NO3 with
higher concentrations during the winter months. There
is a similar seasonal response further downstream (downstream of the Blue Pool), but there are also clear spikes in concentration during the autumn to early winter period of 2002 as well as late 2003. In the case of Bucklebury, there is a gradual increase in SRP through the summer months as point source inputs are less diluted, while at Tidmarsh, there seems to be a more mixed signal, with declines in SRP from the winter maximum, increases in early summer and then a further decline until October, with event-based spikes in concentration during the early part of the seasonal rising limb of the hydrograph. The reason for the variations is not clear, but there seems to be a background signal of a possibly agricultural source linked to fluctuation in groundwater levels at Frilsham, downstream of the Blue Pool and Tidmarsh. This is augmented by localised
spikes downstream of the Blue Pool and at Tidmarsh, which may be linked to near-surface runoff and agricultural, slurry or septic tank sources. At Bucklebury, the background SRP signal is more closely linked to a point (sewage) source but it also receives occasional spikes from other sources.
l Boron shows a similar pattern to SRP, especially at Frilsham and Bucklebury. For the sites (a) just downstream of the Blue Pool and (b) Tidmarsh, similar patterns between B and SRP occur except that the seasonal SRP response is not observed for B. The implications of this, since B and SRP will be correlated for sewage sources, is that there must be a mix of sewage and agricultural sources for SRP that peak during the winter months. For Frilsham and Bucklebury, there are very strong linear relationships between B and SRP (gradients 10.3 and 12.2 m-P l1: m-B l1, respectively:
N = 83 in both cases, R2 = 0.600 and 0.634 respectively.
l Na and Cl show similar patterns (r = 0.903, N = 553); they also show similar linear features to that for B (r = 0.633 and 0.575 for Na and Cl respectively, N =533) as well as Mg and SO4 where similar regressions to B are
observed. This reflects Na and Cl sources from sewage as well as atmospheric inputs.
l EpCO2 mainly shows seasonal variations with peaks
during JanuaryFebruary except just downstream of the Blue pool where peaks occur October to November These patterns reflect the combined effects of CO2 laden
groundwater entering along different parts of the river and the effects of degassing of CO2 to the atmosphere.
The difference in timing for the site just downstream of the Blue Pool may well reflect its influence on the flow in the river: the Blue Pool is CO2-laden due to its
proximity to spring discharge of groundwater and inflow from the Blue Pool has a proportionally greater influence on the main river quality at times of lowest river flow. Peaks in EpCO2 are also apparent at Tidmarsh
in November 2002, but the reason for this is not clear. l In terms of inter-determinand relationships, the autumn spikes in Mg, SO4, SRP, B, DOC, Na, K and Cl
correspond with downward spikes in Ca, Sr, Ba and NO3, the statistics for which are provided above.
Intermittent near surface runoff events/fissure flow may be small in absolute volumetric terms and the overall annual flow variability. However, they may well be important in terms of water quality. This is because they occur with the onset of (a) winter runoff when baseflow (and thus dilution) is still low and (b) rising groundwater levels which intercept slurry/septic tanks. This feature is very similar to that observed on the Kennet, except that, in the case of the Kennet, daily sampling allowed
the features to be picked up more effectively (Jarvie et al., 2002a)
l For the trace metals, there is little structure to the data and occasional outlier values. However, when Co concentrations are greater than about 3 mg l1 and Cr
concentrations are greater than about 2 mg l1, there is a
marked linear relationship between Co, Cr and Zn and this occurs primarily for Tidmarsh where: ZnTidmarsh =
12.0±0.9*CoTidmarsh + 18.2±14.1 with r2 = 0.989 and N=9
and CrTidmarsh = 0.49±0.6*CoTidmarsh + 0.0±0.9 with r2 =
0.974 and N=9 (units mg l1). This presumably reflects
inputs of a specific type of Co-, Cr- and Zn-bearing pollutant above a general background.
For the Pang, there are longer data records than for the Lambourn, and these can be used to assess variations across several years (Fig. 10a and b). The salient features are: l NO3 exhibits an increasing trend in concentration, partly
masked by flow related patterns and seasonal oscillations. Linear regression give gradients of 0.21, 0.20 and 0.21 mg NO3-N l1yr1 respectively with r2 of
0.219, 0.257 and 0.44 (N = 320), where the concentration data are regressed with increasing resolution against (a) time, (b) time and flow and (c) time and flow and sin and cosine of the month (scaled to radian units): the latter two regressions compensate for flow and flow plus season effects. All the results show a similar pattern with concentrations increasing at around 0.2 mg NO3-N l1 of nitrate per year.
l NH4 concentrations are lower for the first half of the
study period, with a step change around 20002001. This corresponds with the autumn/early-winter floods of 2000. This feature may well result from changes in groundwater storage and the mobilisation of near surface point and diffuse sources of pollution from sewage and animal slurries. Thus, following the floods of 2000, groundwater levels will be particularly high and NH4 will enter the river by the flushing of the
groundwater/unsaturated-zone near to the river. NH4
concentrations may also be higher during these periods due to release from newly deposited agriculturally-impacted sediments in the river.
l Suspended sediments, Fe and Mn are all correlated with flow (r2 = 0.526, 0.256 and 0.241, respectively, N =
303). Hence, they show seasonality very similar to that of flow. However, there are some clear outlier points of high concentration and more than a single straight line may describe the behaviour.
l Sr shows a negative relationship with flow and there seems to be a dilution effect through the years: SrTidmarsh
Fig.10a. Concentration time series for nitrate, ammonium, and
boron, as compared with flow for the Pang at Tidmarsh. Fig. 10b. Concentration time series for EpCOcompared with flow for the Pang at Tidmarsh.2, Mn and Sr, as
= 29.9±3.2*FlowTidmarsh + 339±40 with r2 = 0.526 and
N=310 (units, mg l1 and cumecs, respectively).
However, there are some marked outlier points with low Sr concentrations that probably correspond to near surface runoff generation of Sr depleted waters mixing with stored waters high in Sr from the carbonate matrix of the aquifer.
l EpCO2 is highest during the wetter years, and tends to be higher in winter.
l B shows an initial increase for the first three years, it then plateaus and declines thereafter. There is no clear seasonality, but concentrations tend to be higher in winter, suggesting that B concentrations are not controlled by effluent point source contributions alone, but by a more complex mixture of sources such as the atmosphere and agriculture.
l Other components do not show any clear pattern other
than for electrical conductivity which increases and then plateaus. However, there is also scatter to the data with outliers of low electrical conductivities.
Discussion
The study shows that the water quality of the Pang and Lambourn is essentially a calcium bicarbonate type, characteristic of surface waters supplied from a Chalk aquifer. In places, inputs of pollutant sources are observed most clearly under baseflow conditions (e.g. SRP and B). Under stormflow conditions, there is a rapid and short-lived near-surface runoff component, especially on the lower Pang which generates intermittent spikes (e.g. suspended sediments and sewage effluent associated water quality determinants) or decreases in concentration (e.g. NO3 and
interval. These intermittent spikes in concentration may be linked to agricultural runoff from the land surface and/or farmyard/slurry-pit contributions close to the river. However, given their closeness to the river, there may be a type of pollution signal associated with sewage, where septic tank releases to the shallow groundwater near to the river enters the river intermittently when the water table rises. Such a process may also be more uniform under conditions where there is a flushing of the unsaturated zone near the river at high groundwater levels, where heterogeneous bypassing mechanisms are not significant. This more uniform type of response is to be anticipated as the higher population densities in the area will be associated with the farms and the villages which are often close to the river. Thus, concentrations of water quality determinands associated with sewage sources (e.g. Na, Cl, Mg, SO4, SRP and B) will
increase in concentration in the river as flow increases, with a possibility of exhaustion at the highest flows or late in the hydrograph response, when dilution of the pollutant input will occur. This type of response is linked to point sources (septic tanks), but the flow response in the river is more representative of a diffuse source. This feature might be termed a point-diffuse source. Thus, here, three types of response are defined:
l Point sources: sewage treatment works discharging effluent directly to the river and perhaps farmyard slurry tanks near the river that discharge to the river only when the groundwater intersects the surface to produce overland or near overland flow. The sewage treatment works effluent will decrease in concentration with increasing flow while the slurry tank inputs will show high concentration spikes at high flow.
l Point-diffuse sources: septic tanks and sewage treatment works effluent, which enter the unsaturated zone near the river. These concentration will increase with flow until exhaustion occurs when concentrations will peak or decrease as flow increases further.
l Diffuse sources: agricultural and other inputs away from the river (e.g. NO3 and suspended sediments).
Concentrations will increase with increasing flow as pollutants are flushed from the catchment. Under the highest flows, concentrations may peak and then decrease with exhaustion. For components associated with the groundwater (e.g. Ca and Gran alkalinity), the chemistry may decrease with increasing flow as the groundwater signal is diluted by rainfall inputs. In terms of the dynamic water quality changes linked to flow, the Pang is more responsive due to its more karstic characteristics, especially in the upper catchment. However,
weekly sampling is insufficiently frequent to pick up the details of the flow- related patterns of change; Neal (2002b) and Kirchner et al. (2000, 2001) showed the importance of fine resolution data (of the order of minutes up to a day) in bringing to light the high information content of the river water signal. This has led to issues of water transport through and the distributions of residence times for highly heterogeneous catchment systems as well as the observation of fractal processes and dynamics. Karstic features with their characteristic dual or multiple porosities may well behave similarly to the upland fracture-flow-dominated systems to which the current fractal studies are presently directed. However, set against this, there is a background response linked to seasonal and year-to-year changes in flow which in turn is linked to fluctuations in groundwater levels to produce the annual cyclical pattern in flows. These responses, in contrast to storm-event runoff generation, tend to produce smooth seasonal patterns in concentration variability: they may be:
(1) increases in concentrations, linked to mobilisation and solubilisation of solutes such as nitrate as groundwater levels and river flows rise;
(2) decreases in concentration with increasing groundwater discharge linked to dilution of point source inputs. With regards to the nutrients, N and P behave differently. For N, the main component is NO3 which is linked, primarily,
to groundwater sources and long residence times as any sewage treatment outflows are not highly enriched relative to the groundwater. There is an increase in streamwater NO3
concentration with increasing flow and this may reflect increasing inputs from fertilisers leached from the land at high flows, but it may well be more indicative of within river consequences of biological processes: in summer, low-flows, increased in-stream plant uptake and increased denitrification are occur, whilst in winter flows are higher and plant uptake is reduced.. These relationships generate a pattern of increasing streamwater NO3 concentration with
flow, which is separate from any seasonal signal in the streamwater NO3 concentrations caused by land-based
nutrient delivery. For NH4, there are more local sources and
the patterns of behaviour are more sporadic and linked to near river sources. For P, SRP dominates and this is linked mainly to point and point-diffuse inputs of sewage effluent. A modelling framework is presented below to describe the processes operative within the catchment in terms of regions away from and regions close to the river. As a pragmatic approach to describing the sewage effluent input simply, an equation might be considered of the type:
Effluent flux = a + b*flowc, where a, b and c are
constants.
In this equation, the a term represents a point source and the b and c terms, that links to flow, represents a point-diffuse term. For a point source, the flux input is constant and hence the streamwater concentrations decrease inversely as stream-flow increases. For a point-diffuse source, if c=1, the pollutant flux increases in proportion to flow delivered from the land to the river, resulting in a constant concentration in the river (assuming the upstream river concentration is constant) across the flow range. If c=2, the effluent flux increases with the square of the flow and streamwater concentration will increase linearly with increasing flow. If there is depletion of pollutant flux at high flow from the land to the stream, the b term will no longer be constant and it will decrease as flow increases. The constants a and b will link to the product of the population discharging to STW/septic tanks and the efficiency of removal of pollutants within the sewage treatment works/ septic tanks and groundwater as well as to a scaling factor to account for spatial and temporal heterogeneity in the source.
In addition, year-to-year variations in baseflow linked to groundwater discharge can have a significant effect on concentrations for example, the differences in concentration changes from 2002 to 2003 (Figs. 6 and 7), particularly during the summer for determinands linked to point-source contributions, such as SRP and B. Indeed, the longer term data for the Pang show clearly that some patterns of change are occurring for periods longer than events and season (Figs. 10a,b). In particular, suspended sediments, Fe and Mn all fluctuate in relation to year to year differences in flow. This is to be expected as suspended sediment concentrations increase with increasing turbulence in the water, while both Fe and Mn will have a large colloidal component that will be mobilised with increasing turbulence (Neal et al., 1996, 1997). Sr decreases with increasing flow which implies some type of dilution within the catchment. Correspondingly, the variation in EpCO2, beyond the
seasonal patterns expected in relation to biological activity, suggests a groundwater input that has changed through the years. The same is probably true in relation to ammonium and boron. However, the details of the changes in groundwater storage cannot be assessed here due to lack of direct information on what is happening within the groundwater stores.
The results presented in this paper provide a backdrop against which to examine the hydrological and water quality functioning of the Pang and Lambourn within the context of the LOCAR. This work highlights issues of
hydrogeological controls on water transport through the catchments and the role of point and diffuses pollutant sources.
The value of using water quality indices as tracers for examining hydrological pathways has been highlighted here, but new work is now needed to characterise the hydrogeochemical functioning of the catchment. It is now necessary to:
1. Determine the water quality of point and diffuse rainfall and groundwater endmembers. This will allow a full and proper assessment of water mixing relationships in terms of an end-member mixing analysis (EMMA: Christophersen et al., 1990; Hooper et al., 1990). 2. Measure water quality on a much shorter time-frame:
long-term measurements at daily/sub-daily frequencies are needed. This will allow the true nature of the dynamic behaviour of water quality to be identified together with a much fuller quantification of the range of extremes. This information is also required for studies of fractal behaviour to which such dual or multiple porosity systems might well be prone.
3. Combining 1 and 2 to examine the data and water quality functioning within contemporary dynamic modelling frameworks.
Wider comment: a conceptual
modelling framework: the
Pang-Lambourn model
The results presented in this paper provide a clear indication of the type of system being dealt with and it would be remiss before the close of this paper not to provide a general overview in schematic fashion. The structure is represented in Fig. 11 for which is termed the Pang-Lambourn model. In this structure, consideration is given for regions close to and away from the river. Away from the river, the main rainfall input is transmitted vertically through the soil and unsaturated zones to the groundwater (perhaps with some water bypassing due to the dual or multi-porosity of the Chalk. For this region, water residence times may be of the order of years or more. For the area near to the river, the dynamic changes are much more rapid and the influence of changing groundwater levels is much more significant in terms of chemical transfer to the river. In this case, there is a soil/unsaturated zone inundated by a fluctuating groundwater table.. In this zone, there are pollutant inputs from septic tanks and sewage treatment works discharges to soakaways or wetlands. Bypass mechanisms might also be important in this zone because of heterogeneity in flow
Flow path Description
1. Macropore by-pass of Unsaturated Zone 2. Overland flow under extreme events 3. Lateral groundwater flow
4. Exchange of water between stores: two way process depending on saturation 5. Groundwater component entering stream
6. Near stream flushing of saturated-unsaturated interface under high groundwater conditions 7. STW input to unsaturated zone near stream
8. STW input to stream
and flow routing. Such bypass flows to the river may relate to more rapid transfer of water from further away from the river. Alternatively, it may represent subsurface flow of groundwater underneath the river for example in relation to regional groundwater patterns of flow. Such a conceptual framework must now be incorporated into modelling frameworks such as INCA (Wade et al., 2002a,b; Whitehead et al., 2002) either within a box type approach, or in a fully-distributed scheme.
References
Bradford, R.B., 2002. Controls on the discharge of Chalk streams of the Berkshire Downs, UK. Sci. Total Envir., 282-283, 65 80.
Casey, H. and Neal, C., 1984. Abiological controls on silica in chalk streams and groundwaters. Sediments and Water Interactions, 329-340. Proc. Third International Symposium on
Interactions between Sediments and Water, P.G. Sly, (Ed.),
Geneva, Switzerland.
Christophersen, N., Neal, C., Hooper, R.P., Vogt, R.D. and Andersen, S., 1990. Modelling streamwater chemistry as a mixture of soilwater end-members - a step towards second-generation acidification models. J. Hydrol., 116, 307320. Deer, W.A., Howie, R.A. and Zussman, J., 1975. Rock Forming
Minerals, Vol. 5, non-silicates, carbonates, Longman, Thetford,
Norfolk, UK, 226322.
Flynn, N.J., Snook, D.L., Wade, A.J. and Jarvie, H.P., 2002. Macrophyte and periphyton dynamics in a UK Cretaceous Chalk stream: the River Kennet, a tributary of the Thames. Sci. Total
Envir., 282-283, 143157.
Hooper, R.P., Peters, N.E. and Christophersen, N., 1990. Modelling streamwater chemistry as an a mixture of soilwater end-members an application to the Panola Mountain catchment, Georgia, USA. J. Hydrol., 116, 321344.
Jarvie, H.P., Neal, C., Williams, R.J., Neal, M., Wickham, H., Hill, L.K., Wade, A.J., Warwick, A., White, J., 2002a. Phosphorus sources, speciation and dynamics in a lowland eutrophic Chalk river; the River Kennet, UK. Sci. Total Envir.,
282/283, 175203.
Jarvie, H.P., Neal, C., Warwick, A., White, J., Neal, M., Wickham, H., Hill, L.K., Andrews, M.C., 2002b. Phosphorus uptake into algal biofilms in a lowland chalk river. Sci. Total. Envir., 282/
283, 353373.
Jarvie, H.P., Lycett, E., Neal, C. and Love, A., 2002c. Patterns in nutrient concentrations and biological quality indices across the upper Thames basin, UK. Sci. Total Envir., 282/283, 263294. Kirchner, J.W., Feng, X. and Neal, C., 2000. Fractal stream chemistry and its implications for contaminant transport in catchments. Nature, 403, 524527.
Kirchner, J.W., Feng, X. and Neal, C., 2001. Catchment-scale advection and dispersion as a mechanism for fractal scaling in stream tracer concentrations. J. Hydrol. 254, 81100. Mainstone, C.P. and Parr, W., 2002. Phosphorus in rivers - ecology
and management. Sci. Total Envir., 282-283, 2548.
Marsh, T.J. and Lees, M.L., 2003. Hydrological data UK:
Hydrometric Register and Statistics, 1991-95. Institute of
Hydrology and British Geological Survey, Institute of Hydrology, Wallingford, UK.
Marsh, T.J. and Sanderson, F.J., 1997. A review of hydrological conditions throughout the period of the LOIS monitoring programme considered within the context of the recent UK climate volatility. Sci. Total Envir.., 194/195, 5970.
Neal, C., 1997. Boron water quality of the Plynlimon catchments.
Hydrol. Earth Syst. Sci., 1, 619627.
Neal, C., 2001. The potential for phosphorus pollution remediation by calcite precipitation in UK freshwaters. Hydrol. Earth Syst.
Sci., 5, 4958.
Neal, C., 2002a. Calcite saturation in eastern UK rivers. Sci. Total
Envir., 282/283, 311326.
Neal, C., 2002b. From determination to fractal processing, structural uncertainty and the need for continued long-term monitoring of the environment: the case of acidification. Hydrol.
Process., 16, 2481-2484.
Neal, C. and Whitehead, P.G., 2002. Water quality functioning of lowland permeable catchments: inferences from an intensive study of the River Kennet and Upper River Thames: an introduction. Sci. Total Envir., 282/283, 37.
Neal, C., Smith, C.J., Jeffery, H.A., Jarvie, H.P. and Robson, A.J., 1996. Trace element concentrations in the major rivers entering the Humber estuary, N. E. England. J. Hydrol., 182, 3764. Neal, C., Robson, A.J., Jeffery, H.A., Harrow, M.L., Neal, M.,
Smith, C.J. and Jarvie, H.P., 1997. Trace element inter-relationships for the Humber rivers: inferences for hydrological and chemical controls. Sci. Total Envir., 194/195, 321343. Neal, C., Neal, M., Wickham, H. and Harrow, M., 2000a. The
water quality of a tributary of the Thames, the Pang, southern England. Sci. Total Envir.., 251/252, 459476.
Neal, C., Jarvie, H.P., Howarth, S.M., Whitehead, P.G., Williams, R.J., Neal, M., Harrow, M. and Wickham, H., 2000b. The water quality of the River Kennet: initial observations on a lowland chalk stream impacted by sewage inputs and phosphorus remediation . Sci. Total Envir., 251/252, 477496.
Neal, C., Williams, R.J., Neal M., Bhardwaj, L.C., Wickham, H., Harrow, M. and Hill, L.K., 2000c. The water quality of the River Thames at a rural site downstream of Oxford. Sci. Total. Envir.,
251/252, 441458.
Neal, C., Jarvie, H.P., Wade, A.J. and Whitehead, P.G., 2002a. Water quality functioning of lowland permeable catchments: inferences from an intensive study of the River Kennet and upper River Thames. Sci. Total Envir., 282/283, 259270.
Neal, C., Watts, C.D. and Williams, R.J., 2002b. Diurnal and longer term patterns in carbon dioxide and calcite saturation for the River Kennet, south-eastern England. Sci. Total Envir., 282/
283, 205231.
Neal, C., Neal, M., Wyatt, R., Wickham, H., Hill, L. and Hewett, N., 2004a. Rainfall and runoff water quality of the Pang and Lambourn, tributaries of the River Thames, south eastern England. Hydrol. Earth Syst. Sci., 8, 601613.
Neal, C., Jarvie, H.P., Neal, M., Love, A.J., Hill, L. and Wickham, H., 2004b. Water quality of treated sewage effluent in a rural area of the upper Thames Basin, southern England, and the impacts of such effluents on riverine phosphorus concentrations.
J. Hydrol., in press.
OShea, L., 2001. An economic approach to reducing water pollution: Point and diffuse sources. Sci. Total Envir., 282/283, 4964.
Prior, H. and Johnes, P.J., 2002. Regulation of surface water quality in a Cretaceous Chalk catchment: an assessment of the relative importance of in-stream and wetland processes. Sci. Total Envir.,
282/283, 159174.
Wade, A.J., Whitehead, P.G., Hornberger, G.M. and Snook, D.L., 2002a. On modelling the flow controls on macrophyte and epiphyte dynamics in a lowland UK catchment: River Kennet, southern England. Sci. Total. Envir., 282/283, 375394. Wade, A.J., Whitehead, P.G., Hornberger, G.M., Jarvie, H.P., and
Flynn, N., 2002b. On modelling the impacts of phosphorus stripping at sewage works on in-stream phosphorus and macrophyte/epiphyte dynamics: a case study for the River Kennet. Sci. Total Envir., 282/283, 395416.
Whitehead, P.G., Johnes, P.J. and Butterfield, D., 2002. Steady-state and dynamic modelling of nitrogen in the River Kennet: Impacts of land use change since the 1930s. Sci. Total Envir.,
282/283, 417434.
Appendix
Table A1. Pang water quality statistics for the River at Frilsham, Bucklebury and upstream of the Blue Pool. Included in the table are
water quality statistics for the Blue pool.
FRILSHAM BUCKLEBURY UPSTREAM BLUE POOL BLUE POOL
avg min max avg min max avg min max avg min max
EC µScm-1 636 464682 624367 676 616 537 655 614567 644 SS. mgl-1 3.1 0.3 10.2 7.1 0.3 151.8 5.2 0.1 14.0 1.6 0.0 5.6 pH 7.66 7.47 7.89 7.99 7.43 8.27 7.69 7.24 7.95 7.20 7.09 7.39 ALK µEq l-1 5163 4398 5713 4925 1652 5453 4897 3907 5679 4667 4235 4844 EpCO2 18.4 10.9 27.6 8.6 4.5 18.2 18.2 8.3 44.5 48.4 32.6 61.6 CaCO3 sat 0.72 0.40 0.96 0.99 -0.41 1.340.72 0.241.02 0.20 0.06 0.42 Na mgl-1 9.30 8.27 18.17 10.77 8.91 24.54 10.82 9.63 12.52 10.87 9.27 12.77 K mgl-1 2.31 1.47 5.63 2.77 1.75 7.34 2.61 2.03 3.93 2.55 2.07 3.84 Ca mgl-1 117.0 96.6 123.8 112.6 50.2 122.7 112.9 91.0 122.5 109.2 99.0 114.0 Mg mgl-1 1.77 1.65 2.00 2.08 1.79 4.55 2.87 2.20 4.36 3.39 2.50 4.12 Cl mgl-1 18.2 16.0 23.5 20.1 17.5 25.0 20.5 18.0 24.0 22.7 21.0 26.0 SO4 mgl-1 11.7 9.0 32.0 13.5 10.0 33.0 16.5 14.0 21.0 21.7 18.0 24.0 F mgl-1 0.17 0.12 0.26 0.17 0.12 0.22 NA NA NA NA NA NA NO3-N mgl-1 8.00 6.44 10.39 8.01 2.60 10.27 6.97 4.97 8.40 7.08 6.37 7.77 NO2-N mgl-1 0.06 0.00 0.18 0.06 0.00 0.15 NA NA NA NA NA NA NH4-N mgl-1 0.05 0.02 0.12 0.06 0.01 0.65 0.01 0.00 0.08 0.02 0.00 0.18 TN mgl-1 8.747.20 12.20 8.85 4.70 11.80 NA NA NA NA NA NA Inorg N mgl-1 8.11 6.53 10.548.13 3.02 10.41 NA NA NA NA NA NA Org N mgl-1 0.63 0.02 1.66 0.72 0.05 1.97 NA NA NA NA NA NA SRP-P µgl-1 63 20 313 140 39 1005 77 11 217 31 13 114 DHP-P µgl-1 14 0 50 21 0 198 19 4 42 15 0 42 PP µgl-1 12 0 52 23 1 27427 0 112 9 0 49 DOC mgl-1 1.53 0.80 4.20 2.23 0.90 12.00 1.14 0.90 4.20 1.09 0.80 1.70 Si mgl-1 7.146.00 7.80 6.96 5.50 7.80 7.12 5.00 8.00 7.446.90 7.80 Al µgl-1 11.2 0.0 42.2 13.5 0.0 266.8 9.1 3.2 37.2 7.2 0.0 25.4 B µgl-1 15.1 9.6 21.420.8 12.1 58.8 24.411.0 41.0 20.3 6.0 29.0 Ba µgl-1 30.426.3 34.7 29.7 22.435.3 28.7 24.432.7 29.3 25.1 33.5 Co µgl-1 0.3 0.0 14.6 0.2 0.0 1.0 0.1 0.0 0.4 0.1 0.0 0.5 Cr µgl-1 0.2 0.0 7.3 0.1 0.0 0.8 1.0 0.0 14.4 0.8 0.0 3.8 Fe µgl-1 9.8 1.8 125.5 21.6 3.2 362.5 22.8 0.4153.9 11.1 0.8 79.0 Mn µgl-1 2.2 0.8 16.0 2.8 0.5 27.44.1 0.5 8.0 1.2 0.1 7.1 Ni µgl-1 2.2 0.1 5.3 2.3 0.2 4.6 1.8 0.0 20.7 1.2 0.1 3.8 Sr µgl-1 278 229 302 278 159 346 301 237 378 347 299 395 Zn µgl-1 19.1 0.6 194.1 16.7 0.0 53.3 13.2 1.4 266.4 10.9 0.2 95.2
Withers, P.J.A. and Lord, E.I., 2002. Agricultural nutrient inputs to rivers and groundwaters in the UK: policy, environmental management and research needs. Sci. Total Envir., 282/283, 9 24.