Development of a Gamma Ray Telescope for Online Synovial Dosimetry
In Boron Neutron Capture Synovectomy
by Hongyu Jiang
M.E. Engineering Physics (1999) Tsinghua University B.S. Engineering Physics (1994)
Tsinghua University
Submitted to the Department of Nuclear Engineering in Partial Fulfillment of the Requirements for the Degree of
Doctor of Philosophy in Nuclear Engineering At the
Massachusetts Institute of Technology June 2003
2003 Massachusetts Institute of Technology All rights reserved
Signature of Author………... Department of Nuclear Engineering
May 25,2003
Certified by………... Jacquelyn C. Yanch Professor of Nuclear Engineering and Whitaker College of Health Sciences and Technology Thesis Supervisor
Read by………. Ruth E. Shefer President, Newton Scientific, Inc. Thesis Reader
Accepted by………... Jeffrey A. Coderre Chairman, Department Committee on Graduate Students
Development of a Gamma Ray Telescope for Online Synovial Dosimetry
In Boron Neutron Capture Synovectomy
by Hongyu Jiang
Submitted to the Department of Nuclear Engineering In May, 2003 in Partial Fulfillment of the Requirements for the Degree of Doctor of Philosophy in
Nuclear Engineering
Abstract
Boron Neutron Capture Synovectomy (BNCS) is a novel application of the 10B(n,α) reaction for potential treatment of rheumatoid arthritis. During BNCS clinical trials, real-time knowledge of boron dose delivered to the synovium is necessary so that the remaining irradiation time can be determined. A 478 keV photon is emitted following 94% of boron neutron capture reactions, and detection of 478 keV photons emitted from the synovium provides a potential approach for online monitoring of the accumulated synovial boron dose. This thesis explores the feasibility of developing a telescope system for online determination of synovial boron dose for accelerator-based BNCS. The Monte Carlo code MCNP was used to design the telescope system. The neutron and photon background distributions in the radiation vault at the Laboratory for Accelerator Beam Applications (LABA) at MIT were explored via Monte Carlo simulations, and an optimum position for the photon detector was determined. Collimator and detector shields were designed, and significant reduction of neutron flux and background count at the detector location was observed. Sufficient boron photon counts from the synovium were predicted, and the feasibility of using a NaI detector instead of an HPGe detector was also confirmed. Next, a telescope system was built in the radiation vault at LABA. A background peak overlapping the energy region of 478 keV photons was observed in the measured spectrum by a 10.2 cm × 10.2 cm NaI(Tl) detector. Origin and direction of background particles entering the detector were explored, and further background reduction was achieved. The composition of the background peak was also analyzed. Experimental characterization of the telescope system was performed. It was confirmed that boron photons from the synovium could be detected in the presence of background counts. The count saturation became significant when the boron concentration was over 10,000 ppm, as predicted by simulations. Experimental results were compared with simulation results, and the overall agreement was within 10–20%. Reconstruction approaches for determination of the synovial boron dose based on the measured boron photon count and additional information such as anatomic configuration of the joint and boron compound distribution were generated.
Thesis Supervisor: Jacquelyn C. Yanch
Acknowledgements
I would like to thank Prof. Yanch for her direction, support, and patience. I had a very pleasant time working with her. Four years ago, I came to this country from a remote land, with very little preparation for a new life. I was so lucky to be under the supervision of Prof. Yanch. Thanks to her, I had always felt comfortable and confident in my work and life. I learned too much from her, and I remembered everything she did to help me improve my English. My appreciation to her cannot be simply described in words.
I give my thanks to Ruth and Bob for answering my questions and solving my problems about the accelerator. I could not have finished my experiments without their help. A special thank to Ruth for her kindness to serve as the thesis reader.
I would also like to thank Dr. Lanza for being on my Ph.D. committee, and for giving me cool ideas on my thesis. He is such a kind and knowledgeable person. It was always fun to talk with him.
Thanks to Prof. Coderre. It was wonderful experience to work with him on the course 22.09/22.104.
I give my thanks to Rong for spending so much time in helping me finish my experiments during
weekends and for her special contribution to my thesis. I owe her too much.
I’d like to thank Rong, Ray, and Michael for being my operator. I would also like to extend my thanks to former members of LABA, David, Joanne, Brandon, and Susan for helping me and teaching me how to operate the accelerator. A special thank is given to Xuping. It had been always pleasant and valuable to have discussions with her.
I would like to thank Dusadee, although she was not a “formal” member of LABA. I was so lucky to have a chance to know a person with such a great personality.
My parents deserve special thanks. They had never posed any pressure on me, and they had been always ready to try their best to help me. Thanks to them, I could do what I wanted. I also owe too much to them. Lastly, I give my thanks to Rachel for all her kindness and help. She made my life much easier.
Table of Contents
List of Figures………7
List of Tables………...10
Chapter 1: Introduction……….11
Chapter 2: Background………………..13
2.1 Boron Neutron Capture Synovectomy (BNCS)………13
2.2 Boron dose determination……….14
2.2.1 Telescope system at Petten………..15
2.2.2 Differences between BNCS and BNCT………..17
2.2.3 Potential differences between the telescopes at Petten and at LABA……….17
Chapter 3: Background Investigation Using Monte Carlo Simulations………...19
3.1 Primary problems to be solved in simulations………..19
3.1.1 Locations of the detector……….19
3.1.2 Feasibility of the telescope system………..19
3.1.3 Parameters of the telescope system……….20
3.1.4 Selection of the detector………..20
3.2 Special issues in conduction Monte Carlo simulations………21
3.3 BNCS model for simulations………22
3.3.1 Accelerator neutron beam………...22
3.3.2 BNCS model for simulation………...23
3.3.3 Synovium representation and boron compound……….24
3.3.4 Coordinate system………..25
3.4. Ultimate fate of the source neutrons………25
3.4.1 Neutron absorption and boron dose in the synovium……….25
3.4.2 Neutron absorption in other components………...28
3.5 Neutron and photon spatial distribution inside the therapy room……….29
3.5.1 Neutron flux in the therapy room………...30
3.5.2 Photon flux in the therapy room……….32
3.5.3 Influence of the concrete components………36
3.5.4 Approximate direction of the detector………...38
3.6 Conclusions………...41
Chapter 4: Design of the telescope system………...43
4.1 Collimation and detector shielding………...43
4.1.1 Collimator and detector shield………...43
4.1.2 Viewing region of the detector and photon arrival probability………..44
4.1.3 Selection of the parameter l………50
4.1.4 Thickness of boronated polyethylene and lead in collimator……….51
4.2 Choice of suitable location of the detector………...52
4.2.1 Comparison at a detector location before and after shielding and collimation………..53
4.2.2 Comparison of various directions and positions………57
4.2.2.1 L dependence……….…………..60
4.2.2.2 R dependence (r dependence)………..60
4.2.2.3 l dependence……….61
4.3.1 Neutron count……….65
4.3.2 Boron photon count………66
4.3.3 511 keV annihilation photon count………67
4.3.4 Hydrogen photon count………..68
4.3.5 Lithium polyethylene in front of the detector………68
4.3.6 Function of the side and back graphite reflectors………..68
4.3.7 Detector outside of the therapy room……….70
4.4 Limitations of the Monte Carlo method………...71
4.5 Conclusions………..72
Chapter 5 Installation of the telescope system in the LABA radiation vault………...73
5.1 Set up of the physical telescope within the treatment facility………..73
5.1.1 Locations of the photon detector and the collimator………..73
5.1.2 Photon detector………...74
5.1.3 Collimator and detector shield………...75
5.1.4 Phantoms of the human body and the synovium………...76
5.1.5 Preparation of synovium phantoms………76
5.1.6 Schematic of the telescope system……….79
5.1.7 Accessory electronics system and operational parameters………80
5.2 Collimation………...81
5.3 Detected photon spectrum………81
5.4 Exploring the spatial distribution of the background counts………83
5.4.1 Photon and neutron background test on left, right, top, bottom, and back sides………...85
5.4.2 Background test on the front side of the detector………..86
5.4.3 Gold foil experiment………..89
5.5 Examination of the alignment………...91
5.6 Further background reduction………...92
5.6.1 Boronated polyethylene……….92
5.6.2 Lithiated polyethylene……...……….93
5.7 Conclusions……… ……….95
Chapter 6: Background analysis of the boron peak………...97
6.1 Neutron interactions inside NaI detectors………97
6.2 Photon contribution to the background boron peak………...100
6.3 Direct photon contribution……….102
6.4 Photon count from (n,γ) reactions inside the NaI detector……….103
6.4.1 442 keV photons from neutron capture in iodine……….103
6.4.1.1 Estimation of 443 keV photon count rate with 128I………103
6.4.1.2 Estimation of 443 keV photon count rate with the137 keV peak……….106
6.4.2 472 keV photons from neutron capture in sodium………..106
6.5 Photon counts from other neutron reactions inside the detector………108
6.5.1 (n,n′γ) photons……….108
6.5.2 511 keV annihilation photons………..109
6.5.3 478 keV photons from 10B contained in PM tube………109
6.5.4 Monte Carlo estimation………...110
6.6 Conclusions………112
Chapter 7: Experimental characterization of the telescope system………113
7.1 Boron photon detection………..113
7.2 Comparison between simulation and experimental results………119
7.2.2 Boron photon contribution probability………122
7.2.3 Estimation of the boron photon rate from the synovium……….124
7.3 Further improvement by rearranging the back and side reflectors……….126
7.4 Dead time issue………..126
7.5 Development of a general telescope system for BNCS……….126
7.6 Conclusions………127
Chapter 8: Reconstruction of synovial boron dose………...129
8.1 Basic problem……….129
8.2 Non-uniformity of [B] and Φ in the synovium………..130
8.3 Boron dose determination………..132
8.3.1 One measurement approach……….132
8.3.2 Estimation of dose reconstruction factors………...134
8.3.2.1 Photon detection factor ……….134
8.3.2.2 Photon production factor………...135
8.3.3 Multiple measurement approach……….137
8.4 Additional issues………140
8.4.1 Boron photons from fast neutrons captured by boron……….141
8.4.2 Influence from boron deposited in normal tissue………141
8.5 Error analysis………..141
8.6 Conclusions………143
Chapter 9: Conclusions and future work………..144
9.1 Conclusions………144
9.2 Recommendations for future work……….145
List of Figures
2.1: Schematic of the LABA accelerator and the radiation vault………..14 2.2: (a) Schematic of the telescope system at HFR in Petten, which includes an HPGe detector, a
collimator and the ceiling serving as the detector shield; (b) the detected photon spectrum by the HPGe detector……….16 3.1: Simulated boron photon peak and 511 keV photon peak with Matlab for (a) a HPGe detector with a FWHM of 2 keV at 478 keV and (b) a NaI detector with a FWHM of 42 keV at 478 keV……21 3.2: Schematic of beam tube, 9Be target, and moderator/reflector assembly for BNCS neutron beam
production……...………23 3.3: Angular distributions of neutrons emitted from 9Be target in two angular bins: (0°, 10°) and
(110°, 180°). The maximum neutron energy is over 6 MeV……….23 3.4: MCNP simulation model for BNCS, including target-moderator-reflector assembly, boron-containing shielding wall, anthropomorphic phantom, and back reflector (side reflectors are not visible). The space is divided into four quadrants: I (0° < ϕ <90°), II (90° < ϕ <180°), III (180° < ϕ <270°), and IV (270° < ϕ <360°). The slice shown is the X-Y plane at θ = 90°………...24 3.5: Number of 10B(n,α) reactions in the synovium as a function of the synovial boron concentration
………..………..27 3.6: Synovial boron dose per ppm of 10B as a function of the synovium boron concentration……….27
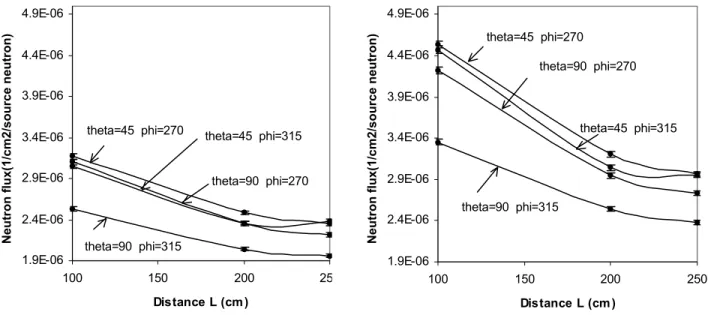
3.7: Thermal and total neutron flux estimated at three different synovium-to-detector distances (100 cm, 200 cm, and 250 cm) inside the radiation vault (26 directions for each distance), with the presence of the floor, ceiling and walls of the radiation room………31 3.8: Thermal and total neutron flux as a function of synovium-to detector distance in four directions in regions III and IV with the presence of the floor, ceiling and walls of the radiation room………32 3.9: Simulated photon flux spectrum at position (200 cm, 90°, 270°)………...33 3.10: 478 keV, 511 keV, and 2223 keV photon flux estimated at three different synovium-to-detector distances (100 cm, 200 cm, and 250 cm) inside the radiation vault (26 directions for each distance), with the presence of the floor, ceiling and walls of the radiation room……….34 3.11: 478 keV, 511 keV and 2223 keV photon flux as a function of synovium-to-detector distance in
four directions in regions III and IV with the presence of the floor, ceiling and walls of the radiation room……….36 3.12: Thermal and total neutron flux estimated at three different synovium-to-detector distances (100 cm, 200 cm, and 250 cm) inside the radiation vault (26 directions for each distance), without the presence of the floor, ceiling and walls of the radiation room………39 3.13: 478 keV, 511 keV, and 2223 keV photon flux estimated at three different synovium-to-detector distances (100 cm, 200 cm, and 250 cm) inside the radiation vault (26 directions for each distance), without the presence of the floor, ceiling and walls of the radiation room…………...40 4.1: Schematic of the telescope system including photon detector, collimator for limiting the view
angle of the detector to the synovium, and detector shield for reducing background counts and detector damage caused by fast neutrons………43 4.2: Illustration of the viewing field of the detector (R) to the synovium after a collimator is positioned between the synovium and the detector. In case (a), the entire detector surface receives boron photons from the synovium; in case (b) and (c), a part of the detector surface is not used for boron photon detection, either because the aperture in the collimator is too small (case (b)) or the detector is too close to the collimator (case (c))……….45 4.3: (a) illustrates a fact that photons emitted at different regions in the detector viewing region have
and photons at O′ have zero probability. (b) shows a special case: (l+d)/L=r/a . The projection area on the detector surface for any point P off point O is less than the projection area for point O,
which is πa2……….47
4.4: Schematic of the photon arrival probability curve………..48 4.5: A plot showing that after the detector shield is in position, the formula of the detector viewing
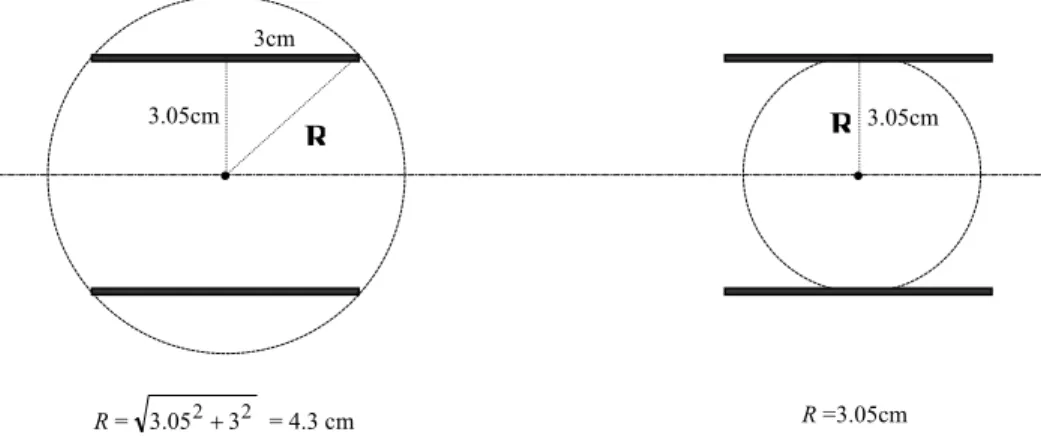
region derived for cases in Figures 4.2 and 4.3 is still valid if the empty space between the collimator and the detector shield is imagined to be filled with shielding material and d is replaced with d′………...50 4.6: Configuration for investigating the effectiveness of Rico-Rad in neutron shielding……….51 4.7: 2D slice of the synovium showing: if R = 4.3 cm, the entire synovium is visible to the detector
(the entire synovium is inside the detector viewing field represented with a circle with a radius
R); on the other hand, if R = 3.05 cm, a part of the synovium is outside the viewing field of the
detector………...……….53 4.8: Simulated photon flux spectrum at position (200 cm, 90°, 270°): (a) before collimation and
detector shielding (same as Figure 3.9); (b) after the collimation and detector shielding (two sizes of aperture and two boron concentrations)……….56 4.9: Neutron flux at various locations (3 directions and 4 distances) for two sizes of aperture………58 4.10: 478 keV photon flux at various locations (3 directions and 4 distances) for two sizes of aperture
………58 4.11: 511 keV photon flux at various locations (3 directions and 4 distances) for two sizes of aperture
………59 4.12: 2223 keV photon flux at various locations (3 directions and 4 distances) for two sizes of aperture
………59 4.13: Boron photon count rate at the detector surface under various synovial boron concentrations,
normalized at 1 mA of beam current………..67 4.14: Number of (n,α) reactions in the synovium as a function of the synovial boron concentration, with
and without the presence of the back/side reflectors and a 7-cm diameter hole in the back reflector…………..………69 5.1: Picture of the NaI detector used in experiments. The 10.2 cm × 10.2 cm NaI crystal and the PMT are encapsulated inside the aluminum shell………..75 5.2: (a) Division of the cylinder (1.5 cm in radius) into eight concentric equal-area regions; (b)
fraction of 10B(n,α) reactions occurred in the eight regions……….77
5.3: Schematic of the configuration of experimental setup, including the beam part (beam tube, target, and moderator/reflector assembly), the human body phantom, and the telescope system………80 5.4: Photon spectrum collected by the NaI detector under the configuration illustrated in Figure 5.3
………82 5.5: Photon spectra at 0 ppm and 10,000 ppm of synovial boron concentration and stripped spectrum
derived from subtraction of the 0 ppm spectrum from the 1,0000 ppm spectrum……….83 5.6: Schematic of the NaI detector, showing that background particles can enter the detector from six
directions………84 5.7: Boron peak and low energy region in the photon spectrum before and after the addition of 0.11
cm cadmium on all side of the detector except for the front side………..85 5.8: Boron peak and low energy region in the photon spectrum before and after the addition of the
additional lead in front of the detector………...87 5.9: Hydrogen peak in the photon spectrum before and after the addition of the additional lead in front of the detector……….88 5.10: Boron peak and low energy region in the photon spectrum before and after the addition of the
5.11: 416 keV photon counts measured from gold foils irradiated with neutrons at various locations in
the Rico-Rad shield………90
5.12: Illustrations of the nine positions for attachment of the Cd patch on the detector surface, and the corresponding boron photon loss after the attachment………92
5.13: Photon spectra before and after the addition of additional boronated polyethylene in front of the detector……….93
5.14: Photon spectra before and after the addition of a thin piece of lithiated polyethylene on the frond surface of the detector………..94
5.15: Photon spectra under the initial and the final shielding conditions………..95
6.1: Pulse height distribution arising from neutron interaction with 7.6 cm diameter × 7.6 cm long NaI(Tl) detectors (a) from Hausser et al.and (b) from Inada………99
6.2: Illustration of a different peak channel of the background “boron” peak from that of the 511 keV annihilation peak………..101
6.3: Decay scheme of 128I……….103
6.4: Energy spectra by the NaI detector after 10 to 60 minutes of neutron bombardment…………..105
6.5: Decay scheme of 24Na………...106
6.6: Neutron induced photon flux in the NaI crystal………110
7.1: (a) Boron peak and (b) hydrogen peak under various synovial boron concentrations (no water in the leg box)………...114
7.2: (a) Boron peak and (b) hydrogen peak under various synovial boron concentrations (water in the leg box)……….115
7.3: Count rate of (a) boron photons emitted from the synovium and (b) hydrogen counts under various synovial boron concentrations………..116
7.4: Stripped photon energy spectra for (a) water in the leg box and (b) no-water in the leg box under various boron concentrations in the synovium phantom………..117
7.5: Number of 10B(n,α) reactions in the synovium for four different configurations of the synovium phantom………...……….121
7.6: Schematic illustration of the peculiarity of the plane configuration……….122
7.7: Photon contribution probability as a function of the radius of the aperture in the collimator for the plane and cylindrical shell synovium phantom configurations………123
7.8: Comparison of experimental results with simulation results for the synovium phantom with a configuration of 4 cm × 4 cm surface………...125
8.1: Illustration of the non-uniformity of thermal neutron flux in the joint……….131
8.2: Illustration of the division of the synovium into small voxels………..132
8.3: Division of the 4 cm × 4 cm synovium plane phantom into 16 1cm × 1 cm voxels……….137
8.4: (a) Schematic illustration of the configuration used for obtaining multiple measurements of B. The synovium is composed of 4 segments, with centers at P1, P2, P3, and P4. The collimator, detector shield, and the BNCS beam configuration were all included in the simulation model, but not shown here. The location of the detector and the detector shield are fixed, and the detector can be rotated to change its viewing field toward the synovium. Two positions of the detector are shown, with the detector viewing P0, and P1,respectively. However, since the rotation angle of the detector between the two positions is only 0.8°, the difference in the two positions is not discernable. (b) An enlargement of the synovium model showing dimensions………...139
List of Tables
3.1: Synovial dose estimated with three different methods (unit: Gy/source neutron)……….28 3.2: Neutron absorption in various components in BNCS model (boron concentration: 10,000 ppm)…28 4.1: Radius of the aperture in the collimator under various combinations of distance L and radius R….53 4.2: Particle flux before and after collimation and shielding……….54 4.3: Values of figures of merits for locations in three directions (l=50 cm)………..60 4.4: Values of figures of merits for locations in six directions in regions III and IV (l=100 cm)……….61 4.5: Number of neutrons and photons arriving at the detector surface under various synovial boron
concentrations……….65 7.1: Simulated boron photon counts for the 4cm × 4cm plane synovium configuration (/s)…………...124 7.2: Simulated boron photon counts for the cylindrical shell synovium configuration (/s)……….124 8.1: Simulated number of boron photons emitted from the voxels and the photon detection factors….137 8.2: Reconstructed number of boron photons emitted from the voxels at a 100 µA beam current…….137
Chapter 1 Introduction
Boron Neutron Capture Synovectomy (BNCS), now under investigation at MIT’s Laboratory for Accelerator Beam Applications (LABA), is potentially a novel modality for treating rheumatoid arthritis. Rheumatoid arthritis is a systemic disease characterized by inflammation of the synovium. It can be treated with drugs and by surgical removal of the synovial membrane (surgical synovectomy). Radiation synovectomy by intra-articular injection of beta-emitting nuclides has been extensively used in other countries, but it has not been approved in the United States because of concerns regarding leakage of the nuclide from the joint. Similar to BNCT (Boron Neutron Capture Therapy), BNCS includes two consecutive steps. First, a stable 10B labeled compound is injected into the synovial fluid. Next, after the
compound has sufficiently accumulated in the inflamed synovium, the joint is irradiated with a low-energy neutron beam. As the low-energy of the heavy charged particles emitted after 10B neutron capture is
deposited locally to regions loaded with boron, the synovium is ablated and the symptoms of rheumatoid arthritis are thereby relieved.
During BNCS clinical trials, real-time knowledge about the boron dose delivered to the synovium is necessary so that the remaining irradiation time can be determined. However, online determination of the synovial boron dose is a very difficult problem. An approach for prompt measurement of the boron concentration in brain tumors has been proposed in Petten, the Netherlands, which adopted a scheme of photon detection with a telescope configuration. The goal of this thesis work is to design and build a gamma ray telescope system for online estimation of the synovial boron dose in BNCS. Compared to the system in Petten, new designs are required at LABA because of the differences between BNCT and BNCS.
Chapter 2 gives the overall background introduction to BNCS and the basic principles of online boron dose determination. A telescope system, which has already been set up and tested in Petten, the Netherlands, will be described, and differences in the overall approach when used for BNCS will be discussed.
Chapter 3 focuses on the investigation of background radiation in the therapy room. Monte Carlo simulations have been performed to explore the spatial distribution of neutrons and photons during joint irradiation. The purpose is to find the approximate position for the photon detector, the central component of the telescope system. Ideally, the detector will be positioned at a location with the lowest neutron and photon backgrounds to reduce the requirements for detector shielding.
Chapter 4 describes the simulations conducted to study the feasibility of the telescope system for BNCS. The collimator and detector shield are added to the system. The performance of the telescope system under various conditions is compared. The possibility of using a NaI (sodium iodine) detector
instead of an HPGe (high purity germanium) detector is discussed. The optimal position of the photon detector is chosen, based on the quantitative analysis of several figures of merit.
Chapter 5 depicts the details of assembling a real telescope system in the BNCS radiation vault at MIT LABA. An introduction to the experimental system is given. Special issues such as synovium phantom preparation and system alignment are covered. The detected photon spectrum by a NaI detector is displayed. Special attention is paid to the background analysis to further reduce the background count rate. The performance of the system after various improvements is presented and discussed.
Chapter 6 gives a more thorough exploration of the background boron peak. The purpose of this chapter is to search for the approximate composition of the background peak. The separate count contributions from several potential sources are roughly determined with the help of experiments and Monte Carlo simulations.
Chapter 7 introduces the experiments performed to characterize the system. Whether or not the boron photons from the synovium can be detected in the presence of background counts is confirmed. Results from simulations and experiments are compared to verify whether the Monte Carlo method is a predictive tool in developing the telescope system. The self-shielding effect is emphasized through the comparison of four different configurations of the synovium phantom.
Chapter 8 probes the reconstruction approaches to determine the synovial boron dose, based on the measured boron photon count and additional information.
Chapter 9 summarizes the development of this telescope system, and gives recommendations for future work.
Chapter 2 Background
2.1 Boron Neutron Capture Synovectomy (BNCS)
Rheumatoid arthritis is a systemic disease characterized by inflammation of the synovium, the membrane lining the inner joint capsule of articulating joints1,2. The cause of this disease is still unclear.
In normal joints, the synovium is very thin (the thickness of several cells). However, in joints with rheumatoid arthritis, after proliferation of the synovial cells, the synovium increases in thickness to several millimeters, and the amount of synovial fluid in the joint cavity increases as well.
Rheumatoid arthritis is treated with anti-inflammatory drugs, and, when these drugs fail, surgical removal of the synovial membrane is performed. Radiation synovectomy is an alternative to surgery. In other countries, radiation treatment with beta radioisotopes has been widely adopted. During treatment, a beta-emitting radioisotope is injected into the synovial fluid, and the kinetic energy carried by the beta particles is deposited in the synovium, killing the cells. However, in the United States, the technique has not been approved for routine clinical use because of the worry about the potential risk of isotope leakage from the joint3.
At MIT LABA, a potential novel modality for arthritis treatment with radiation is under investigation 4-6. Instead of injecting radioisotopes, a 10B-containing, non-radioactive compound is injected into the
synovial fluid. After sufficient boron has accumulated in the synovium, the joint is irradiated with a low-energy neutron beam. Boron neutron capture reactions (10B(n,α)7Li) will occur in the boron-loaded
synovium. If enough reactions occur, the kinetic energy released with the two heavy charged particles (α and 7Li) will kill the synovial cells.
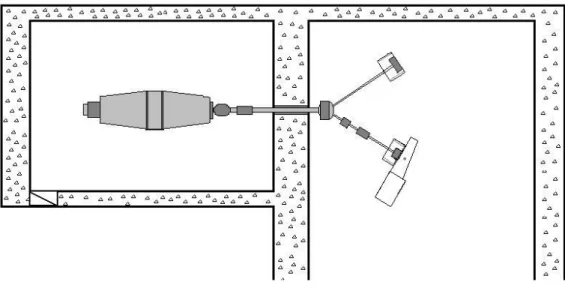
A schematic of the LABA accelerator7 and radiation vault at LABA used in the development of
several aspects of BNCS is presented in Figure 2.1. The BNCS neutron beam8 is generated with a tandem
accelerator. The BNCS beam tube, a beryllium target and the associated neutron moderator and reflector are located inside the radiation vault. Many nuclear reactions can be used for neutron beam production in BNCS. The nuclear reaction used in this thesis is 9Be(d,n), and the kinetic energy of incident deuterons is 1.5 MeV. More details about the neutron beam will be introduced in the next chapter.
Figure 2.1 Schematic of the LABA accelerator and the radiation vault.
2.2 Boron dose determination
An issue in BNCS is the determination of the synovial boron dose. Because of the similarities between BNCT9,10 and BNCS, it could be helpful to recall the procedures in BNCT. In BNCT, before neutron irradiation, patients are given a boron-containing compound. The compound enters into the blood, and is conveyed to the target tissue. An assumption of equal boron concentrations in blood and in healthy brain tissue is made, so the boron concentration in the brain tissue is available through analysis of blood samples before, during, and after the treatment. The boron dose can then be deduced from information regarding boron concentration. On the other hand, in BNCS, the boron compound is injected directly into the synovial fluid4, and hence the assay of blood samples is not useful in determining the boron
concentration in the synovium or in determining the synovial dose. Thus, it is crucial to develop a new approach to determine the synovial dose during irradiation. In particular, an online approach for monitoring the synovial boron dose or dose rate in the synovium during the clinical treatment will be greatly desirable, since it allows more accurate dose delivery.
A method proposed for online boron concentration determination is based on the detection of the 478 keV photons emitted following neutron absorption in 10B11-13. The expression of boron neutron capture is
n+10B → α+7Li* Q = 2.310 MeV (branching ratio: 94%) 7Li* → 7Li + γ (478keV)
Ninety-four percent of the produced 7Li nuclei are at their first excited state, and a 478 keV photon is released as the 7Li* nucleus decays to its ground state. Because of the Doppler effect (the half-life of the first exited state of 7Li* is so short that the photon is emitted before the nucleus stops in the medium), the energy of the emitted photons ranges through an interval of 15 keV (470 to 485 keV). Throughout this dissertation, this “478 keV photon” is sometimes referred to as the “boron photon”, but actually, it is released from lithium nuclei.
For boron dose determination, what is actually required is knowledge regarding the number of boron neutron captures, not the boron concentration. The average kinetic energy deposited in each 10B(n,α)7Li
reaction is 94%×2.310 MeV+6%×2.792 MeV = 2.339 MeV. Therefore, if the number of boron neutron captures is provided, the total energy deposited via α and 7Li nuclei is known. Then, the absorbed boron
dose is obtained by dividing the energy by the mass of the boron-loaded target tissue. Detection of the 478keV photons offers a possible way for online measurement of the number of 10B(n,α)7Li reactions. By
knowing the fraction of emitted boron photons actually detected, an estimate of synovial boron dose becomes possible.
A brief overview of the procedure for synovial boron dose determination is as follows: after the patient is in position, and 10B injection and post-administration accumulation in the synovium are accomplished,
the joint with rheumatoid arthritis is irradiated with a neutron beam produced via an accelerator reaction; neutrons are captured in the boron in the synovium, and 478 keV boron photons are emitted isotropically. A very small fraction of the boron photons from the synovium will arrive at the detector and ultimately be detected; with the aid of additional information such as solid angle of the detector to the synovium, photon attenuation in the joint, and full detection efficiency of the detector, the number of 10B(n,α) reactions occurred in the synovium will be determined using appropriate reconstruction algorithms and then the absorbed boron dose will be determined.
2.2.1 Telescope system at Petten
A technique based on a telescope configuration for boron concentration determination in BNCT has been designed and installed at the High Flux Reactor (HFR) in Petten, the Netherlands. The primary components of this telescope system are shown in Figure 2.211. The telescope system includes a high purity germanium (HPGe) photon detector, a collimator, and a detector shield. The photon detector is located relatively far away from the head phantom (> 200 cm; this is the origin of the name “telescope”) to avoid interfering with the therapy process and to avoid the intensive background radiation around the target tissue. The function of the collimator, which is made of tungsten and lead, is critical. The viewing region of the photon detector is confined to a narrow spatial region in the phantom by the hole in the
collimator to achieve a better spatial resolution and to reduce the background photon count. The photon detector is positioned above the ceiling of the therapy room. The ceiling, which serves as a suitable detector shield for both neutrons and photons, is composed of a layer of boron-loaded polyethylene and a layer of lead and steel. Since the detector is outside the therapy room, there is no need for additional detector shielding. The photon spectrum detected with the HPGe detector is also shown in Figure 2.2. The broadened boron peak is clearly visible, and on the right of it, a sharp 511 keV annihilation peak is apparent as well. To distinguish the boron peak from the annihilation peak, an HPGe semiconductor detector was selected since the energy resolution of scintillation detectors is generally not sufficient.
(a) (b)
Figure 2.2 (a) Schematic of the telescope system at HFR in Petten, which includes an HPGe detector, a collimator and the ceiling serving as the detector shield; (b) the detected photon spectrum by the HPGe detector.
2.2.2 Differences between BNCS and BNCT
Our ultimate goal is to design and implement a telescope system for online monitoring of the synovial boron dose during BNCS treatments. While the system at Petten provides an excellent starting point, there are several differences between BNCT and BNCS; these differences make redesign of a telescope system specifically useful for BNCS necessary.
First of all, the tumor 10B uptake in BNCT is usually at the level of several to several tens of ppm
(parts per million), whereas the synovial boron concentration in BNCS is expected to be several thousands of ppm6. Potentially, many more boron photons will be emitted from the synovium in BNCS,
and the count rate of boron photons will be much higher than that at Petten. The advantages of a higher count rate include a better signal to noise ratio and a shorter detection time to achieve a statistically reliable count. In addition, the use of NaI(Tl) detectors14 may become possible.
In BNCT, a very clean epithermal neutron beam is necessary. The boron concentration is low, and so is the boron dose rate. If the neutron beam is contaminated with fast neutrons, the healthy tissue dose from fast neutrons can be significant. However, in BNCS a neutron beam mixed with fast neutrons is acceptable6. The boron concentration is high, and the irradiation time is expected to be short. Therefore,
the healthy tissue dose from fast neutrons and incident photons is small. (Quantitative results will be provided in the next chapter).
The third difference comes from the depth and the shape of the target tissue. The depth of synovium is about 0.4 to 1.3 cm from the skin, in contrast with up to 7 to 10 cm for a deep-seated brain tumor. The size of joints (such as the knee or finger) may be quite variable, so the gamma ray telescope for BNCS has to be adaptable to joints of a wide range of sizes.
2.2.3 Potential differences between the telescopes at Petten and at LABA
The first difference from the system at Petten is that the telescope at LABA will be initially located inside the therapy room. The ceiling and surrounding walls of the radiation vault at LABA are made of ordinary concrete, and other than their thickness (3 - 4 feet), they are not specially designed for neutron and photon shielding. In addition, the shortest distance from the synovium to a detector position outside the vault is over 300 cm. Since the boron photon count rate decreases rapidly as the distance from the synovium increases, such a long distance may cause insufficient boron photon count rate. On the other hand, the possibility of locating the detector outside the room will also be explored. The feasibility of using concrete as the neutron and photon shielding material will be studied in simulations.
The second difference is the possibility of using a NaI detector at LABA. To completely separate the 478 keV peak and the 511 keV peak, the energy resolution of a photon detector has to be lower than 4%
(here the width of a photon peak is represented with the FWTM: full width at tenth-maximum), which is impractical for a NaI detector. However, for the telescope at LABA, the boron photon count rate is expected to be much higher than that of 511 keV photons, and so distinguishing the 511 keV peak from the 478 keV peak may not be necessary. Thus, use of a NaI detector instead of an HPGe one may now be possible. A good feature of NaI detectors is their relative insensitivity to radiation damage caused by fast neutrons14. This could be a big advantage if the detector is located somewhere with a strong fast neutron
background, such as in the radiation room at MIT LABA.
Another difference comes at the stage of dose reconstruction, where the required synovial boron dose is deduced from the count of boron photons. Boron concentration in brain tumors was the goal using the Petten telescope13; however, the synovial boron dose is the goal with the telescope to be developed at
LABA. Boron concentration is a quantity independent of neutron irradiation. At Petten, when reconstructing the boron concentration, the ratio of boron photon counts to hydrogen photon counts (B/H), which is independent of neutron flux, was selected13. On the other hand, boron dose is
proportional to the neutron flux. Therefore, B, the number of detected boron photons, is a better choice than B/H in determining the synovial boron dose. Consequently, the reconstruction approaches could be very different for the two systems.
Although the development of a telescope for BNCS was conducted based on a particular neutron production reaction (9Be(d,n) at a deuteron energy of 1.5 MeV) and a particular therapy room (the
radiation vault at LABA), the goal of this thesis was toward developing a general telescope system that is also applicable to other neutron production reactions and other physical configurations of the therapy room. More details will be provided in Chapter 7.
Chapter 3 Background Investigation Using Monte Carlo simulations
This chapter and the next will describe the development of a telescope system for BNCS designed using the Monte Carlo method15,16. In this chapter, the major problems involved in developing the system
will be discussed first. Next, the BNCS model in Monte Carlo simulations will be introduced in detail. The eventual fate of the source neutrons will be explored, and the spatial distribution of neutrons and photons in the radiation vault will be studied. At the end of this chapter, the approximate position of the photon detector will be determined; the precise position will be determined in Chapter 4.
3.1 Primary problems to be solved in simulations
3.1.1 Location of the detectorFirst, it is important to determine a suitable location for the photon detector. The candidates include the positions inside the therapy room and those outside it. The apparent advantage of locating the detector outside the therapy room is that there is no need to build the detector shield, but this choice is more likely to be restricted by the practical situation such as space availability and the influence of the particle flux created by construction material of the ceiling/walls.
Several figures of merit will be applied to quantitatively evaluate the advantages and disadvantages of each location. The first figure of merit is neutron flux. Neutrons, primarily fast neutrons, can cause radiation damage in the effective volume of a photon detector. One of the direct consequences of this is the degradation of the energy resolution of the detector14. Prompt and delayed photons are induced as a
result of neutron interactions with the nuclei in the detector and the surrounding materials. The detection probability of these photons is relatively high. Thus, a weaker neutron field around the detector promises not only less detector damage but also a higher signal to noise ratio (SNR). The second important figure of merit is the count rate of the detected 478 keV boron photons, B, from the synovium. A location at which the detector can collect more boron photons from the synovium is a better choice. The next significant figures of merit are ratios: the ratio of boron photon counts to hydrogen photon counts (B/H) and the ratio of boron photon counts to neutrons (B/N). These two figures of merit take into consideration the potential background contributions from 2223 keV hydrogen photons and neutrons, respectively. 3.1.2 Feasibility of the telescope system
The feasibility of the telescope system for BNCS is determined by addressing the following three aspects. First, the detector damage caused by fast neutrons must be endurable. This is especially crucial if an HPGe detector is chosen. (The threshold for damage to HPGe detectors is ∼109 fast neutrons/cm2)14,17.
detection process requires the discerning of weak signals superimposed on significant background/noise contributions. With the help of appropriately designed collimators and detector shields, the signal to noise ratio can be greatly improved. However, it is impossible to eliminate all the background counts: there will always be neutrons and background photons entering the detector via the aperture in the collimator; this aperture is designed to allow the boron photons from the synovium to enter detector. Third, the count rate of boron photons originating from the synovium should be high enough so that the collection time required to reduce the statistical error to an acceptable level is practical.
3.1.3 Parameters of the telescope system
The telescope system under development consists of a photon detector, a collimator, and a detector shield. Several parameters need to be selected: the location of the detector, the position of the collimators, the materials used for shielding and their respective thicknesses, and the size of the aperture in the collimator. Optimizations will be involved in this process.
3.1.4 Selection of the detector
NaI and HPGe detectors are the most widely used photon detectors14. NaI detectors have the
advantages of high detection efficiency, easy handling, and low cost. The major disadvantage is that their energy resolution is relatively poor. HPGe detectors, by contrast, have the advantage of good energy resolution; however, they are expensive and sensitive to radiation damage. Figure 3.1 gives the appearance of the boron peak (470 – 485 keV) and the 511 keV peak for the two types of detectors, simulated with Matlab. The two peaks are well separated in the spectrum by HPGe detectors, and the shapes of the peaks are consistent with those measured, as illustrated in Figure 2.2. On the other hand, the two peaks in the spectrum overlap when NaI detectors are used.
At Petten, the 511 keV annihilation peak is the primary source of background affecting the detection of boron photons emitted from the target tissue. To fully distinguish the 478 keV peak from the 511 keV annihilation peak, the energy resolution of the photon detector has to be less than 4%, which is not possible for standard NaI detectors to achieve. Therefore, an HPGe detector has to be used for accurate boron photon count measurement. However, in BNCS, the boron concentration in the synovium is several hundred to several thousand times higher than that in BNCT, and photon emission from the joint is expected to be correspondingly significantly higher. The use of a NaI detector will be possible if the count rate of 511 keV annihilation photons is significantly less than that of boron photons. It will be especially plausible if the annihilation photon count does not vary significantly under various synovial boron concentrations, so that the 511 keV photon contribution to the boron peak could be assumed to be stable
Figure 3.1 Simulated boron photon peak and 511 keV photon peak with Matlab for (a) a HPGe detector with a FWHM of 2 keV at 478 keV and (b) a NaI detector with a FWHM of 42 keV at 478 keV.
3.2 Special issues in conducting Monte Carlo simulations
The Monte Carlo code MCNP (version 4B)18, which was developed at the Los Alamos National
Laboratory, was used for design of the telescope system. Many features in this code such as flexible geometrical specification, ability in dealing with physical processes in very detailed manners, rich collection of variance reduction methods and extensive cross section data, make it versatile in solving problems associated with neutron, photon, electron, or coupled neutron/photon/electron transport.
Developing the telescope system using Monte Carlo simulations is hampered by low computational efficiency. To track neutrons and photons precisely, the beam tube, the anthropomorphic phantom, the telescope system, and the concrete surroundings of the radiation vault have to be included in the simulation model. The spatial volume of this simulation model is over one hundred cubic meters. However, the effective volume of a photon detector is much smaller, and therefore the count probability in the detector tally will be very low. It has been estimated in preliminary simulations that the count probability could be as low as 10-6 per source neutron for neutron tallies and 10-9 per source neutron for
boron photon tallies. Neutron transport is very time consuming, and pure analog Monte Carlo simulations are not practical for solving the problems with such low count efficiencies using personal computers (PCs). Some effective variance reduction methods have to be applied. In MCNP neutron transport, implicit capture is used by default18. This method is helpful in most neutron transport problems; however,
it is not powerful enough for solving problems with thick penetration involved. The best candidates of variance reduction methods available in MCNP include the point detector method (F5 tally) and the DXTRAN method18. These methods are both very powerful in dramatically improving the count
efficiency. More details of these methods and the effectiveness and deficiencies of these methods in developing the telescope system will be discussed in the next chapter (section 4.4).
In Monte Carlo simulations in this chapter and the next chapter, the variance reduction methods described above will be extensively used. In this chapter, the uncertainty of the simulation results regarding boron neutron capture and boron dose in the synovium is less than 1%. For neutron and photon fluxes, the uncertainty is less than 2%. In the next chapter, after the collimator and detector shield are added, the simulated counting efficiency will be significantly reduced. The number of particles generated such that the corresponding uncertainty in neutron and photon flux and fluence was always less than 5% except for that for 511 keV photons, which is around 10% under some situations.
3.3 BNCS model for simulations
The BNCS model for MCNP simulations, which is a part of the simulation model used in the development of the telescope system, had already been set up by former investigators at MIT LABA6,8. A
very brief description is given here. 3.3.1 Accelerator neutron beam
A schematic of the accelerator neutron beam configuration is shown in Figure 3.2. The nuclear reaction for neutron production is 9Be(d,n). Deuterons are accelerated to 1.5 MeV, and then directed to hit
the beryllium target located close to the far end of the BNCS beam tube. In the source definition card in MCNP simulations, the angular distribution of the source neutrons19 is approximated with 7 angular bins:
0°- 10°, 10°- 30°, 30°- 50°, 50°- 70°, 70°- 90°, 90°- 110°, and 110°- 180°. The normalized neutron emission probability in each angular bin is 1.2%, 8.7%, 15.1%, 15.2%, 13.4%, 15.0%, and 31.4%, respectively. The probability of emitting a source neutron in a forward direction (0°- 90°) is 57%, and that in a backward direction (90°- 180°) is 43%. The neutron energy distributions for the first angular bin (0°- 10°) and the last one (110°- 180°) are presented in Figure 3.3. The energy spectrum of the source neutrons is very hard, and the maximum neutron energy is over 6 MeV. The average neutron energy in the backward directions (2.9 MeV in the angular range of 110°-180°) is higher than that in the forward directions (2.0 MeV in the angular range of 0°-10°). A neutron beam with such an angular distribution and energy spectrum does not satisfy the requirements of boron neutron therapy well, since thermal neutrons are much more likely to be captured by 10B in the synovium than fast neutrons. To make more
neutrons useable in BNCS, the original neutron beam released from the beryllium target is moderated and directed toward the forward directions with the D2O/graphite moderator/reflector assembly. D2O is a very
neutrons toward the beam direction to increase the neutron flux at the position. The dimensions of the D2O moderator and the graphite reflector are illustrated in Figure 3.2.
Figure 3.2 Schematic of beam tube, 9Be target, Figure 3.3 Angular distributions of neutrons
and moderator/reflector assembly for BNCS emitted from 9Be target in two angular bins:
neutron beam production. (0°, 10°) and (110°, 180°). The maximum neutron energy is over 6 MeV.
3.3.2 BNCS model for simulations
Figure 3.4 shows the entire BNCS simulation model6, which includes the accelerator beam tube, target,
target cooling apparatus, an anthropomorphic phantom20 with one leg omitted, shielding wall, and back and side graphite reflectors around the knee position. The simulations are focused on irradiation of a knee joint, but by no means will the candidate joints for BNCS be limited only to knee joints. The major organs were originally included in the anthropomorphic phantom to allow calculation of patient effective dose, E, during joint irradiation. However, addition of the organs is not necessary for investigations of the telescope system and they make the geometrical description of the torso very complicated. MCNP simulations were run to examine whether this complexity is necessary. However, it was expected that the computational efficiency would be improved if a simpler description could be used. It was discovered that no difference in neutron and photon fluxes at the location of the knee joint could be recognized after the torso in Figure 3.4 was replaced with a cylinder of soft tissue. However, the improvement in computational efficiency (as determined by comparison of MCNP-generated FOM (figure of merit)18
18 cm 30 cm 10 cm 28 cm 18 cm 13 cm 0 0.2 0.4 0.6 0.8 1 1.2 1.4 0 0.5 1 1.5 2 2.5 3 3.5 4 4.5 5 5.5 6 6.5
Source neutron energy (MeV)
Pr oba bility de ns ity (/Me V) 0 - 10 degrees 110 - 180 degrees
which takes into consideration run time, precision and other factors) was also very limited (< 5%), and so the organs were all kept.
Figure 3.4 MCNP simulation model for BNCS, including target-moderator-reflector assembly, boron-containing shielding wall, anthropomorphic phantom, and back reflector (side reflectors are not visible). The space is divided into four quadrants: I (0° < ϕ <90°), II (90° < ϕ <180°), III (180° < ϕ <270°), and IV (270° < ϕ <360°). The slice shown is the X-Y plane at θ = 90°.
The shielding wall, with dimensions of 177.5 cm in length, 180 cm in height, and 20 cm in thickness6,
is made of polyethylene with 2% natural boron enrichment. It is very helpful in limiting the neutron dose to the human body. On the other hand, compared with that in the synovium, the total amount of 10B contained in this wall is huge (∼ 2240 g). The 478 keV boron photons emitted from this wall could affect the signal of the detected boron photons from the synovium. However, it is expected that the influence of these boron photons will be eliminated after the adoption of appropriately positioned collimators and detector shields.
The back and side reflectors (side reflectors are not visible in Figure 3.4) surround the knee joint and reflect the escaping neutrons back to the knee joint to increase the neutron flux in the synovium. After the location of the photon detector has been determined, a hole in one of the reflectors will be made to allow boron photons from the synovium pass to through in the direction of the detector.
3.3.3 Synovium representation and boron compound
The realistic configuration of the inflamed synovium is complex and irregular, and the exact description of the synovium with mathematical equations is very burdensome. In Figure 3.4, the
φ I φ = 0 ° φ= 90° φ=270° IV II III Shielding wall Back reflector D2O Neutron source Graphite reflector
the two surfaces are 2.90 cm and 3.05 cm, respectively, and so the thickness of the shell is 0.15 cm. The length of this shell is 6 cm, and the total volume of the synovium is π×(3.052-2.92)×6 = 16.823 cm3. The
size and structure of rheumatoid synovium vary from patient to patient. Therefore, it is impossible to model a synovium that can represent all possible sizes and structures that a real synovium can have. This simplified synovium model is used to give a very rough picture of boron compound distribution, and is not intended to imitate a real synovium. For exploring the feasibility of a telescope system for boron dose determination, such a model is sufficient. The effect of synovium configuration on boron photon production in the synovium and boron photon detection of the telescope will be discussed later in Chapter 7.
The boron compound modeled in simulations is 10B-enriched K2B12H12. However, the results for
K2B12H12 will also be valid for other compounds. From the point of view of physics, only the amount of 10B and its spatial distribution affect the production and the detection of boron photons, and the nature of
the compound is not relevant. The synovial boron concentration modeled ranges from 1,000 ppm to 19,000 ppm. Practical BNCS treatments are unlikely if synovial boron concentrations are much less than 1,000 ppm since irradiation time would be long and healthy tissue dose would be correspondingly high; 19,000 ppm represents the maximum average synovial boron concentration measured during in vivo boron uptake studies.
3.3.4 Coordinate system
In Figure 3.4, the total space available in the radiation vault is divided into four regions (quadrants), which are denoted as I, II, III, and IV. Spherical coordinates (r,θ,ϕ) are employed to represent a spatial location. The symmetrical center of the synovium is selected as the origin of the coordinate system, i.e., r is the distance relative to the center of the synovium.
3.4 Ultimate fate of the source neutrons
From the energy and angular distribution of the source neutrons (Figure 3.3), it is expected that only a small fraction of the source neutrons are eventually absorbed in the synovium through boron neutron capture reactions. A large number of neutrons are stopped in the shielding wall and other features in the therapy room, most likely after one or more scatterings.
3.4.1 Neutron absorption and boron dose in the synovium
Monte Carlo simulations were performed to estimate the number of 10B(n,α) reactions in the
synovium under various boron concentrations. At the same time, the synovial dose was also determined with three different methods. The first method uses the F6 tally18 in MCNP to directly seek the energy
deposited per unit mass of synovium. Two options (F6:n and F6:n,p) were both tried. In F6:n tallies, only the kinetic energy deposited by neutrons through heavy charged particles following reactions such as (n,α), (n,n), and (n,n′) is recorded, and the photon energy deposited in the synovium following (n,γ) and (n,n′γ) reactions is not included. On the other hand, in F6:n,p tallies, the energy deposited through heavy charged particles and neutron produced photons is summed. In the second method, the total energy deposited in the synovium through boron neutron capture reactions is calculated as the product of the number of boron neutron capture reactions (estimated using the F4 tally plus the FM card18) and the
average energy released in each capture, which is 2.310×94%+2.792×6%= 2.339 MeV. Then the averaged boron dose in the synovium equals the total energy divided by the synovial mass. In the last method, the neutron flux in the synovium is determined first using the F4 tally, and the boron dose is obtained by multiplying flux-to-dose conversion factors by the neutron flux.
Figure 3.5 shows the number of boron neutron capture reactions in the synovium under various synovial boron concentrations: 0, 1,000, 2,000, 5,000, 10,000, 15,000, and 19,000 ppm. Clearly, the relationship between the number of 10B(n,α) reactions and the synovial boron concentration is nonlinear,
and a tendency to saturation becomes prominent at high boron concentrations (over 10,000 ppm). This effect of neutron self-shielding in the target tissue is more explicit in Figure 3.6, which presents the dose contribution per ppm of 10B under various boron concentrations. The curve in Figure 3.6 decreases
quickly with increasing boron concentration, which indicates that the average thermal neutron flux decreases significantly at high synovial boron concentrations. In addition, neutron flux suppression is already apparent at 1,000 ppm, and hence the self-shielding effect has an appreciable influence over the entire range of synovial boron concentrations in BNCS.
Table 3.1 gives the doses estimated with the three different methods. These results are very comparable. Columns 2, 3, and 4 display the total synovial dose, the total synovial neutron dose, and the synovial boron dose, respectively. The boron dose is clearly dominant in BNCS, and the photon dose and the neutron dose through other nuclear reactions add negligible dose to the total dose when the boron concentration is over 5,000 ppm.
On the other hand, the fraction of source neutrons absorbed in the synovium is very small. For instance, at 1,000 ppm, only 0.13% of the source neutrons are absorbed in the synovium, and the number is 0.68% and 0.89% at 10,000 ppm and 19,000 ppm, respectively. That is, in the range of the boron concentration in BNCS, less than 1% of the neutrons emitted from the beryllium target are used, and over 99% of the neutrons are ultimately absorbed in other components in the radiation vault, as described below.
Figure 3.5 Number of 10B(n,α) reactions in the synovium as a function of the synovial boron concentration.
Figure 3.6 Synovial boron dose per ppm of 10B as a function of the synovium boron concentration. Boron Concentration (ppm) 0 5000 10000 15000 20000 Num b er of Bor on Neu tron Capt ure Re act ion (1/sou rce neut ron) 0.000 0.002 0.004 0.006 0.008 0.010 Boron Concentration 0 5000 10000 15000 20000 B or on d os e pe r p p m 10 B (cGy /ppm /source n eu tron) 5.0e-16 1.0e-15 1.5e-15 2.0e-15 2.5e-15 3.0e-15 3.5e-15
Table 3.1 Synovial dose estimated with three different methods (unit: Gy/source neutron)
3.4.2 Neutron absorption in other components
Monte Carlo simulations were also conducted to explore neutron absorption in other components of the BNCS therapy situation. Table 3.2 gives a summary of the results assuming a synovial boron concentration of 10,000 ppm. Since the fraction of neutrons absorbed in the synovium is so small (< 1%), variations in synovial boron concentration will not change the overall situation of neutron absorption. From Table 3.2, the boron-containing shielding wall absorbs 36.5% of source neutrons, among which 35.6% are captured by 10B nuclei. The concrete floor, ceiling, and walls altogether absorb 34.0% of
source neutrons.
Table 3.2 Neutron absorption in various components in BNCS model (boron concentration: 10,000ppm)
Only the neutrons that penetrate through the front surface of the D2O moderator are used for
irradiation of the knee joint. Simulation results showed that over 90% of the source neutrons leave the D2O moderator through the side and back surfaces. If the graphite reflector surrounding the D2O
moderator is absent, only 3% of the neutrons will hit the front surface of the moderator in the direction of the synovium. With the graphite reflector present, the number increases from 3% to 10%. This
Boron Concentration (ppm) Neutron dose + Photon dose (F6:n,p) Neutron dose
(F6:n) Boron dose (F4:n+FM) (F4:n+DE+DF) Boron dose
0 1.96e-15 1.50e-15 0 0
1,000 3.02e-14 2.97e-14 2.82e-14 2.86e-14
2,000 5.36e-14 5.31e-14 5.16e-14 5.25e-14
5,000 1.03e-14 1.03e-13 1.01e-13 1.04e-13
10,000 1.53e-13 1.52e-13 1.50e-13 1.56e-13
15,000 1.85e-13 1.84e-13 1.83e-13 1.91e-13
19,000 2.01e-13 2.00e-13 1.98e-13 2.09e-13
Absorption (%)
Synovium 0.7
Boronated shielding wall 36.5
Floor, ceiling and walls 34.0
Inside accelerator 9.8 Li-poly delimeter 8.9 Air 2.5 Leg 1.3 D2O/graphite 2.4 Torso+head 0.1 Escaped 3.6
the neutrons escape from the outer surfaces of the graphite reflector and enter the shielding wall or the air in the therapy room. The neutron flux in the shielding wall is expected to be large, and this is consistent with the large number of boron neutron capture reactions detected in the shielding wall as shown in Table 3.2. The leakage of neutrons to the air predicts the existence of a strong neutron field in regions I and II, since the graphite reflector is located in these regions.
Given the high neutron flux in the shielding wall and its composition, a large number of boron photons will be emitted from the shielding wall. A strong boron photon field is therefore formed in the radiation vault, especially at the places near the shielding wall in regions I and II. The influence from the boron photons emitted from the shielding wall will be discussed later in the chapter (section 3.5.4) and in the next chapter when the collimator and detector shield have been added.
3.5 Neutron and Photon spatial distribution inside the therapy room
To select the location of the photon detector, detailed information regarding the neutron and photon background distributions in the radiation vault must be obtained. To achieve the least detector shielding and the least detector damage, a location with the weakest neutron and photon backgrounds is the best.
To examine the background in the therapy room, point detectors (F5 tallies in MCNP18) were located
at various directions and distances from the synovium. The neutron and photon fluxes at these locations were estimated. In all simulations, the synovial boron concentration was kept at zero ppm; therefore, the tallied boron photons were all from the boron-containing shielding units. To specifically analyze the influence of neutron scattering by the floor, the ceiling, and the surrounding walls of the therapy room, two cases, with and without the concrete structure of the radiation vault, were compared.
The possible combinations of r, θ, and ϕ are infinite, and only some representative locations were selected to examine the spatial distributions of neutrons and photons. Five polar angles (θ = 0°, 45°, 90°, 135° and 180°) and eight azimuthal angles (ϕ = 0°, 45°, 90°, 135°, 180°, 225°, 270°, and 315°) were selected. Since the angle ϕ is meaningless under the polar angles of 0° and 180° (the projection of any vector with a polar angle of 0° or 180° into the XOY plane is at the origin with a zero length), only one azimuthal angle of an arbitrary value was chosen for these two special polar angles. The coordinate pair (θ,ϕ) determines the direction, so altogether 3×8+2 = 26 directions were investigated. In each direction, three distances r were chosen: 100 cm, 200 cm, and 250 cm. In some directions, not all the three distances were accessible. For example, the location of (100 cm, 90°, 0°) was not practical because it was inside the torso of the human body; in other directions, r could not be 200 cm or 250 cm, otherwise the location would be outside of the radiation vault, or inside the concrete structure of the radiation vault. Only the positions in the air and inside the therapy room were accepted. Under this limitation, the real
number of detector positions was 54, instead of 26×3 = 78. The collected information at each detector position included thermal neutron flux (< 1eV), total neutron flux, 478 keV photon flux, 511 keV photon flux, and 2223 keV photon flux.
3.5.1 Neutron flux in the therapy room
The normalized neutron fluxes at the 54 detector locations appear in Figure 3.7, which contains six panels. The results in Figure 3.7 are organized according to the distance r (100 cm, 200 cm or 250 cm); the thermal and total neutron fluxes are displayed in separate panels. There is not an explicit azimuthal angle corresponding to the polar angle of 0° or 180°, and an angle of 90° is chosen for these two polar angles.
From Figure 3.7, for all distances, r, the neutron flux peaks in regions I and II (0°≤ϕ≤180°, see Figure 3.4). It is likely that the maximum flux is located somewhere around ϕ = 90°. This is because of the location of the beryllium target (region II) and the angular distribution of the source neutrons. Neutrons emitted in the backward directions have less possibility of being moderated and absorbed than those emitted in the forward directions. This is especially true for those neutrons emitted into the vacuum beam tube; except for the wall of the beam tube, there is no scattering material preventing these neutrons from reaching regions I and II. Since the beam tube lies in the direction of (θ,ϕ) = (90°, 100°), it is reasonable to assume that the neutron flux peaks somewhere close to this direction.
Compared to regions I and II, the neutron flux in regions III and IV (180°≤ ϕ ≤360°) is much lower. For example, for θ = 90° and r = 100 cm, the total neutron flux at ϕ = 90° is 3.5, 4.3, and 5.3 times higher than that at ϕ = 225°, 275° and 315°, respectively. The photon detector should therefore be located in region III or IV in order to reduce radiation damage to the detector, photon background in the detector, and overall shielding requirements.
In Figure 3.8, the simulation results are reorganized to show how the neutron flux varies with distance in certain directions in regions III and IV. The neutron flux continues to drop as the distance r increases. However, the neutron flux falls rapidly with distance when r is between 100 cm and 200 cm, and more slowly when the distance is over 200 cm. In Figure 3.8, the neutron flux in the direction of (θ,ϕ)= (90°, 315°) is much weaker than that in the other three directions.