HAL Id: hal-00301267
https://hal.archives-ouvertes.fr/hal-00301267
Submitted on 7 Oct 2003HAL is a multi-disciplinary open access
archive for the deposit and dissemination of sci-entific research documents, whether they are pub-lished or not. The documents may come from teaching and research institutions in France or abroad, or from public or private research centers.
L’archive ouverte pluridisciplinaire HAL, est destinée au dépôt et à la diffusion de documents scientifiques de niveau recherche, publiés ou non, émanant des établissements d’enseignement et de recherche français ou étrangers, des laboratoires publics ou privés.
A climatological study of rural surface ozone in central
Greece
P. D. Kalabokas, C. C. Repapis
To cite this version:
P. D. Kalabokas, C. C. Repapis. A climatological study of rural surface ozone in central Greece. Atmospheric Chemistry and Physics Discussions, European Geosciences Union, 2003, 3 (5), pp.4989-5018. �hal-00301267�
ACPD
3, 4989–5018, 2003 Climatology of rural surface ozone in Greece P. D. Kalabokas and C. C. Repapis Title Page Abstract Introduction Conclusions References Tables Figures J I J I Back CloseFull Screen / Esc
Print Version Interactive Discussion
© EGU 2003 Atmos. Chem. Phys. Discuss., 3, 4989–5018, 2003
www.atmos-chem-phys.org/acpd/3/4989/ © European Geosciences Union 2003
Atmospheric Chemistry and Physics Discussions
A climatological study of rural surface
ozone in central Greece
P. D. Kalabokas and C. C. Repapis
Academy of Athens, Research Center for Atmospheric Physics and Climatology, Athens, Greece
Received: 4 February 2003 – Accepted: 17 September 2003 – Published: 7 October 2003 Correspondence to: P. D. Kalabokas ([email protected])
ACPD
3, 4989–5018, 2003 Climatology of rural surface ozone in Greece P. D. Kalabokas and C. C. Repapis Title Page Abstract Introduction Conclusions References Tables Figures J I J I Back CloseFull Screen / Esc
Print Version Interactive Discussion Abstract
Recent studies show that surface ozone levels at rural sites in Greece are generally high when compared with rural ozone measurements at northern European sites. The area of SE Europe, including Greece, is not very well monitored regarding rural ozone in comparison to central and northern Europe. In order to have the best possible pic-5
ture of the rural surface ozone climatology in the area, based on the available data-sets of long-term continuous monitoring stations, the 10-year measurement records (1987– 1996) of the Athens peripheral station of Liossia, (12 km N of the city center) and the urban background station of Geoponiki (3 km W) as well as the 4-year record (1996– 1999) of the rural station of Aliartos (100 km NW of Athens), are analyzed in this paper. 10
The data for Liossia and Geoponiki stations are screened for cases of strong airflow from rural areas (N–NE winds stronger than 5 m/s). The variation characteristics of the average rural ozone afternoon levels (12:00–18:00), with the best vertical atmo-spheric mixing, are mainly examined since these measurements are expected to be representative of the broader area. In all three stations there is a characteristic sea-15
sonal variation of rural ozone concentrations with lowest winter afternoon values at about 50 µg/m3in December–January and average summer afternoon values at about 120 µg/m3 in July–August, indicating that high summer values are observed all over the area. The rural summer afternoon ozone values are very well correlated between the three stations, implying spatial homogeneity all over the area but also temporal ho-20
mogeneity, since during the 13-year period 1987–1999 the rural afternoon ozone levels remained almost constant around the value of 120 µg/m3.
1. Introduction
Atmospheric ozone plays an important role in the physico-chemical processes of the troposphere but it has also strong oxidant properties, which at certain ambient concen-25
ACPD
3, 4989–5018, 2003 Climatology of rural surface ozone in Greece P. D. Kalabokas and C. C. Repapis Title Page Abstract Introduction Conclusions References Tables Figures J I J I Back CloseFull Screen / Esc
Print Version Interactive Discussion
© EGU 2003 and Pitts, 1997; Bates, 1994). The problem of tropospheric ozone has changed
dimen-sions about fifteen years ago, when it was realized that increased surface ozone is not only a local urban problem as an almost global increase of surface rural ozone con-centrations, especially in the northern hemisphere, has been observed during the 20th century, which is attributed primarily to photochemical production (Volz and Kley, 1988). 5
In central and northern Europe there are many rural air pollution stations, providing a satisfactory picture of the spatial distribution of surface ozone concentrations but there are only a few systematic measurements covering the Mediterranean basin and espe-cially its eastern part (Beck and Grennfeld, 1993; Scheel et al., 1997). The high lev-els of solar irradiation observed in the Mediterranean, in combination with the emitted 10
anthropogenic and biogenic ozone precursors, might favor photochemical ozone pro-duction. High surface ozone values have been already reported at western and central Mediterranean sites in Italy and Spain (Millan et al., 1992; Bonasoni et al., 2000). Con-cerning the eastern Mediterranean, several intensive short-term measurements includ-ing aircraft flights have been carried out in Greece, around the urban area of Athens 15
and over the Aegean Sea during the past decade, which recorded high surface ozone values (Kallos, 1995; Ziomas, 1998; PAUR report, 1998). In Greece, few systematic rural ozone measurements outside the greater Athens area have been published so far covering time-periods of several months to 2–3 years (Kourtidis et al., 1996; Glavas, 1999; Kouvarakis et al, 2000). In previous works efforts have taken place to extract 20
the information about rural ozone levels around the city of Athens based on the mea-surements of the Athens urban peripheral stations. The analysis of several year ozone records show that the rural ozone levels surrounding the Athens basin are significantly higher than values in northern Europe and the Atlantic ocean (Kalabokas et al., 1996; Kalabokas and Bartzis, 1998; Kalabokas et al., 2000; Kalabokas 2001). In this work, 25
in order to have the best possible picture of the rural surface ozone climatology in the area, based on the available data-sets of long-term continuous monitoring stations, the 10-year measurement records of the rural ozone values obtained at an Athens periph-eral station, an urban background station and a rural station located about 100 km NW
ACPD
3, 4989–5018, 2003 Climatology of rural surface ozone in Greece P. D. Kalabokas and C. C. Repapis Title Page Abstract Introduction Conclusions References Tables Figures J I J I Back CloseFull Screen / Esc
Print Version Interactive Discussion (4-year record), are systematically analysed. The diurnal, seasonal and interannual
rural ozone variations in the area were examined.
2. Methodology
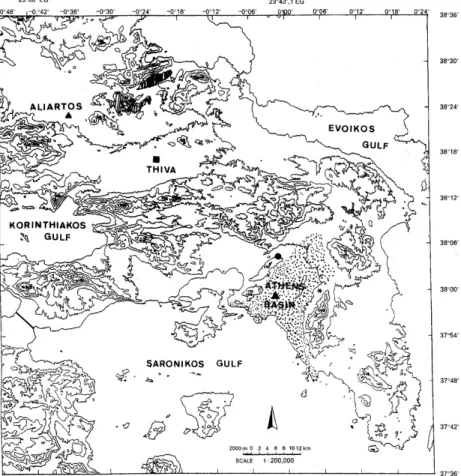
The analysis is mainly based on the following surface ozone records: a) the continuous 4-year (1996–1999) data-set of the rural station of Aliartos located about 100 km NW 5
of Athens (Fig. 1), b) the 10-year ozone record (1987–1996) of the peripheral station of Liossia, located at the northern edge of the urban agglomeration (12 km from the city center) and c) the 10-year ozone record (1987–1996) of the urban background station of Geoponiki (3 km west of the city center). The data of the last two stations (Liossia and Geoponiki) were screened for cases of strong airflow from rural areas. 10
For this purpose only measurements under strong northerly winds (NNW to ENE) with daily mean value greater than 5 m/s, were retained for further processing. The strong northern synoptic flow is very frequent in the area during summer and in that case the station of Liossia is located upwind of the urban area. This is a result of a combination of the high-pressure system over the Balkan peninsula and the low pressure system 15
over the middle-east. The resulting winds, called “Etesians” (annual) winds, affect most of the area covered by the Aegean Sea (Repapis et al., 1977).
The rural station of Aliartos is located in the Copais plain, at an altitude of 110 m above sea level. Continuous ozone measurements started in 1996. The station is operated by the Ministry of the Environment to monitor background pollution (EMEP 20
project). In addition to the continuous ozone measurements in Aliartos there is also a several year record of manual measurements of nitrogen dioxide on a 24-hour basis measured by a wet chemical method (MinEnv report, 2000). The ozone measure-ments are made by a commercial analyser and average values are recorded every hour. Between Athens and Aliartos there is a topographic barrier composed of several 25
mountains (Fig. 1) and the SE winds which could possibly transport polluted air from Athens to Aliartos are very rare.
ACPD
3, 4989–5018, 2003 Climatology of rural surface ozone in Greece P. D. Kalabokas and C. C. Repapis Title Page Abstract Introduction Conclusions References Tables Figures J I J I Back CloseFull Screen / Esc
Print Version Interactive Discussion
© EGU 2003 The station in Liossia, where the highest ozone values in the Athens network are
recorded, is operated by the Ministry of the Environment and has monitored ozone continuously since 1987 until 1997, when the Ministry of the Environment was obliged to relocate the station. In this work the complete ozone data-set obtained during the 10 years of operation (1987–1996) is examined. The station of Geoponiki is also operated 5
by the Ministry of the Environment and has monitored ozone continuously since 1987. This station is located at the campus of the Agricultural University of Athens and it is not influenced from direct NOx emissions of car exhausts in its vicinity and therefore can be considered as an urban background station. The same 10-year period record (1987–1996) of ozone and NOx measurements was examined for Geoponiki and for 10
Liossia. The ozone and NOx measurements at both Athens stations, are made by using automatic commercial analysers and the values are recorded every one hour.
3. Results
In Fig. 2 the average monthly values of rural ozone at Aliartos for the examined 4-year period (1996–1999) are presented, showing a characteristic seasonal variation with 15
summer values being almost double (at 75 µg/m3) than winter concentrations. The seasonal variation of the daily mean ozone 75th percentiles are also shown, which, from May to August, remain constant at 85 µg/m3. The daily average NO2levels (mea-sured as 24-hour averages) at Aliartos remain constant throughout the year at low lev-els, about 5 µg/m3, which is typical for other rural European sites (Beck and Grennfeld, 20
1993; Scheel et al., 1997).
Because of the fact that the summer period is the most important for surface ozone production, the diurnal ozone profile of the rural station of Aliartos together with the profiles of the Athens peripheral station of Liossia and the urban background station of Geoponiki for the typical summer months of July and August are presented in Fig. 3. A 25
strong diurnal variation is observed for Aliartos, with the afternoon values being almost 3 times higher than the nocturnal ones. This sharp contrast of ozone between day
ACPD
3, 4989–5018, 2003 Climatology of rural surface ozone in Greece P. D. Kalabokas and C. C. Repapis Title Page Abstract Introduction Conclusions References Tables Figures J I J I Back CloseFull Screen / Esc
Print Version Interactive Discussion and night in Aliartos is likely to be attributed almost exclusively to physical processes
(ozone destruction by dry deposition enhanced by the nocturnal inversion), because the influence of the chemistry is expected to be minimal as the nitrogen oxides con-centrations at the site are low in order to destroy sufficient ozone quantities (Fig. 2). Despite the important differences in the nocturnal levels there is a very good agree-5
ment of ozone in the afternoon levels (12:00–18:00) in all stations, especially between Geoponiki and Liossia, which dispose exactly the same 10-year measurement record. This time-period of the day exhibits the best vertical mixing of air masses in the bound-ary layer and also the maximum photochemistry. Due to the spatial homogeneity of the rural afternoon (12:00–18:00) ozone values combined with the fact that the maximum 10
daily values appear during this time-period, a climatological examination of the average ozone values of this period of the day in the three stations is performed in the following Figs. 4, 5 and 6.
For the rural station of Aliartos, the seasonal variation of the July–August ozone af-ternoon levels is presented in Fig. 4. The shape of the seasonal variation curve of 15
the afternoon values is similar with that of the daily average values (Fig. 2) but the concentrations range at significantly higher levels (55 µg/m3 in winter to 120 µg/m3 in summer). It is also remarkable that from April to September the 75-percentiles ex-ceed the 110 µg/m3 level, which is the EU standard for human health protection (EU Directive 92/72/EEC). Figures 5 and 6 show the seasonal variation of the rural after-20
noon ozone (12:00–18:00) measurements at Liossia and Geoponiki respectively (only observations for days with values selected under strong northerly winds), which in gen-eral seems to be similar with the corresponding rural ozone seasonal curve at Aliartos (Fig. 4). The rural ozone seasonal variation at Liossia shows a minor maximum in May and a major maximum in August, while at Geoponiki there is a summer maximum in 25
July. Nevertheless these little differences do not affect the general outlook of good cor-relations between the seasonal variation curves in all three stations. The average rural ozone levels in July and August in both Athens stations exceed the EU health protec-tion standard (110 µg/m3, 8-hour average), like in Aliartos. It has to be added also that
ACPD
3, 4989–5018, 2003 Climatology of rural surface ozone in Greece P. D. Kalabokas and C. C. Repapis Title Page Abstract Introduction Conclusions References Tables Figures J I J I Back CloseFull Screen / Esc
Print Version Interactive Discussion
© EGU 2003 especially for July and August with the highest frequency of strong northerly winds,
the summer afternoon Ox levels are equivalent at both Athens stations Geoponiki and Liossia (Figs. 5 and 6). The quantity Ox(O3+ NO2) called “potential ozone” or “oxidant” should be taken into account when examining rural ozone levels due to the fast de-struction of ozone by fresh emissions of NO originating mainly from car exhausts (Kley 5
et al., 1994).
In order to have a better picture of the spatial homogeneity of rural afternoon ozone, a more detailed investigation on a daily basis has been carried out based on the year 1996, the common year of operation for all three stations. The 6-hour mean rural after-noon (12:00–18:00) ozone values of the warm period of the year (April-September) of 10
the rural station of Aliartos have been correlated with the corresponding ozone values at the two Athens stations. In Fig. 7 the scatter-plot diagram of the 6-hour average ru-ral afternoon (12:00–18:00) ozone levels of the period April-September 1996 between Aliartos and Liossia (urban peripheral) are presented (all days were included). As shown the correlation is not good especially in the region of high values. The highest 15
values at Aliartos are around 150 µg/m3 while at Liossia are approaching 300 µg/m3, which is due to the influence of the urban area, when the site is downwind of Athens. As a result the correlation is not very strong (R2 = 0.33). If only the days with strong winds > 5 m/s in the Athens basin are taken into account (Fig. 8), then the shape of the scatter plot diagram changes significantly. The range of values in both stations 20
is becomes exactly the same, and the correlation improves significantly (R2 = 0.69). The above observation means that the rural ozone values are quite uniform in the area and that under selected meteorological conditions (strong northerly winds) the rural ozone levels of the area surrounding Athens can be monitored at the peripheral sta-tion of Liossia. Very similar findings are observed if a correlasta-tion between the urban 25
background station of Geoponiki and the rural station of Aliartos is attempted. If all values are taken into account (Fig. 9) the poor correlation (R2 = 0.33) is equivalent with that between Liossia and Aliartos (Fig. 7). In the case of strong winds (Fig. 10) the significantly improved correlation coincides exactly (R2= 0.69) with the corresponding
ACPD
3, 4989–5018, 2003 Climatology of rural surface ozone in Greece P. D. Kalabokas and C. C. Repapis Title Page Abstract Introduction Conclusions References Tables Figures J I J I Back CloseFull Screen / Esc
Print Version Interactive Discussion one between Liossia and Aliartos (Fig. 8), which clearly reinforces the above remarks
about the uniformity of rural ozone values in the area and indicating that under strong northerly winds the rural ozone levels can be monitored by these two stations in the Athens basin, since they give comparable results with the rural station of Aliartos.
Based on the results of the previous paragraph, an examination of the evolution of 5
the rural ozone levels in the area during the 13-year period (1987–1999) is attempted. It must be reminded that the first systematic long-term measurements of ozone in Greece started in the Athens basin in 1987. It seems that the situation remained practically un-changed during the afternoon hours in July–August, which is the most important period regarding the violations of the air quality standards. It comes out that the rural after-10
noon concentrations for July–August remain around 120 µg/m3 in the three examined stations (Fig. 11) during the 13-year period, when 3 or 4-year ozone averages are taken in order to smooth the year to year meteorological variability.
In Fig. 12 the diurnal variations of the urban (under south winds) and rural (under strong north winds) ozone at Liossia and Geoponiki are presented for July, the typical 15
summer month. The ozone diurnal course of these two sectors shows different charac-teristics. At first, the diurnal variation is much more intense for the urban ozone than for the rural, which reflects the differences of the ozone produced in-situ being significantly greater in the case of urban ozone. Another difference is that the maximum in the urban ozone diurnal curve occurs at 13:00 in Geoponiki and at 14:00–15:00 in Liossia while 20
the rural ozone diurnal maximum occurs at 17:00 in both stations. From the popula-tion exposure point of view it is remarkable to observe that the 10-year climatological average of urban ozone for the hours 14:00–15:00 at 12 km downwind of Athens (at Liossia) is greater than the 180 µg/m3EU population warning threshold. For the urban background station of Geoponiki the diurnal July maximum is about 165 µg/m3 and 25
occurs 1–2 h earlier than in Liossia. This difference can be explained by the fact that Geoponiki lies about half way from the coast than Liossia (Fig. 1) and the available time for photochemical reactions in the air mass arriving at the site is shorter. The de-velopment of sea breeze under weak pressure patterns as southern circulation in July
ACPD
3, 4989–5018, 2003 Climatology of rural surface ozone in Greece P. D. Kalabokas and C. C. Repapis Title Page Abstract Introduction Conclusions References Tables Figures J I J I Back CloseFull Screen / Esc
Print Version Interactive Discussion
© EGU 2003 occurs for about 25% of the time and is associated with high pollution levels. It must
be finally added that in Athens during the months of July and August there is almost always sunny weather. The 14-year (1984–1997) average of monthly sunshine dura-tion in Athens is 373±4 h and 351±5 h for July and August respectively corresponding to 12.0 h (July) and 11.3 h (August) daily sunshine duration.
5
4. Discussion
The average monthly concentrations of rural ozone and NO2at Aliartos (Fig. 2) as well as their seasonal variation pattern seem to be similar with results obtained at central European stations. The characteristic of the high summer values being at the same level with the spring maximum is an indication that the photochemical production of 10
ozone on regional scale, following the emissions of the man-made ozone precursors, is the determining factor in the tropospheric ozone budget.
As observed in Fig. 3 there is a different diurnal variation between the rural ozone values at Aliartos and the rural ozone values at Liossia. This reflects the different site characteristics influencing the nocturnal physical ozone destruction to the ground. 15
Aliartos is located in a plain where strong night inversions are observed. On the other hand Liossia is at 210 m altitude a.s.l. on a mountain slope and most of the time is not influenced by the surface layer. Furthermore at Liossia only days with strong winds are considered, which facilitate the vertical mixing in combination with the local topography. The ozone depletion at night is attributed almost exclusively to physical processes as 20
the influence of the chemistry is expected to be minimal. The reason for that is that nitrogen oxides at the site do not have concentrations high enough in order to influ-ence the ozone curve as the mean monthly values of the 24-hour averages of NO2 is throughout the year about 5 µg/m3 (Fig. 2). Therefore, the basic reason of the low night values in Aliartos is the physical destruction of ozone by dry deposition enhanced 25
by the nocturnal inversion. On the other hand in the urban background station of Geo-poniki, which is located at lower altitude than Liossia, the nocturnal NOxconcentrations
ACPD
3, 4989–5018, 2003 Climatology of rural surface ozone in Greece P. D. Kalabokas and C. C. Repapis Title Page Abstract Introduction Conclusions References Tables Figures J I J I Back CloseFull Screen / Esc
Print Version Interactive Discussion are higher (Fig. 6) as a result of ozone destruction from fresh NO emissions.
Conse-quently the ozone nocturnal levels at Geoponiki are lower than at Liossia under strong northerly winds (Fig. 3).
Despite the lower average ozone values at Aliartos and the distance (100 km) be-tween Aliartos and Liossia, there is a good agreement of the observed levels if the 5
afternoon values (12:00–18:00, period with the best vertical mixing and the maximum photochemistry) are only compared. In fact, in both stations there is a clear seasonal variation of the mixing ratios of rural ozone with high average summer afternoon values, greater than 120 µg/m3 in August, and low winter afternoon values about 50 µg/m3 in December–January. This implies that high summer values are a general characteristic 10
of the examined area. The important secondary summer rural ozone maximum, in con-trast to the very frequently observed in most northern European stations spring maxi-mum (Scheel et al., 1997), enhances the hypothesis of the long-range photochemical ozone production and transport during summer, indicating a transboundary pollution problem. The summer maximum at Liossia seems much more pronounced than in 15
Aliartos but this could be attributed to the limits of the screening process at Liossia. The May and June values were extracted from fewer days than the corresponding val-ues of July and August due to the different distribution of strong northerly winds, which are more frequent in late summer (Repapis et al., 1977). It must be reminded that for the averages in Aliartos all values were included, which leads to smoother seasonal 20
variation curves.
It is remarkable that in rural air the EU standard for human health protection (110 µg/m3, 8-hour average) can be frequently exceeded during almost all the warm period of the year, (the 6-month period from April to September) at noon and afternoon hours at both stations. The 75-percentile of rural afternoon ozone during these months 25
is almost always higher than 110 µg/m3and from May to August higher than 120 µg/m3, which means that the level of 110 and 120 µg/m3are exceeded during at least 25% of the days for the respective time-periods. The situation regarding the vegetation pro-tection is even worse if the usual standard of AOT40 10 000 ppbh (accumulation of the
ACPD
3, 4989–5018, 2003 Climatology of rural surface ozone in Greece P. D. Kalabokas and C. C. Repapis Title Page Abstract Introduction Conclusions References Tables Figures J I J I Back CloseFull Screen / Esc
Print Version Interactive Discussion
© EGU 2003 hours times the ppb exceeding the value 40), for a 6 month growing season, is
consid-ered (PORG report, 1997). In fact only during winter months the ozone levels do not exceed 40 ppb (80 µg/m3) while from March to September during daytime this value is constantly exceeded. Therefore, serious violations are observed regarding the vege-tation protection standard for forests. If an approximate estimation of the exposure is 5
performed, it comes out that the vegetation protection level is exceeded in Aliartos by a factor of 2 and at Liossia by a factor of 3. The above analysis raise questions on the subject of health risks caused to the population due to the exposure to the sur-face ozone as well as to damages in vegetation and materials. As mentioned in the introduction ozone is a toxic gas, which if enters the respiratory track in sufficient quan-10
tities will cause damage. It may also affect plant growth, crop yield and tree physiology (Bates, 1994).
The problem of population health hazards due to ozone exposure is becoming worse if the ozone concentration levels within the Athens urban plume are examined. In fact constantly high levels of ozone are observed under such conditions, which violate sys-15
tematically the European Union air pollution standard (Kalabokas et al., 1999). The summer ozone concentrations at the peripheral Athens stations influenced by the ur-ban plume reach on the average the 170-µg/m3 level in the afternoon (Kalabokas et al., 2000). It is surprising though that 10–12 km downwind of such a dense urban area like Athens under strong sunshine and high ozone precursor emissions the surface 20
ozone increases on the average by only 40% of its background level, which means that the rural ozone concentrations are on the average the larger contributors of the surface ozone levels even in the periphery of Athens, where the maximum ozone val-ues of the entire urban area are usually observed. On the other hand it should be emphasized that the distribution of the ozone concentrations in an urban plume is quite 25
different than that of the rural ozone. At the peripheral stations downwind of the city the 180 µg/m3hourly standard of population warning (EU Directive 92/72/EEC) is relatively often exceeded in summer and the 360 µg/m3hourly standard of alert could be reached (Ziomas et al., 1998; Kalabokas and Bartzis, 1998). For example in 1996, if all over the
ACPD
3, 4989–5018, 2003 Climatology of rural surface ozone in Greece P. D. Kalabokas and C. C. Repapis Title Page Abstract Introduction Conclusions References Tables Figures J I J I Back CloseFull Screen / Esc
Print Version Interactive Discussion year ozone measurements are considered, the 8-hour 110 µg/m3 EU health standard
was exceeded for about 30% of the days but also about 2% of the hourly values were higher than the 180 µg/m3 EU population warning threshold, which is not observed in rural ozone records. Therefore, the development of photochemical pollution abatement measures is necessary. Nevertheless, all the above observations related with the pres-5
ence of high ozone background raise questions about the effectiveness of such local actions.
There are other measurements also showing that the high ozone levels are spread all over the area like the data-set of the Athens peripheral Demokritos station (Kal-abokas et al., 1996; Kal(Kal-abokas et al., 2000), which operated for a research study for 10
three years (1992–1995). Similar results were obtained during short-term intensive measuring campaigns over the Aegean Sea (MEDCAPHOT-TRACE campaign in sum-mer 1994, PAUR campaign in sumsum-mer 1996) using aircraft and surface measurements (Ziomas et al., 1998; PAUR report, 1998). Recent continuous 3-year (1997–1999) mea-surements in the island of Crete agree also with the meamea-surements presented above 15
(Kouvarakis et al., 2000). In addition, vertical ozone summer concentrations measured in this area by ozone soundings through the whole troposphere, were above 120 µg/m3 (Varotsos et al., 1993; Varotsos et al., 1994; PAUR report, 1998).
Concerning the summer afternoon ozone interannual variation (Fig. 11), it has to be noticed that they follow quite well the ozone fluctuations of the high altitude mountain-20
ous Central European rural ozone stations, Wank and Zugspitze, which are represen-tative for the regional background of the boundary layer and the free troposphere. The relatively stable summer ozone levels between 1987–1996, are also observed in these stations as in the Athens stations, as well as the tendency for lower summer levels after 1996, which are signs that the rural ozone levels around Athens are influenced by the 25
regional ozone background (TOR-2 report, 1999).
Due to the complexity of the phenomenon of the increased tropospheric ozone lev-els, further research is needed for the study of the important parameters governing the formation and distribution of rural ozone in the boundary layer and the free troposphere
ACPD
3, 4989–5018, 2003 Climatology of rural surface ozone in Greece P. D. Kalabokas and C. C. Repapis Title Page Abstract Introduction Conclusions References Tables Figures J I J I Back CloseFull Screen / Esc
Print Version Interactive Discussion
© EGU 2003 in the south-eastern part of the European continent. Similar studies have already
de-termined the impact of North American pollutant emissions on the rural ozone levels arriving at the Atlantic coast in Europe as well as the East Asian influence on the US Pacific coast (Parrish et al., 1993; Jacob et al., 1993; Jaffe et al., 1999). Since in Europe still few similar studies exist so far (EUROTRAC report, 1997) continuous monitoring of 5
rural ozone and its precursors in the area is important in order to evaluate the export of ozone and its precursors from the European continent. The reason is that export of ozone and its precursors from Europe is expected to occur from the Eastern bound-aries of the continent (EUROTRAC report, 1997) and the examined area is located on the most sunshine-abundant part of this boundary. According to the general circula-10
tion of air masses over southeast Europe the area surrounding Athens is under the influence of north-northeasterly flow during summer and therefore pollution influence from Eastern Europe is to be expected in the first place (Furlan, 1977). Consequently the precursor emissions in Athens are expected to influence the rural ozone levels to the south toward the Libyan coast, which is confirmed by aircraft measurements (Kal-15
los, 1995). In any case, it is generally admitted already that large-scale reductions in the emissions of ozone precursors must take place in order to control the widespread increase of ozone in continental or global scale while a priority in the NOx reduction should be given for large-scale (regional or global) ozone control (Megie, 1996). The development of the best cost-effective scenario is not an easy task due to the accom-20
panying socio-economic implications of any decision since many practices in the vital sectors of energy use and transportation have to be changed.
5. Conclusions
Based on long-term rural ozone measurements of three stations in Central Greece, Aliartos (rural), Liossia (urban peripheral) and Geoponiki (urban background) the fol-25
lowing remarks could be made:
ACPD
3, 4989–5018, 2003 Climatology of rural surface ozone in Greece P. D. Kalabokas and C. C. Repapis Title Page Abstract Introduction Conclusions References Tables Figures J I J I Back CloseFull Screen / Esc
Print Version Interactive Discussion the rural values at Liossia. This reflects the different site characteristics influencing the
nocturnal physical ozone destruction to the ground. Liossia is located on a mountain slope but Aliartos in a plain where strong night inversions are observed. On the other hand there is a good agreement of the observed levels if the afternoon values (12:00– 18:00, period with the best vertical mixing and the maximum photochemistry) are only 5
compared.
In all three stations there is a clear seasonal variation of the mixing ratios of rural ozone with average summer afternoon values at about 120 µg/m3in August and lowest winter afternoon values at about 50 µg/m3in December-January. This implies that high summer values exist all over the area.
10
The fact that the secondary summer maximum in the rural ozone seasonal variation in the area is stronger than the spring maximum (very common in most northern Eu-ropean stations) is in favor of the hypothesis of the long-range photochemical ozone production and transport during summer, indicating a transboundary pollution problem. For 1996 the common year of operation of the three stations a very good correlation 15
between the rural afternoon ozone concentrations at Aliartos and the corresponding levels of Liossia and Geoponiki is observed confirming the homogenous distribution of rural ozone in the area.
It comes out that the average rural summer ozone concentrations during the after-noon remain at the same levels at about 120 µg/m3 during the 13-year period 1987– 20
1999. The slight changes observed correspond to similar fluctuations observed at rural high mountain central European stations.
It is remarkable that in rural air the EU standard for human health protection (110 µg/m3, 8-hour average) can be frequently exceeded during almost all the warm period of the year, (May to September) at noon and afternoon hours at all three sta-25
tions examined. The 75-percentile of rural afternoon ozone during these months is constantly higher than 110 µg/m3. Serious violations are also observed regarding the vegetation protection standard for forests (AOT 40, 10 000 ppbh for a 6 month growing season). This level is exceeded in Aliartos by a factor of 2 and at Liossia by a factor of
ACPD
3, 4989–5018, 2003 Climatology of rural surface ozone in Greece P. D. Kalabokas and C. C. Repapis Title Page Abstract Introduction Conclusions References Tables Figures J I J I Back CloseFull Screen / Esc
Print Version Interactive Discussion
© EGU 2003 3.
It has to be noticed that the ozone levels attributed to the city activities (difference between urban and rural levels) is only a fraction of the ozone measured downwind of the urban area. For July the city-produced ozone at Liossia is about the one third and for Geoponiki about the one fourth of the afternoon ozone levels measured under 5
southerly winds, which underlines the limits of the local efforts for the abatement of photochemical pollution.
Acknowledgements. This work was supported by the Research Committee of the Academy of Athens.
References 10
Bates, D.: The effects of ozone on plants and people, In “Chemistry of the Atmosphere: Its Impact on Global Change”, Calvert J. (Ed.), Blackwell Scientific Publications, 239–244, 1994. Beck, J. and Grennfeld, P.: Distribution of ozone over Europe. In the Proceedings of the EU-ROTRAC Symposium 92, P.M. Borell et al., (Eds), SPB Academic Publishing bv, 43–58, 1993.
15
Bonasoni, P., Stohl, A., Cristofanelli, P., Calzolari, F., Colombo, T., and Evangelisti, F.,: Back-ground ozone variations at the Mt. Cimone station, Atmosph. Environ., 34, No. 29–30, 5183– 5190, 2000.
EU Directive 92/72/EEC: Official Journal of the European Communities No L 297/1.
EUROTRAC report: Photo-oxidants, Acidification and Tools: Policy Application of EUROTRAC 20
results. The report of the EUROTRAC Application Project (Volume 10), Eds. P. Borrell et al., Springer, 41–69, 1997.
Finlayson-Pitts, B. and Pitts, J. Jr.: Tropospheric air pollution: Ozone, Airborne toxics, Polycyclic Aromatic Hydrocarbons, and Particles, Science, 276, 1045–1051, 1997.
Furlan, D.: The climate of southeast Europe. In: World Survey of Climatology, Vol. 6, Climates 25
of Central and Southern Europe (Ed. C. C. Wallen), Elsevier, 185–224, 1977.
Glavas, S.: Surface ozone and NOx concentrations at a high altitude Mediterranean site, Greece, Atmosph. Environ., 33, 3813–3820, 1999.
ACPD
3, 4989–5018, 2003 Climatology of rural surface ozone in Greece P. D. Kalabokas and C. C. Repapis Title Page Abstract Introduction Conclusions References Tables Figures J I J I Back CloseFull Screen / Esc
Print Version Interactive Discussion Jacob, D., Logan, J.A., Gardener, G. M., Yevich, R.M., Spivakowsky, C.M., and Wofsy, S.C.:
Factors regulating ozone over the United States and its export to the global atmosphere, J. Geophys. Res. 98, 14 817–14 826, 1993.
Jaffe, D., Anderson, T., Covert, D., Kotchenruther, R., Trost, B., Danielson, J., Simpson, W., Berntsen, T., Karlsdottir, S., Blake, D., Harris, J., Carmichael, G., and Uno, I.: Transport of 5
Asian air pollution to North America, Geophys. Res. Ltrs., 26, No. 6, 711, 1999.
Kalabokas, P. D., Amanatidis, G. T., and Bartzis, J. G.: Rural ozone levels at an Eastern Mediterranean site (Attica, Greece). In the Proceedings of the XVIII Quadrennial Ozone Symposium, (Eds.) R. Bojkov and G. Visconti, L’ Aquila, Italy, 379–382, 1996.
Kalabokas, P. D. and Bartzis, J. G.: Photochemical air pollution characteristics at the station of 10
the NCSR-Demokritos, during the MEDCAPHOT-TRACE campaign, Greece (20 August–20 September 1994), Atmosph. Environ., 32, No. 12, 2123–2139, 1998.
Kalabokas, P. D., Viras, L. G., Repapis, C. C., and Bartzis, J. G.: Analysis of the 11-year record (1987-1997) of air pollution measurements in Athens, Greece. Part II: Photochemical pollutants, Global Nest: The International Journal, 1, No. 3, 169–176, 1999.
15
Kalabokas, P. D., Viras L. G., Bartzis J. G., and Repapis C. C.: Mediterranean rural ozone characteristics around the urban area of Athens, Atmosph. Environ., 34, No. 29–30, 5199– 5208, 2000.
Kalabokas, P. D.: Surface Ozone Characteristics at the Periphery of the Urban Area of Athens, Greece. In the Proceedings of the 8th European Symposium on Physicochemical Behaviour 20
of atmospheric pollutants (on CD-ROM), September 2001, Torino, Italy, 2001.
Kallos, G.: Transport and transformation of air pollutants from Europe to the east Mediterranean region. Progress report, contract AVI-CT92-0005. Eur. Comm. Environ. Res. Programme Avicenne, Brussels, 1995.
Kley, D., Geiss, H., and Mohnen, V.: Tropospheric ozone at elevated sites and precursor emis-25
sions in the United States and Europe, Atmosph. Environ., 28, 149–158, 1994.
Kourtidis, K., Ziomas, I., Zerefos, C., Balis, D., Suppan, P., Vassaras, A., Kosmidis, V., and Kentrarchos, A. On the background ozone values in Greece. 7th European Symposium on Physico-chemical Behaviour of Atmospheric Pollutants: The oxidizing capacity of the Tropo-sphere, EUR 17482 EN, 456–461, Venice, Italy, 1996.
30
Kouvarakis G., Tsigaridis, K., Kanakidou, M., and Mihalopoulos, N..: Temporal variations of surface regional background ozone over Crete Island in the southeast Mediterranean, J. Geoph. Res., 105, D4, 4399–4407, 2000
ACPD
3, 4989–5018, 2003 Climatology of rural surface ozone in Greece P. D. Kalabokas and C. C. Repapis Title Page Abstract Introduction Conclusions References Tables Figures J I J I Back CloseFull Screen / Esc
Print Version Interactive Discussion
© EGU 2003
Megie, G.: Ozone and oxidant properties of the troposphere (in French). La Meteorologie, 13 (8e serie), 11–28, 1996.
Millan, M. M., Artinano, B., Alonso, L., Castro, M., Fernandez-Patier, R., and Goberna, J.: Mesometeorological cycles of air pollution in the Iberian Peninsula. CEC-DGXII Air Pollution Research Report 44, Contract EV4V-0097E, Brussels, 1992.
5
MinEnv report: Atmospheric pollution in Athens – 1999. Directorate of air pollution and noise control, Ministry of Environment (in Greek), 2000.
Parrish, D. D., Holloway, J. S., Trainer, M., Murphy, P. C., Forbes, G. L., and Fehsenfeld, F. C.: Export of North American ozone pollution to the North Atlantic Ocean, Science, 259, 1436–1439, 1993.
10
PAUR report: Photochemical Activity and Solar Ultraviolet Radiation (PAUR), Environment Pro-gram, Contract No. ENV4-CT95-0048, EU-DGXII, 1998.
PORG report: UK Photochemical Oxidants Review group, Department of the Environment, London, 1997.
Repapis, C., Zerefos, C., and Tritakis B.: On the Etesians over the Aegean, Proc. Acad. Athens, 15
52, 572–606, 1977.
Scheel H. E., Areskoug, H., Geiß, H., Gomiscek, B., Granby, K., Haszpra, H., Klasinc, L., Kley, D., Laurila, T., Lindskog, A., Roemer, M., Schmitt, R., Simmonds, P., Solberg, S., and Toupance, G.: On the spatial distribution and seasonal variation of lower-troposphere ozone over Europe, J. Atmos. Chem, 28, 11–28, 1997.
20
TOR-2 report: Tropospheric Ozone Research (TOR-2), Annual report 1999, EUROTRAC-2, GSF-Munich, Germany, 1999.
Varotsos, C., Kalabokas, P., and Chronopoulos, G.: Atmospheric ozone concentration at Athens, Greece. Part II: Vertical ozone distribution in the troposphere, Atmosph. Res., 30, 151–155, 1993.
25
Varotsos C., Chronopoulos G., and Kalabokas, P.: Seasonal variation and cross tropopause ozone exchange at Athens, Greece. In the Proccedings of the 3rd EUROTRAC Symposium-Photooxidants: Precursors and products, 305–309, April 1994, Garmisch-Partenkirchen, Germany, 1994.
Volz, A. and Kley, D.: Evaluation of the Montsouris series of ozone measurements made in the 30
nineteenth century, Nature, 332, 240–242, 1988.
Ziomas, I.: The Mediterranean Campaign of Photochemical Tracers-Transport and Chemical Evolution (MEDCAPHOT-TRACE): An outline, Atmosph. Environ., 32, 2045–2054, 1998.
ACPD
3, 4989–5018, 2003 Climatology of rural surface ozone in Greece P. D. Kalabokas and C. C. Repapis Title Page Abstract Introduction Conclusions References Tables Figures J I J I Back CloseFull Screen / Esc
Print Version Interactive Discussion Ziomas, I. C., Tzoumaka, P., Balis, D., Melas, D., Zerefos, C. S., and Klemm, O.: Ozone
episodes in Athens, Greece. A modelling approach using data from the MEDCAPHOT-TRACE, Atmosph. Environ., 32, 2313–2322, 1998.
ACPD
3, 4989–5018, 2003 Climatology of rural surface ozone in Greece P. D. Kalabokas and C. C. Repapis Title Page Abstract Introduction Conclusions References Tables Figures J I J I Back CloseFull Screen / Esc
Print Version Interactive Discussion
© EGU 2003
Figure 1: Map of the area including the rural station of Aliartos and the Athens basin with elevation contours at 200m intervals. The locations of the Liossia and Geoponiki stations in the Athens basin are marked with a black cycle and a triangle respectively. Residential areas are indicated by stippling.
Fig. 1. Map of the area including the rural station of Aliartos and the Athens basin with elevation contours at 200 m intervals. The locations of the Liossia and Geoponiki stations in the Athens basin are marked with a black cycle and a triangle, respectively. Residential areas are indicated by stippling.
ACPD
3, 4989–5018, 2003 Climatology of rural surface ozone in Greece P. D. Kalabokas and C. C. Repapis Title Page Abstract Introduction Conclusions References Tables Figures J I J I Back CloseFull Screen / Esc
Print Version Interactive Discussion
Figure 2: Seasonal variation of average (bold line), 75th percentile (dashed line) ozone and daily mean NO2 (solid line) at Aliartos for 1996-1999
0 10 20 30 40 50 60 70 80 90 100 110 120 130 140 150 1 2 3 4 5 6 7 8 9 10 11 12
Month of the year
Concentration (µg/m3)
Fig. 2. Seasonal variation of average (bold line), 75th percentile (dashed line) ozone and daily mean NO2(solid line) at Aliartos for 1996–1999.
ACPD
3, 4989–5018, 2003 Climatology of rural surface ozone in Greece P. D. Kalabokas and C. C. Repapis Title Page Abstract Introduction Conclusions References Tables Figures J I J I Back CloseFull Screen / Esc
Print Version Interactive Discussion
© EGU 2003
Figure 3: Diurnal variation for July-August rural ozone at Aliartos (dashed line, 1996-1999), Liossia (bold line) and Geoponiki (solid line) for 1987-1996 (only days with north winds and average daily wind speeds >5m/s were included for the last two stations)
0 10 20 30 40 50 60 70 80 90 100 110 120 130 140 150 0 3 6 9 12 15 18 21 24 Hour Concentration (µg/m3)
Fig. 3. Diurnal variation for July–August rural ozone at Aliartos (dashed line, 1996–1999), Liossia (bold line) and Geoponiki (solid line) for 1987–1996 (only days with north winds and average daily wind speeds > 5 m/s were included for the last two stations).
ACPD
3, 4989–5018, 2003 Climatology of rural surface ozone in Greece P. D. Kalabokas and C. C. Repapis Title Page Abstract Introduction Conclusions References Tables Figures J I J I Back CloseFull Screen / Esc
Print Version Interactive Discussion
Figure 4: Seasonal variation of 6h rural afternoon (12:00-18:00) average (solid line) and 75 percentile (dashed line) ozone at Aliartos for 1996-1999
0 10 20 30 40 50 60 70 80 90 100 110 120 130 140 150 1 2 3 4 5 6 7 8 9 10 11 12
Month of the year
Concentration (µg/m3)
Fig. 4. Seasonal variation of 6 h rural afternoon (12:00–18:00) average (solid line) and 75 percentile (dashed line) ozone at Aliartos for 1996–1999.
ACPD
3, 4989–5018, 2003 Climatology of rural surface ozone in Greece P. D. Kalabokas and C. C. Repapis Title Page Abstract Introduction Conclusions References Tables Figures J I J I Back CloseFull Screen / Esc
Print Version Interactive Discussion
© EGU 2003
Figure 5: Seasonal variation of 6h rural afternoon (12:00-18:00) ozone average (bold line), 75th percentile (dashed line) and average NO2 (solid line) at Liossia for 1987-1996 (only days with north winds and average daily wind speeds >5m/s were included)
0 10 20 30 40 50 60 70 80 90 100 110 120 130 140 150 1 2 3 4 5 6 7 8 9 10 11 12
Month of the year
Concentration (µg/m3)
Fig. 5. Seasonal variation of 6 h rural afternoon (12:00–18:00) ozone average (bold line), 75th percentile (dashed line) and average NO2(solid line) at Liossia for 1987–1996 (only days with north winds and average daily wind speeds > 5 m/s were included).
ACPD
3, 4989–5018, 2003 Climatology of rural surface ozone in Greece P. D. Kalabokas and C. C. Repapis Title Page Abstract Introduction Conclusions References Tables Figures J I J I Back CloseFull Screen / Esc
Print Version Interactive Discussion
Figure 6: Seasonal variation of 6h rural afternoon (12:00-18:00) ozone average (bold line), 75th percentile (dashed line) and average NO2 (solid line) at Geoponiki for 1987-1996 (only days with north winds and average daily wind speeds >5m/s were included)
0 10 20 30 40 50 60 70 80 90 100 110 120 130 140 150 1 2 3 4 5 6 7 8 9 10 11 12
Month of the year
Concentration (µg/m3)
Fig. 6. Seasonal variation of 6 h rural afternoon (12:00–18:00) ozone average (bold line), 75th percentile (dashed line) and average NO2 (solid line) at Geoponiki for 1987–1996 (only days with north winds and average daily wind speeds > 5 m/s were included).
ACPD
3, 4989–5018, 2003 Climatology of rural surface ozone in Greece P. D. Kalabokas and C. C. Repapis Title Page Abstract Introduction Conclusions References Tables Figures J I J I Back CloseFull Screen / Esc
Print Version Interactive Discussion
© EGU 2003
Figure 7: Correlation of 6h average rural afternoon ozone levels (12:00-18:00) of the warm period (April-September) 1996 between Aliartos and Liossia
y = 1,2538x - 15,922 R2 = 0,3301 0 50 100 150 200 250 300 0 50 100 150 200 250 300 Concentration (µg/m3) - Aliartos Concentration (µg/m3) - Liossia
Fig. 7. Correlation of 6 h average rural afternoon ozone levels (12:00–18:00) of the warm period (April–September) 1996 between Aliartos and Liossia.
ACPD
3, 4989–5018, 2003 Climatology of rural surface ozone in Greece P. D. Kalabokas and C. C. Repapis Title Page Abstract Introduction Conclusions References Tables Figures J I J I Back CloseFull Screen / Esc
Print Version Interactive Discussion Figure 8: Correlation of 6h average rural afternoon ozone levels (12:00-18:00) of the warm
period (April-September) 1996 between Aliartos and Liossia under strong winds (WS>5 m/s)
y = 1,0542x - 2,4311 R2 = 0,6869 0 50 100 150 200 250 300 0 50 100 150 200 250 300 Concentration (µg/m3) - Aliartos Concentration (µg/m3) - Liossia
Fig. 8. Correlation of 6 h average rural afternoon ozone levels (12:00–18:00) of the warm period (April–September) 1996 between Aliartos and Liossia under strong winds (WS> 5 m/s).
ACPD
3, 4989–5018, 2003 Climatology of rural surface ozone in Greece P. D. Kalabokas and C. C. Repapis Title Page Abstract Introduction Conclusions References Tables Figures J I J I Back CloseFull Screen / Esc
Print Version Interactive Discussion
© EGU 2003
Figure 9: Correlation of 6h average rural afternoon ozone levels (12:00-18:00) of the warm period (April-September) 1996 between Aliartos and Geoponiki
y = 1,0151x - 3,3275 R2 = 0,374 0 50 100 150 200 250 300 0 50 100 150 200 250 300 Concentration (µg/m3) - Aliartos Concentration (µg/m3) - Geoponiki
Fig. 9. Correlation of 6 h average rural afternoon ozone levels (12:00–18:00) of the warm period (April–September) 1996 between Aliartos and Geoponiki.
ACPD
3, 4989–5018, 2003 Climatology of rural surface ozone in Greece P. D. Kalabokas and C. C. Repapis Title Page Abstract Introduction Conclusions References Tables Figures J I J I Back CloseFull Screen / Esc
Print Version Interactive Discussion Figure 10: Correlation of 6h average rural afternoon ozone levels (12:00-18:00) of the warm
period (April-September) 1996 between Aliartos and Geoponiki under strong winds (WS>5 m/s) y = 0,9109x + 1,9537 R2 = 0,6896 0 50 100 150 200 250 300 0 50 100 150 200 250 300 Concentration (µg/m3) - Aliartos Concentration (µg/m3) - Geoponiki
Fig. 10. Correlation of 6 h average rural afternoon ozone levels (12:00–18:00) of the warm pe-riod (April–September) 1996 between Aliartos and Geoponiki under strong winds (WS> 5 m/s).
ACPD
3, 4989–5018, 2003 Climatology of rural surface ozone in Greece P. D. Kalabokas and C. C. Repapis Title Page Abstract Introduction Conclusions References Tables Figures J I J I Back CloseFull Screen / Esc
Print Version Interactive Discussion
© EGU 2003
Figure 11: Evolution of July-August rural afternoon (12:00 - 18:00) ozone levels at Aliartos (gray), Liossia (black) and Geoponiki (white) for 1987-1999 (only days with north winds and WS>5m/s were considered for the last two stations)
0 10 20 30 40 50 60 70 80 90 100 110 120 130 140 150 1987-89 1990-93 1994-96 1996-99 Time period Concentration (µg/m3)
Fig. 11. Evolution of July–August rural afternoon (12:00–18:00) ozone levels at Aliartos (gray), Liossia (black) and Geoponiki (white) for 1987–1999 (only days with north winds and WS> 5 m/s were considered for the last two stations).
ACPD
3, 4989–5018, 2003 Climatology of rural surface ozone in Greece P. D. Kalabokas and C. C. Repapis Title Page Abstract Introduction Conclusions References Tables Figures J I J I Back CloseFull Screen / Esc
Print Version Interactive Discussion Figure 12: Diurnal variation for July of the urban (south winds, black) and rural (strong north
winds, gray) ozone in Athens for 1987-1996 (Liossia: solid line. Geoponiki: dashed line).
0 20 40 60 80 100 120 140 160 180 200 0 3 6 9 12 15 18 21 24
Hour of the day
Concentration (µg/m3)
Fig. 12. Diurnal variation for July of the urban (south winds, black) and rural (strong north winds, gray) ozone in Athens for 1987–1996 (Liossia: solid line. Geoponiki: dashed line).