HAL Id: hal-02149137
https://hal.archives-ouvertes.fr/hal-02149137
Submitted on 6 Jun 2019
HAL is a multi-disciplinary open access
archive for the deposit and dissemination of
sci-entific research documents, whether they are
pub-lished or not. The documents may come from
teaching and research institutions in France or
abroad, or from public or private research centers.
L’archive ouverte pluridisciplinaire HAL, est
destinée au dépôt et à la diffusion de documents
scientifiques de niveau recherche, publiés ou non,
émanant des établissements d’enseignement et de
recherche français ou étrangers, des laboratoires
publics ou privés.
A note on the measurement of socioeconomic
inequalities in life years lost by cause of death
Aurélien Latouche, Per Kragh Andersen, Grégoire Rey, Margarita
Moreno-Betancur
To cite this version:
Aurélien Latouche, Per Kragh Andersen, Grégoire Rey, Margarita Moreno-Betancur. A note on
the measurement of socioeconomic inequalities in life years lost by cause of death. Epidemiology,
Lippincott, Williams & Wilkins, 2019, 30 (4), pp.569-572. �10.1097/EDE.0000000000001022�.
�hal-02149137�
A note on the measurement of socioeconomic inequalities in life
years lost by cause of death
Aur´elien Latouche, Per Kragh Andersen, Gr´egoire Rey and Margarita Moreno-Betancur
December 13, 2018
Abstract
Quantifying socioeconomic inequalities in health in absolute terms is of prime interest for decision-making and for international comparisons. The Slope Index of Inequality (SII), an index that quantifies absolute socioeconomic inequalities, was recently formalized, particularly in the context of mortality differences measured in the rate or hazard scale. However, absolute inequalities using either rates or hazards do not translate into a time dimension, which makes their interpretation difficult for policy makers. We propose an extension of the SII in terms of the expected number of life years lost before an upper age, as well as its decomposition by cause of death. The SII in the life years lost metric quantifies the extent to which life expectancy is shortened when comparing the higher and lower ends of the socioeconomic scale. The methodology proposed builds on recent developments in survival analysis for decomposing the number of life years lost according to cause of death using a pseudo-value approach. We illustrate our proposal using a representative 1% sample of the French population. The SII in the life years lost metric is easily understood, and the decomposition of the all-cause mortality SII into parts attributable to given causes provides a sound estimation of the burden of different causes of death on absolute socioeconomic inequalities in mortality.
Introduction
All OECD countries are faced with substantial inequalities in health status among socioeconomic groups within their populations [1]. For quantifying absolute inequalities defined as a gradient in health across the socioeconomic scale, the Slope Index of Inequality (SII) is a commonly used index [2].
Recently, the conceptualization of this index was reviewed, thereby providing a formal and broader definition [3]. This work served to clarify the target parameter, specifically the type of inequalities that this index aims to measure, and provided extensive guidance for its implementation. The key to the widespread use of the SII is its reliance on the socioeconomic rank x as exposure. Following the convention in Moreno-Betancur et al. [3], for a given subject, this is defined as the proportion of the population with higher socioeconomic status, thus measuring exposure to an adverse socio-ecomic position. The result is an index that is comparable across populations, at least to a greater extent than measures using the socioeconomic category itself as measure of exposure [4].
Following Moreno-Betancur et al. [3], let y be the chosen aspect of the health outcome distribution (e.g., the expected value or the hazard rate). The SII is then defined as the parameter that provides the best linear approximation of the association between y and x, also known as the least false parameter. Thus, considering a linear model y = gα(x) = y0+ αx, the SII is defined as α∗, the least false parameter in this linear model, or equivalently SII =
gα∗(1) − gα∗(0). The SII is not a true population parameter but simply a summary measure of the linear association
across the entire scale. For time-to-event outcomes, y can be taken to be the hazard of the event. In the presence of competing risks, a cause-specific measure, SIIk, can be estimated for each cause k of the event by taking y to be
the cause-specific hazard. Since a linear regression is employed, an additivity property is induced: the overall SII is simply the sum of the cause-specific SIIkover the causes of the event.
Previous analyses of French data illustrated the estimation of socioeconomic inequalities in mortality using the haz-ard rate as a health outcome measure, focusing either on all-cause mortality or cause-specific mortality [3]. However, absolute inequalities using hazard rates do not translate into a time dimension, making their interpretation difficult for policy-makers. Alternatively, the life years lost metric and the cause-specific decomposition of life years lost, as newly defined in [5, 6], would be more meaningful for gauging public health impact. This metric takes as its starting point the partial (or temporary) life expectancy that is also known as the restricted mean lifetime. This quantity is defined in terms of the survival curve and, therefore, a practical advantage is that measures in this metric are intrinsically adjusted for age, which is crucial with mortality as an outcome and when between-population comparisons are intended.
These appealing features motivate our proposal of an SII in the life years lost metric, which we build based on the general definition above using the socioeconomic rank as exposure in appropriate linear regression models.
Methods
For an upper age τ , the τ -restricted mean lifetime,R0τS(t)dt, is the area under the survival curve up to τ . It has the interpretation as the expected number of years lived up to age τ . Thus, L(0, τ ) = τ −R0τS(t)dt is the expected number of life years lost before age τ [5]. Since, for all values of t, S(t) +P
kFk(t) = 1, L(0, τ ) can be decomposed by
cause of death as L(0, τ ) = P
k
Rτ
0 Fk(t)dt, where Fk(t) is the cumulative incidence for cause of death k, i.e., the
probability of death from cause k before t.
For individual–level right–censored time-to-event data, a method based on pseudo-values to perform linear regres-sion for the expected number of life years lost due to a given cause k was proposed by [5]. The methodology can be further adapted to consider life expectancy given survival to a certain age t0by considering the conditional survival
function S(t)/S(t0) and the conditional cumulative incidence functions Fk(t)/S(t0) [5]. Of note, this relates to the
conditionalpartial or temporary life expectancy in demography as proposed by [7]. The pseudo-value approach can be extended to scenarios with delayed entry (left truncation), see Grand and Putter [8] and Grand et al. [9].
We propose to use this method to estimate the all-cause SII and the cause-specific SIIk (k = 1, . . . , K) in the
new metric, by fitting linear regression models for the life years lost due to all causes and due to cause k, respectively, with x as predictor. The linearity of the regression models used, ensures that the following decomposition holds:
d SII = P
kSIId
k
, where dSII and dSIIk are the estimates obtained. An interesting measure is thus the percentage of the all-cause SII attributable to a given cause.
If the socioeconomic status is given by an ordered categorical variable (as it is often the case), we approximate the rank of each person in the j-th category by the rank x(j)defined as the percentage of the population in strictly higher
groups plus half of the percentage of the population in group j.
Equivalently, the rank x(j)is the mid-point of the position of group j in the cumulative distribution of the population
ordered from high to low socioeconomic position.
In our example we use a four-category measure of education level as a proxy for socioeconomic group.
Illustrative example
For illustration, we consider the example of [3], which drew data from a 1% longitudinal sample of the French pop-ulation started in 1968. We will estimate the SII in life years lost before age 90 given survival to 30 years, by cause of death for three periods (1982–1988), (1990–1996) and (1999–2005). Thus, the observed data are left-truncated and right censored. The sample sizes at the beginning of each of these periods (i.e. the number of individuals aged 30-84) were n=250 483 (1982), n=275 648 (1990) and n=320 520 (1999). The socioeconomic group was defined by the edu-cation level, in four categories (incomplete; elementary eduedu-cation; general and voedu-cational qualifiedu-cation and high school diploma or higher). The socioeconomic rank was derived as described above.
[Table 1 about here.]
Table 1 provides crude estimates of the conditional restricted mean lifetimes up to age 90 given survival until the age of 30 years, as well as the overall number of years lost between 30 and 90 years and the corresponding cause-specific decomposition. The causes of death are classified as cancer, cardiovascular, external and other causes. The estimates in the table are given by sex, period, and socioeconomic category. Note that the cause-specific years lost add up to the overall number of years lost, and that the overall number of years lost and the restricted mean life time add up to 60 years, the maximum number of years lived between ages 30 and 90. In general, the number of life years lost increases with lower education.
[Table 2 about here.]
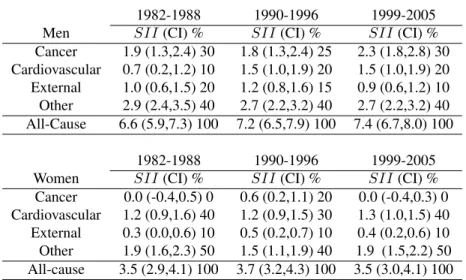
The SII estimates in the life years lost metric obtained using the proposed methodology are summarized in Table 2, which shows, for each sex, the estimated all-cause SII and the corresponding SIIkby cause of death.
Of note, a positive (respectively negative) SII value, corresponds to a loss (resp. gain) in the expected number of life years lost when comparing the least educated to the most educated.
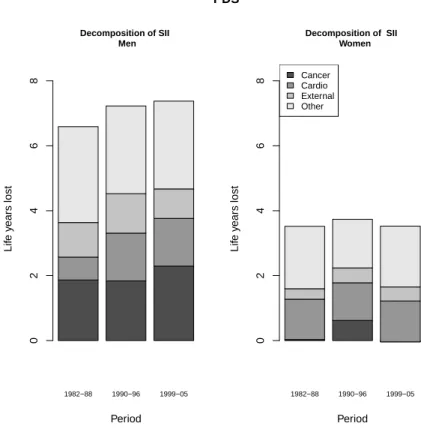
Estimates of the all-cause SII in life years lost were higher in men than in women for each period, with the loss in life years being roughly on average twice as large in men. On average, the least educated men lost 6.6 [95% confidence interval = 5.9; 7.3] years of life compared to the most educated in the first period. This loss increased in the next two periods reaching a loss of 7.4 [6.7; 8.0] life years. “Other” causes of death and cancer mortality had the largest contributions to the all-cause SII across all periods for men, with a stable contribution of around 40 % and 30 %, respectively, while external and cardiovascular causes of death contributed between 10 and 20 %.
For women, the loss was stable across all periods, with an all-cause SII of around 3.5 years of life lost. Con-sidering the contribution of each cause of death to the all-cause SII, “other” causes of death dominated followed by cardiovascular causes in all periods.
Finally, Figure 1 provides a graphical summary of the decomposition of the all-cause SII in life years lost by cause of death, for each period and by sex.
[Figure 1 about here.]
As compared to the results of the SII in the hazard metric (see Table 3 of [3]), the only discrepancy in contribution to the all-cause SII is for the men in the first period where the contribution of cardiovascular and external causes are switched. The intuition for this pattern is explained by the fact that this new metric is considering another way of taking age at death into account. Here, the external causes occur more frequently in younger people while cardiovascular causes are more frequent in the elderly. Meanwhile, social inequalities are higher in people under 65 than in older people.
Conclusion
We have proposed a novel SII that quantifies socioeconomic inequalities in mortality in terms of the life years lost, that is, the extent to which life expectancy is shortened when comparing the two ends of the socioeconomic scale. This metric is easily understood, and our proposal is of prime interest for conducting between-country comparisons or studying trends. The SII is an index that relies on the social grouping, as opposed to the total inequality as summarized by difference across a population of individuals. It overcomes the comparability problems related to differences in the socioeconomic composition of populations [1]. Indeed, the main appeal of such rank-based indices is that they account for changes in the distribution of the socioeconomic grouping over time or differences across populations, which is necessary when studying trends or making comparisons as there can be substantial variations [10].
As such, our proposal complements the life expectancy (at birth or restricted) which is the Swiss army knife measure of mortality when comparing inequality levels and trends. To get further insights of the mechanism driving health inequality in mortality, our proposal is further able to decompose the gradient by cause of death. The additivity of the SII ensures a coherence when decomposing by cause of death (contrary to measures based on the age at death). Finally, the proposed approach can be applied in a regression framework, providing possibilities of adjustment for covariates. The proposed approach easily extends to measures of healthy life expectancy and healthy life years lost [8]. An important requirement of this new metric is the choice of the upper age τ . We considered 90 years as the upper limit for reliability of death certificates in France. In practice, estimates across a range of upper limits may be of interest, notably considering a sex-specific upper limit. However, this dependence on the upper age is also found in total inequality measures such as the Potential Years lost or Restricted mean by socioeconomic status. A further requirement is that the SII only applies to ordered social groups and will not be appropriate to quantify inequalities in mortality across regions, occupations or between ethnic groups.
Finally, we have focused on absolute inequalities which are complementary to measures of relative inequalities. The simultaneous summary of relative and absolute trends is highly recommended [11]. The proposed methodology was developed in R and the code is available at https://github.com/moreno-betancur. Further developments to fasten computation time of the pseudo-value approach for large observational databases are currently investigated.
References
[1] J.P. Mackenbach, G. Menvielle, D. Jasilionis, and R. de Gelder. Measuring educational inequalities in mortality statistics. OECD Statistics Working Papers 2015/8, OECD Publishing, 2015.
[2] S.H. Preston, M.R. Haines, and E. Pamuk. International Population Conference, Manila, 1981: solicited papers, chapter Effects of industrialization and urbanization on mortality in developed countries, pages 233–54. Ordina Editions, 1981.
[3] M. Moreno-Betancur, A. Latouche, G. Menvielle, A. E. Kunst, and G. Rey. Relative index of inequality and slope index of inequality: a structured regression framework for estimation. Epidemiology, 26(4):518–527, 2015.
[4] J. P. Mackenbach and A. E. Kunst. Measuring the magnitude of socio-economic inequalities in health: an overview of available measures illustrated with two examples from Europe. Soc Sci Med, 44(6):757–771, 1997.
[5] P. K. Andersen. Decomposition of number of life years lost according to causes of death. Stat Med, 32(30):5278– 5285, 2013.
[6] P.K. Andersen, V. Canudas-Romo, and N. Keiding. Cause-specific measures of life years lost. Demographic Research, 29(41):1127–1152, 2013.
[7] E. E. Arriaga. Measuring and explaining the change in life expectancies. Demography, 21(1):83–96, 1984.
[8] M. K. Grand and H. Putter. Regression models for expected length of stay. Stat Med, 35(7):1178–1192, 2016.
[9] M. K. Grand, H. Putter, A. Allignol, and P.K. Andersen. A note on pseudo-observations and left-truncation. Biometrical J, 2018. (in press).
[10] A. Harper and J. Lynch. Methods in Social Epidemiology, chapter Health Inequalities: Measurement and Decom-position, pages 91–131. John Wiley & Sons, New York, 2017.
[11] N. B. King, S. Harper, and M. E. Young. Use of relative and absolute effect measures in reporting health inequal-ities: structured review. BMJ, 345:e5774, Sep 2012.
1982−88 1990−96 1999−05 Period Lif e y ears lost 0 2 4 6 8 Decomposition of SII Men 1982−88 1990−96 1999−05 Period Lif e y ears lost 0 2 4 6 8 Decomposition of SII Women PDS Cancer Cardio External Other
Figure 1: Permanent Demographic Sample (PDS): Decomposition of the all-cause SII in life years lost by cause of death, for each period and by sex. Cardio stands for Cardiovascular
Table 1: Restricted mean lifetime up to 90 years given survival until 30 years and overall and cause-specific life years lost up to age 90, given survival to 30 years, by sex, education level (incomplete (incomp), elementary education (elem) , general and vocational qualification (gen) and high school diploma or higher (high)), and period.
1982-1988 1990-1996 1999-2005
Men high gen elem incomp high gen elem incomp high gen elem incomp
Cancer 4.39 5.45 5.86 6.33 4.46 6.04 5.61 6.31 3.95 5.16 5.28 6.05 Cardiovascular 3.87 4.47 4.73 4.81 2.85 3.60 3.83 4.26 2.14 2.66 3.00 3.52 External 1.23 1.41 1.83 2.09 1.10 1.49 2.23 2.05 0.84 1.36 1.63 1.62 Other 3.04 3.38 4.17 5.40 2.77 2.97 3.65 5.06 2.50 3.35 4.19 5.06 All-Cause 12.53 14.71 16.60 18.62 11.18 14.10 15.32 17.68 9.43 12.52 14.10 16.25 Restr. mean 47.47 45.29 43.4 41.38 48.82 45.90 44.68 42.32 50.57 47.48 45.90 43.75
Women high gen elem incomp high gen elem incomp high gen elem incomp
Cancer 2.90 3.06 2.68 2.95 2.81 3.10 2.81 3.43 2.85 3.00 2.82 2.74 Cardiovascular 2.03 2.12 2.91 3.30 1.33 1.98 2.10 2.68 1.12 1.33 1.62 2.43 External 0.65 0.65 0.70 0.87 0.57 0.55 0.84 0.88 0.39 0.51 0.53 0.80 Other 1.61 2.26 2.21 3.32 1.66 1.88 1.96 3.11 1.28 1.83 2.07 3.22 All-Cause 7.19 8.08 8.51 10.44 6.38 7.50 7.71 10.10 5.64 6.66 7.03 9.19 Restr. mean 52.81 51.92 51.49 49.56 53.62 52.50 52.29 49.90 54.36 53.34 52.97 50.81
Table 2: Estimates of SII in life years lost up to age 90, given survival to 30 years, from all causes and by cause of death, 95% confidence intervals (CI) and percentage contribution to the all-cause SII (%), for each period and by sex.
1982-1988 1990-1996 1999-2005 Men SII (CI) % SII (CI) % SII (CI) % Cancer 1.9 (1.3,2.4) 30 1.8 (1.3,2.4) 25 2.3 (1.8,2.8) 30 Cardiovascular 0.7 (0.2,1.2) 10 1.5 (1.0,1.9) 20 1.5 (1.0,1.9) 20 External 1.0 (0.6,1.5) 20 1.2 (0.8,1.6) 15 0.9 (0.6,1.2) 10 Other 2.9 (2.4,3.5) 40 2.7 (2.2,3.2) 40 2.7 (2.2,3.2) 40 All-Cause 6.6 (5.9,7.3) 100 7.2 (6.5,7.9) 100 7.4 (6.7,8.0) 100 1982-1988 1990-1996 1999-2005 Women SII (CI) % SII (CI) % SII (CI) %
Cancer 0.0 (-0.4,0.5) 0 0.6 (0.2,1.1) 20 0.0 (-0.4,0.3) 0 Cardiovascular 1.2 (0.9,1.6) 40 1.2 (0.9,1.5) 30 1.3 (1.0,1.5) 40 External 0.3 (0.0,0.6) 10 0.5 (0.2,0.7) 10 0.4 (0.2,0.6) 10 Other 1.9 (1.6,2.3) 50 1.5 (1.1,1.9) 40 1.9 (1.5,2.2) 50 All-cause 3.5 (2.9,4.1) 100 3.7 (3.2,4.3) 100 3.5 (3.0,4.1) 100