© Birkhäuser Verlag, Basel, 2009
Socioeconomic status, working conditions and self-rated health
in Switzerland: explaining the gradient in men and women
Georg F. Bauer, Carola A. Huber, Gregor J. Jenny, Frithjof Müller, Oliver Hämmig
Division of Public and Organizational Health, Institute of Social and Preventive Medicine, University of Zurich and Center for Organizational and Occupational Sciences, ETH Zurich, Switzerland
Submitted: 24 August 2007; revised: 06 May 2008, 11 August 2008; accepted: 19 October 2008
Abstract
Objectives: Epidemiological research has confirmed the
associ-ation between socioeconomic status (SES) and health, but only a few studies considered working conditions in this relation-ship. This study examined the contribution of physical and psy-chosocial working conditions in explaining the social gradient in self-rated health.
Methods: A representative sample of 10 101 employees, 5003
women and 5098 men, from the Swiss national health survey 2002 was used. SES was assessed according to the EGP-scheme. Working conditions included exposure to physical disturbanc-es, physical strain, job insecurity, monotonous work and han-dling simultaneous tasks. For data analysis logistic regression analyses were performed.
Results: Data show a social gradient for self-rated health (SRH)
as well as for physical and psychosocial working conditions. Lo-gistic regression analysis controlling for age, gender and level of employment showed both physical and psychosocial work-ing conditions to be significant predictors of SRH. Physical and psychosocial working conditions such as physical disturbances from work environment, physical strains in doing the job, mo-notony at work, job insecurity etc. could explain most of the social gradient of SRH in men and women.
Conclusion: The study confirmed the relevance of modifiable
physical and psychosocial working conditions for reducing so-cial inequality in health. Gender differences need to be consid-ered in epidemiological and intervention studies.
Keywords: Socioeconomic status – Inequalities in health – Social gradient – Self-rated health – Physical and psychosocial working conditions.
International epidemiological research has shown the relation
between socioeconomic status and health.1–3 Bopp & Minder 4
could show mortality differences between educational groups for Swiss men and women in a representative, longitudinal study. Other studies from Switzerland showed that socioeco-nomic status is significantly associated with the incidence of
diseases or self-reported illness symptoms and disorders.5–7
Furthermore, there are Swiss studies showing that lower so-cioeconomic classes are more likely to get incapacitated and that male blue-collar workers and employees with a basic
educational level report more back pain than others.8,9 With
respect to gender it could be shown that the social gradient in health is more distinct for men, as women show smaller
so-cial inequalities in health.10–14 It is assumed that these smaller
social inequalities in health are partially due to a different dis-tribution of unhealthy employment status categories between
women and men.10,15,16
Several international studies have identified various factors
explaining socioeconomic inequalities in health,17 but only
few of the studies considered working conditions as part of its explanation. It is well established that psychosocial working conditions explain part of the association between
cardiovas-cular risks and socioeconomic status (SES).18,19 Other studies
examined the relationship of psychosocial working conditions and SES-related differences in general health status,
particu-larly looking at self-rated health.15,20–22 In epidemiological
research, measuring self-rated health (SRH) has a long tra-dition, being a very good predictor for future morbidity and
mortality.23,24 Two cross-sectional studies have analyzed
phys-ical and psychosocial working conditions simultaneously as causes of socioeconomic inequalities in health, using SRH as
outcome. Schrijvers et al.22 investigated 6932 working men
work-ing conditions and low job control as important mediators of
the social gradient. Borell et al.15 analyzed the role of
work-ing conditions, household material standards and household labor with regard to the association between socioeconomic status and SRH in Spanish employees. They could show that work organization variables (i.e. job insecurity, physical and psychosocial hazards) contributed in large part to the explana-tion of socioeconomic inequalities in SRH. Furthermore, their findings suggest differences with respect to the relationship between gender and work related risk factors. Other studies emphasize this fact by referring to a “gender-segregated labor
market”25, as job related risk factors differ between men and
women and thus are having a different effect on the social
gradient in health.10,15,16,25
With respect to Switzerland, one study analyzed the effects of job insecurity on health, including educational level as a
mod-erator.26 Based on a random sample of the Swiss population
the study suggested that higher-educated employees had more difficulties in coping with job insecurity than lower-educated employees.
Regarding socioeconomic status and health there is still a lim-ited scope of research with respect to the influence of work-ing conditions on this relationship. Thus, the present study aimed to examine the association between different physical and psychosocial working conditions and the social gradient in self-rated health for employees in Switzerland, using rep-resentative data of the Swiss Health Survey. The following research questions were addressed:
1. How is SES related to SRH in a representative sample of Swiss employees?
2. How are physical and psychosocial working conditions (e.g. exposure to physical disturbances, physical strain, job insecurity, monotonous work) related to SES and to SRH? 3. To what extent can physical and psychosocial working
conditions explain the social gradient of SRH?
4. Do physical and psychosocial working conditions differ-ently account for the explanation of the social gradient in SRH for both women and men?
Methods
The data originated from the Swiss Health Survey, which is carried out in five-year-intervals since 1992. For the present analysis the latest wave from 2002 was used. A representative sample of 19 706 inhabitants were interviewed by telephone (CATI), of which 16 141 additionally responded to a mailed questionnaire. A total of 11 795 were employed, whereof 1694 were self-employed and thus excluded from analysis, resulting in a final sample size of 10 101 participants. Gender
was almost equally distributed, yielding a sample of 5003 fe-male and 5098 fe-male participants.
Socioeconomic status (SES)
SES was operationalized according to the Erikson, Goldthorpe
and Portocarero (EGP) scheme.28 It included the employee’s
position and responsibility at work as well as educational level. For analysis, the 10 original classes were recoded into 5 classes: Class I included higher-grade professionals, Class II lower-grade professionals, administrators and officials, Class III routine non-manual employees in administration and com-merce, Class IV skilled manual workers, Class V semi- and unskilled manual workers and agricultural workers. This re-coding yielded the following distribution of the study sample: 9.7 % Class I (N = 979), 33.9 % Class II (N = 3420), 26.7 % Class III (N = 2700), 15.6 % Class IV (N = 1577), and 14.1 % Class V (N = 1425).
Self-rated health (SRH)
SRH was measured with a single Likert-item (How do you rate your health in general?) on a 5-point scale ranging from very good to very poor. For descriptive and logistic regression analysis, SRH was dichotomized into (very) good SRH and less than good SRH.
Working conditions: Items from the Swiss Health Survey se-lected as valid indicators for a national monitoring on „Work
and health in Switzerland“ were used for analysis.20
Physi-cal working conditions were assessed with items for physiPhysi-cal strain and exposure to physical disturbances. Physical strain was measured with a single question (Which of the following 4 specifications is correct to describe your physical activity at work?), with a forced choice between mostly sedentary work, a lot of walking, climbing stairs/transporting things and carrying heavy loads. Exposure to physical disturbances was assessed with a multiple-choice list of 14 dichotomized items (yes/no). All single disturbances were added to a sum score. For analy-sis, the sum score was recoded into four categories (no distur-bances, 1–2 disturdistur-bances, 3–4 disturdistur-bances, > 4 disturbances). Psychosocial working conditions comprised measures con-cerning monotonous work, handling simultaneous and new tasks, and job insecurity. These three items were part of a dichotomous multiple-choice list (yes/no) of items on work characteristics. Job insecurity was assessed with a single Lik-ert-item (Do you have fear of losing your current job?) on a four-point scale: yes – strongly, rather yes, no, rather not, no – not at all. For both descriptive and multivariate analysis, these categories were recoded into three groups: fear, rather no fear, no fear.
Level of employment and demographic variables: All analy-ses in this study were adjusted for age, gender and
employ-Table 1.
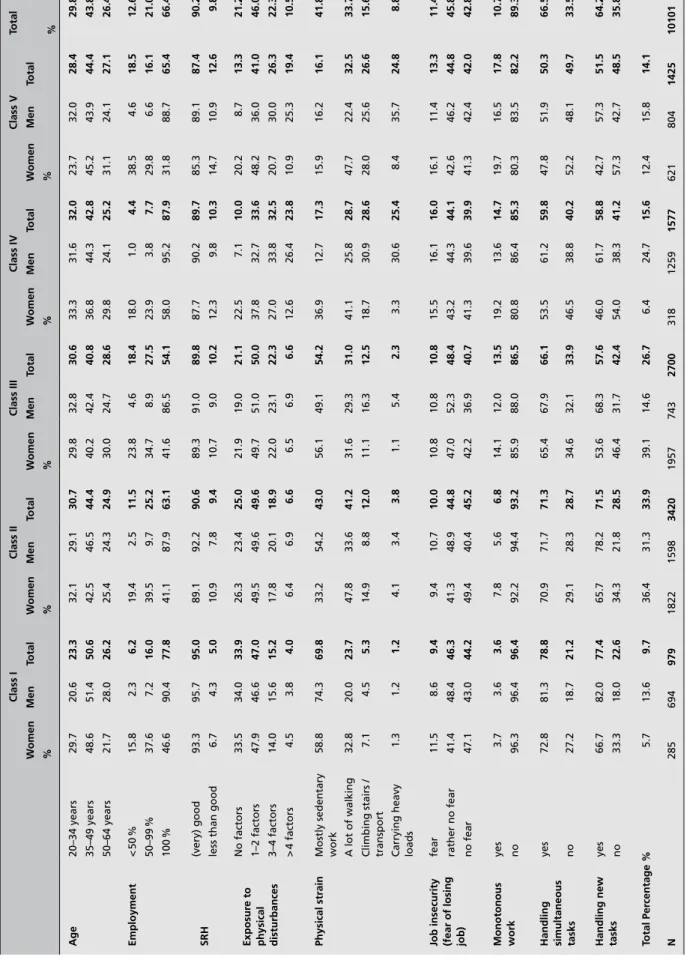
Frequency table for self-related health (SRH), working conditions and socioeconomic class.
Class I Class II Class III Class IV Class V Total W omen Men Total W omen Men Total W omen Men Total W omen Men Total W omen Men Total % % % % % % Age 20–34 years 29.7 20.6 23.3 32.1 29.1 30.7 29.8 32.8 30.6 33.3 31.6 32.0 23.7 32.0 28.4 29.8 35–49 years 48.6 51.4 50.6 42.5 46.5 44.4 40.2 42.4 40.8 36.8 44.3 42.8 45.2 43.9 44.4 43.8 50–64 years 21.7 28.0 26.2 25.4 24.3 24.9 30.0 24.7 28.6 29.8 24.1 25.2 31.1 24.1 27.1 26.4 Employment < 50 % 15.8 2.3 6.2 19.4 2.5 11.5 23.8 4.6 18.4 18.0 1.0 4.4 38.5 4.6 18.5 12.6 50–99 % 37.6 7.2 16.0 39.5 9.7 25.2 34.7 8.9 27.5 23.9 3.8 7.7 29.8 6.6 16.1 21.0 100 % 46.6 90.4 77.8 41.1 87.9 63.1 41.6 86.5 54.1 58.0 95.2 87.9 31.8 88.7 65.4 66.4 SRH (very) good 93.3 95.7 95.0 89.1 92.2 90.6 89.3 91.0 89.8 87.7 90.2 89.7 85.3 89.1 87.4 90.2
less than good
6.7 4.3 5.0 10.9 7.8 9.4 10.7 9.0 10.2 12.3 9.8 10.3 14.7 10.9 12.6 9.8 Exposur e to physical disturbances No factors 33.5 34.0 33.9 26.3 23.4 25.0 21.9 19.0 21.1 22.5 7.1 10.0 20.2 8.7 13.3 21.2 1–2 factors 47.9 46.6 47.0 49.5 49.6 49.6 49.7 51.0 50.0 37.8 32.7 33.6 48.2 36.0 41.0 46.0 3–4 factors 14.0 15.6 15.2 17.8 20.1 18.9 22.0 23.1 22.3 27.0 33.8 32.5 20.7 30.0 26.3 22.3 > 4 factors 4.5 3.8 4.0 6.4 6.9 6.6 6.5 6.9 6.6 12.6 26.4 23.8 10.9 25.3 19.4 10.5 Physical strain
Mostly sedentary work
58.8 74.3 69.8 33.2 54.2 43.0 56.1 49.1 54.2 36.9 12.7 17.3 15.9 16.2 16.1 41.8 A lot of walking 32.8 20.0 23.7 47.8 33.6 41.2 31.6 29.3 31.0 41.1 25.8 28.7 47.7 22.4 32.5 33.7
Climbing stairs / transport
7.1 4.5 5.3 14.9 8.8 12.0 11.1 16.3 12.5 18.7 30.9 28.6 28.0 25.6 26.6 15.6
Carrying heavy loads
1.3 1.2 1.2 4.1 3.4 3.8 1.1 5.4 2.3 3.3 30.6 25.4 8.4 35.7 24.8 8.8
Job insecurity (fear of losing job)
fear 11.5 8.6 9.4 9.4 10.7 10.0 10.8 10.8 10.8 15.5 16.1 16.0 16.1 11.4 13.3 11.4 rather no fear 41.4 48.4 46.3 41.3 48.9 44.8 47.0 52.3 48.4 43.2 44.3 44.1 42.6 46.2 44.8 45.8 no fear 47.1 43.0 44.2 49.4 40.4 45.2 42.2 36.9 40.7 41.3 39.6 39.9 41.3 42.4 42.0 42.8 Monotonous work yes 3.7 3.6 3.6 7.8 5.6 6.8 14.1 12.0 13.5 19.2 13.6 14.7 19.7 16.5 17.8 10.7 no 96.3 96.4 96.4 92.2 94.4 93.2 85.9 88.0 86.5 80.8 86.4 85.3 80.3 83.5 82.2 89.3
Handling simultaneous tasks
yes 72.8 81.3 78.8 70.9 71.7 71.3 65.4 67.9 66.1 53.5 61.2 59.8 47.8 51.9 50.3 66.5 no 27.2 18.7 21.2 29.1 28.3 28.7 34.6 32.1 33.9 46.5 38.8 40.2 52.2 48.1 49.7 33.5
Handling new tasks
yes 66.7 82.0 77.4 65.7 78.2 71.5 53.6 68.3 57.6 46.0 61.7 58.8 42.7 57.3 51.5 64.2 no 33.3 18.0 22.6 34.3 21.8 28.5 46.4 31.7 42.4 54.0 38.3 41.2 57.3 42.7 48.5 35.8 Total Per centage % 5.7 13.6 9.7 36.4 31.3 33.9 39.1 14.6 26.7 6.4 24.7 15.6 12.4 15.8 14.1 N 285 694 979 1822 1598 3420 1957 743 2700 318 1259 1577 621 804 1425 10101 Data source: SGB 2002
ment. Age was recoded into three categories: 20–34 years, 35–49 years and 50–64 years. Level of employment (< 50 %, 50–99 %, 100 %) is an indicator for time of exposure with re-spect to working conditions and was added to the analysis to control for differences between full-time and part-time em-ployees.
Statistical analyses
In a first step tables of frequencies stratified by socioeconom-ic classes were computed to analyze the gradient of different working conditions and SRH with respect to SES. In a second step multivariate logistic regression analyses were performed and adjusted odds ratios (OR) were calculated to examine the association between less than good SRH and SES. The first model examined the influence of SES on SRH only. Subse-quently, separate models including physical working condi-tions (model 2) and psychosocial working condicondi-tions (model 3) were computed. Model 4 included both psychosocial and physical working conditions. For models 5 to 8 separate anal-yses for men and women were performed, based on models 1 and 4. All models were adjusted for level of employment and age, whereas models 1 to 4 additionally were adjusted for gender.
Results
The descriptive analysis showed that both SRH and work-ing conditions were related to SES as expected (Tab. 1). The proportion of employees with (very) good SRH slightly in-creased for higher SES, whereas strong exposure to physical disturbances, physical strain, job insecurity, and monotonous work tend to decrease for higher SES. Only handling simulta-neous and new tasks increased with SES. Additionally, seden-tary work increased for higher SES, as in Class V only 16.1 % compared to 69.8 % in Class I had jobs with mostly sedentary work.
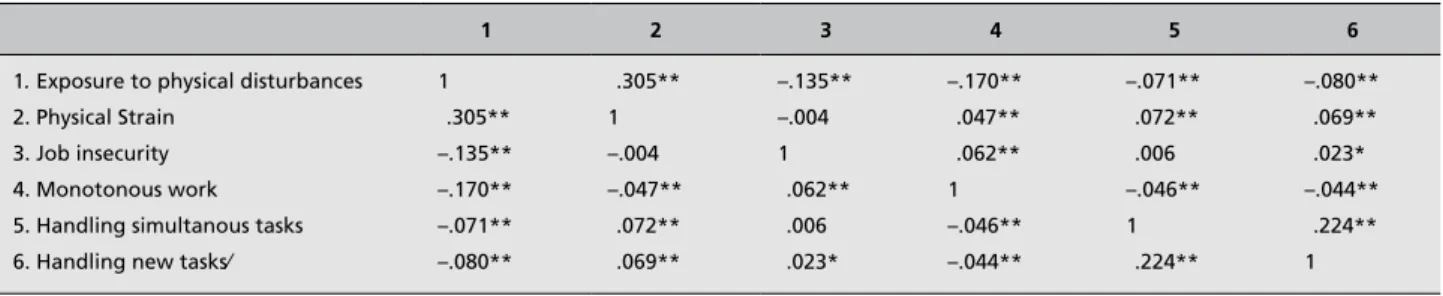
As a preliminary step for the logistic regression analyses, cor-relations between job-specific variables were computed (Tab. 2). As can be seen in Table 2 almost all of the job-specific variables are significantly correlated. However, only for two of these correlations the coefficient was greater than .2. Multivariate logistic regression analyses showed how and to what extent the social gradient in SRH is weakening by intro-ducing physical and psychosocial working conditions step by step in the analysis.
Model 1: According to the base model (Tab. 3), SRH was significantly associated with SES (adjusted for age, gender, and level of employment). Employees of Class V had a 168 %, Class IV a 135 % and Class III and II an 87 % higher risk of having less than good SRH than employees of Class I. Em-ployees of Class II did not significantly differ from Class III employees with respect to less than good SRH.
Model 2: Compared to unexposed employees, the adjusted odds ratios regarding less than good SRH were aOR = 1.77 for employees with exposure to 3–4 physical disturbances and aOR = 2.45 for employees with exposure to > 4 distur-bances (Tab. 3). Carrying heavy loads enhanced the risk for less than good SRH by 42 % compared to employees doing mostly sedentary work. Taken together, physical disturbances and physical strain explained a large part of the social gradient in SRH. Regarding SRH, only Class I employees still significantly differed from the other em-ployees.
Model 3: Handling simultaneous tasks or new tasks was not related to SRH. However, both job insecurity and monoto-nous work highly increased the risk for less than good SRH (Tab. 3). Job insecurity (fear of losing the job) almost dou-bled (aOR = 1.85) the risk for having less than good SRH compared to employees not fearing to loose their job. The inclusion of these two psychosocial working conditions did not have the same effect on the social gradient as physical working conditions had in model 2, as there are mixed results with respect to SRH for SES classes.
Table 2. Correlation matrix for job-specific variables.
1 2 3 4 5 6
1. Exposure to physical disturbances 2. Physical Strain
3. Job insecurity 4. Monotonous work 5. Handling simultanous tasks 6. Handling new tasks⁄
1 .305** –.135** –.170** –.071** –.080** .305** 1 –.004 –.047** .072** .069** –.135** –.004 1 .062** .006 .023* –.170** .047** .062** 1 –.046** –.044** –.071** .072** .006 –.046** 1 .224** –.080** .069** .023* –.044** .224** 1 *p < 0.05 level (2-tailed); ** p < 0.01 (2-tailed). Data source SGB 2002
Model 4: This model examined the combined contribution of both physical and psychosocial working conditions (Tab. 3). The adjusted odds ratios for physical and psychosocial working conditions added in model 2, respectively in model 3 mostly remained stable. The inclusion of both kinds of work-ing conditions resulted in a substantial reduction of the social gradient in SRH.
With respect to the adjusted demographic variables, model 1–4 showed significant differences (not shown in Tab. 3). In
com-parison to men, women faced a higher risk of less than good SRH (aOR = 1.31). Concerning age, 20–34 year (aOR = .50) and 35–49 year (aOR = .57) old employees had a reduced risk for having less than good SRH compared to 50–64 year old employees. Throughout all four models, employees working part-time between 50 and 99 % were at greater risk for less than good SRH compared to full-time employees (aOR = 1.36). Models 5 to 8: Differentiated models confirmed for both gen-ders the main finding of the social gradient in SRH being ex-Table 3. Adjusted Odds Ratios and confidence interval (95 %) for “less than good self-rated health (SRH)” by socio-economic status and working
conditions, adjusted for age, gender and employment (models 1 to 4).
Model 1 Model 2 Model 3 Model 4
OR 95 %–CI OR 95 %–CI OR 95 %–CI OR 95 %–CI
Socio-economic status Class I 1.00 1.00 1.00 1.00 Class II 1.87** 1.36–2.56 1.49* 1.06–2.10 1.69** 1.20–2.38 1.55* 1.09–2.19 Class III 1.87** 1.35–2.59 1.48* 1.04–2.11 1.58* 1.10–2.25 1.40 0.92–2.02 Class IV 2.35** 1.67–3.29 1.59* 1.08–2.35 2.09** 1.43–3.05 1.51* 1.01–2.26 Class V 2.68** 1.92–3.75 1.60* 1.08–2.38 1.99** 1.35–2.93 1.50 0.99–2.27
Physical working conditions
Exposure to phys. disturbances No disturbance 1.00 1.00 1–2 dist. 1.14 0.90–1.43 1.08 0.85–1.37 3–4 dist. 1.77** 1.38–2.29 1.64** 1.26–2.15 > 4 dist. 2.45** 1.81–3.31 2.21** 1.61–3.04 Physical strain Sedentary work 1.00 1.00 Walking 1.13 0.93–1.37 1.12 0.92–1.37 Climbing stairs 0.94 0.72–1.21 0.93 0.71–1.21 Heavy loads 1.42* 1.05–1.92 1.49* 1.09–2.05 Psychosocial working conditions
Job insecurity (fear of losing job) Fear 1.85** 1.46–2.36 1.69** 1.31–2.16 Rather No fear 1.25* 1.04–1.49 1.21* 1.01–1.46 No fear 1.00 1.00 Monotonous work Yes 1.53** 1.21–1.93 1.35* 1.06–1.71 No 1.00 1.00 Handling simultanous tasks Yes 1.08 0.91–1.29 1.07 0.89–1.28 No 1.00 1.00
Handling new tasks
Yes 0.97 0.81–1.15 0.92 0.77–1.11
No 1.00 1.00
*p < 0.05; **p < 0.01. Data source: SGB 2002
plained to a large extent by physical and psychosocial work-ing conditions. In men as well as in women, adjusted odds ratios for socioeconomic classes II to V (in comparison with class I) were significantly reduced when introducing physi-cal and psychosocial working conditions into the model. In women effect of class affiliation not even remained signifi-cant, whereas in men employees affiliated to classes II to IV compared to those in Class I still had a significant higher risk of having moderate or (very) poor SRH. For men and women,
the “dose-response” relationship of class affiliation and SRH (that is the social gradient in SRH) totally disappeared. Additionally, separate analyses for women and men (Tab. 4) showed remarkable gender differences concerning work-re-lated determinants of SRH. Significant effects of exposure to accumulated physical disturbances (> 4) and SRH for both gender were found, but with a larger effect for women than for men (aOR = 2.69 vs. aOR = 1.77). For men, carrying heavy loads (aOR = 1.67) and monotonous work (aOR = 1.63) Table 4. Adjusted Odds Ratios and confidence interval (95 %) for “less than good self-rated health (SRH)” by socio-economic status and working
conditions, adjusted for age, gender and employment (models 1 to 4).
Model 5 (Women) Model 6 (Men) Model 7 (Women) Model 8 (Men)
OR 95 %–CI OR 95 %–CI OR 95 %–CI OR 95 %–CI
Socio-economic status Class I 1.00 1.00 1.00 1.00 Class II 1.66* 1.01–2.71 1.96** 1.29–2.97 1.47 0.85–2.54 1.59* 1.00–2.54 Class III 1.57 0.96–2.56 2.27** 1.44–3.60 1.20 0.69–2.08 1.92* 1.14–3.22 Class IV 1.89* 1.05–3.39 2.77** 1.81–4.23 1.31 0.64–2.66 1.74* 1.03–2.93 Class V 2.42** 1.43–4.09 2.88** 1.85–4.47 1.58 0.84–2.96 1.41 0.80–2.48
Physical working conditions
Exposure to phys. disturbances No disturbance 1.00 1.00 1–2 dist. 1.17 0.86–1.59 0.90 0.61–1.33 3–4 dist. 1.64** 1.15–2.35 1.51* 1.00–2.27 > 4 dist. 2.69** 1.73–4.18 1.77** 1.11–2.83 Physical strain Sedentary work 1.00 1.00 Walking 1.20 0.93–1.55 1.02 0.74–1.41 Climbing stairs 0.95 0.67–1.36 0.90 0.58–1.36 Heavy loads 1.23 0.67–2.25 1.67* 1.11–2.53 Psychosocial working conditions
Job insecurity (fear of losing job) Fear 2.09** 1.49–2.93 1.29 0.88–1.87 Rather No fear 1.34* 1.05–1.72 1.10 0.84–1.45 No fear 1.00 1.00 Monotonous work Yes 1.13 0.81–1.57 1.63** 1.14–2.32 No 1.00 1.00 Handling simultanous tasks Yes 1.08 0.84–1.38 1.02 0.77–1.34 No 1.00 1.00
Handling new tasks
Yes 0.91 0.71–1.15 0.96 0.73–1.28
No 1.00 1.00
*p < 0.05; **p < 0.01. Data source: SGB 2002
were further associated with less than good SRH, whereas for women, job insecurity (fear of losing the job) had a significant negative effect on SRH (aOR = 2.09). Concerning the social gradient in SRH, the inclusion of all working conditions vari-ables resulted in a reduction of the social gradient in SRH, for both men and women.
Discussion
The central concern of this study was to identify the role of working conditions with regard to health inequalities, partic-ularly in the relationship of socioeconomic status (SES) and self-rated health (SRH). Addressing the first two research questions, descriptive analysis ascertained the social gradi-ent in SRH as well as for physical and psychosocial
work-ing conditions, confirmwork-ing findwork-ings by Kristensen et al. 21 As
could be seen in the correlation matrix there are associations between almost all of the job-specific variables. However, the common variance for these variables only varies between 0 to 10 %. The subsequent logistic regressions analyses ad-justed for age, gender, and employment could show that SES was clearly associated with SRH: lower socioeconomic sta-tus was mostly associated with a higher risk for less than good SRH.
With respect to the association between working conditions and SRH, the study showed that both physical and psycho-social work demands independently predicted reduced SRH. Regarding the two psychosocial working conditions, handling simultaneous or handling new tasks, no association could be found with SRH. Probably, these factors do not only imply high job demands but also high job resources such as task variety. Furthermore, handling simultaneous and new tasks requires a certain level of job control. Job-related resources such as job control or contractual reciprocity have shown to
be important health protectors.17
Regarding the third research question, it could be shown that physical and psychosocial working conditions explained to a large extent the social gradient in self-rated health in the present study sample. These findings are consistent with
Schrijvers et al.,22 who demonstrated that a substantial part
of the association between occupational class and SRH could be explained by physical working conditions and job control.
Additionally, Borell et al.15 could show that work organization
variables such as physical and psychosocial hazards and job insecurity contributed to the explanation of socioeconomic
inequalities. Furthermore, Borg and Kristensen20 could show,
that almost two thirds of the social gradient with regard to worsening of SRH could be explained by the work
environ-ment and life style factors. The little explanatory power of psychosocial demands in the present study probably can be explained by the lack of measures on job control as a strong predictor of health at work.
Regarding the fourth research question, no differences be-tween men and women could be found in terms of explaining or reducing the social gradient in SRH while physical and psychosocial working conditions were included in the logis-tic regression models. Unless it turned out that in men un-like in women the effect of affiliation to a lower class (II–IV) still remained significant as a risk factor for SRH. However, except for physical disturbances, different sub-dimensions of the mentioned working conditions were associated with re-duced SRH for both gender. This emphasizes the importance of performing separate, gender-specific analyses in future work-related studies, as suggested by aforementioned stud-ies.14,15,22
However the study had some methodological limitations. Self-rated health (SRH) as dependent variable is a rather un-specific indicator of health. On the other hand, other studies could show that SRH is a good predictor for future morbidity
and mortality.23,24 Furthermore, the use of cross-sectional data
in this study limits causal conclusions, which can be over-come by future longitudinal studies. Finally, the measures for working conditions in the Swiss Health Survey are limited in
scope and methodology.27 Nevertheless, they still
substantial-ly explain the SES gradient of SRH and the study could show a social gradient for both SRH and working conditions, which
is consistent with other international studies.15,20,22
In conclusion, the study operated with representative data, making the results generalizable to the entire Swiss work-ing population and thus offerwork-ing an important contribution to work related health research in Switzerland. Overall, the study confirmed the relevance of modifiable physical and psy-chosocial working conditions for explaining the social gradi-ent of self-rated health (SRH). Improving working conditions in low SES groups has a high potential for reducing the social gradient of health and for producing a large health gain in the overall working population. Improving psychosocial work-ing conditions has shown to enhance business performance as
well,29 making e.g. comprehensive worksite health promotion
simultaneously a health and productivity initiative. Future studies should especially address the gender issue regarding physical and psychosocial working conditions in the relation-ship of socioeconomic status and self-rated health.
Acknowledgements
We thank the Swiss Federal Statistical Office for providing data from the Swiss Health Survey.
References
1. Mackenbach JP, Kunst AE, Cavelaars AEJM,
Groenhof F, Geurts JJM; EU Working Group. Socioeconomic inequalities in morbidity and mortality in Western Europe. Lancet 1997;349: 659–74.
2. Marmot M, Ryff CD, Bumpass LL, Shipley M,
Marks NF. Social inequalities in health: next questions and converging evidence. Soc Sci Med 1997;44:901–10.
3. Siegrist J, Marmot M, eds. Social inequalities
in health. New evidence and policy implications. Oxford: University Press, 2006.
4. Bopp M, Minder CE. Mortality by education
in German speaking Switzerland, 1990–1997: results from the Swiss National Cohort. Int J Epidemiol 2003;32:346–54.
5. Bucher H, Gutzwiller F.
Gesundheitsverhal-ten und soziale Ungleichheit in der Schweizer Bevölkerung. Ergebnisse aus der SOMIPOPS-Studie. [Health behavior and social inequa-lities in the Swiss population. Results of the SOMIPOPS study]. Schweiz med Wochenschr 1987;117:1583–90.
6. Lehmann P, Mamboury C, Minder CE. Health
and social inequalities in Switzerland. Soc Sci Med 1990;31:369–86.
7. Witschi A, Junker C, Minder CE. Soziale
Ungleichheit und Gesundheit in der Schweiz. Ergebnisse der Schweizerischen Gesundheits-befragung 1992/93.[Social inequality and health in Switzerland. Results of the Swiss Health Survey 1992/93]. Bern: Institut für Sozial- und Präventivmedizin, 2000.
8. Guberan E, Usel M. Permanent work
inca-pacity, mortality and survival without work incapacity among occupations and social classes: a cohort study of ageing men in Geneva. Int J Epidemiol 1998;27:1026–32.
9. Foppa I, Noack RH. The relation of
self-re-ported back pain to psychosocial, behavioral, and health-related factors in a working population in Switzerland. Soc Sci Med 1996;43:1119–26.
10. Stronks K, Van DeMheen H, Van Den Bos
J, Mackenbach, JP. Smaller socioeconomic inequalities in health among women: the role of employment status. Int J of Epi 1995;24:559–68.
11. Matthews S, Manor O, Power C. Social
in-equalities in health: are there gender differences? Soc Sci Med 1999;48:49–60.
12. Arber S, Cooper H. Gender differences in
health in later life: the new paradox? Soc Sci Med 1999;48:61–76.
13. Dahl E. Social inequality in health – the role
of the healthy worker effect. Soc Sci Med 1993; 36:1077–86.
14. Sekine M, Chandola, T, Martikainen P,
Marmot M, Kagamimori S. Socioeconomic inequalities in physical and mental functioning of Japanese civil servants: explanations from work and family characteristics. Soc Sci Med 2006;63:430–45.
15. Borell C, Muntaner C, Benach J, Artazcoz L.
Social class and self-reported health status among men and women: what is the role of work organisation, household material standards and household labour? Soc Sci Med 2004;58:1869–87.
16. Matthews S, Hertzman C, Ostry A, Power
C. Gender, work roles and psychosocial work characteristics as determinants of health. Soc Sci Med 1998;11;1417–24.
17. Siegrist J, Theorell T. Socio-economic
posi-tion and health. The role of work and employ-ment. In: Siegrist J, Marmot M, eds. Social inequalities in health. New evidence and policy implications. Oxford: University Press, 2006.
18. Marmot M, Theorell T. Social class and
cardiovascular disease: the contribution of work. Int J Health Serv 1998;18:659–74.
19. Marmot M, Theorell T, Siegrist J. Work and
coronary heart disease. In: Stansfeld SA, Marmot M, eds. Stress and the heart. Psycho-social pathways to coronary heart disease. London: BMJ Books, 2002:50–71.
20. Borg V, Kristensen TS. Social class and
self-rated health: can the gradient be explained by differences in life style or work environment? Soc Sci Med 2000;51:1019–30.
21. Kristensen TS, Borg V, Hannerz H.
Socio-economic status and psychosocial work environ-ment: results from a Danish national study. Scand J Public Health 2002;30:41–48.
22. Schrijvers CTM, van de Mheen HD, Stronks
K, Mackenbach JP. Socioeconomic inequalities in health in the working population: the contri-bution of working conditions. Int J Epidemiol 1998;27:1011–8.
23. Idler E, Benyamini Y. Self-rated health and
mortality: a review of twenty-seven community studies. J Health Soc Behav 1997;38:21–37.
24. Moller L, Kristensen TS, Hollnagel H. Self
rated health as a predictor of coronary heart disease in Copenhagen, Denmark. J Epidemiol Commun Health 1996;50, 423–28.
25. Bildt C, Michélsen H. Gender differences in
the effects from working conditions on mental health: a 4-year follow-up. Int Arch Occup Environ Health 2002;75:252–258.
26. Domenighetti G, D’Avanzo B, Bisig B.
Health effects of job insecurity among employees in the Swiss general population. Int J Health Serv 2000;30:477–90.
27. Hämmig O, Jenny G, Bauer G. Arbeit und
Gesundheit in der Schweiz. Surveybasier-tes Monitoring der Arbeitsbedingungen und des Gesundheitszustandes der Schweizer Erwerbsbevölkerung.[Work and Health in Switzerland. Survey-based monitoring of work conditions and health status of the Swiss working population]. Neuchâtel: Obsan, 2005.
28. Erikson R, Goldthorpe JH, Portocarero L.
Intergenerational class mobility in three Western European societies: England, France and Sweden. Brit J Sociol 1979;30:415–41.
29. Bond FW, Flaxman PE, Loivette S. A business
case for the management standards for stress. Sudbury: HSE Books, 2006.
Address for correspondence
Georg F. Bauer
Institute of Social and Preventive Medicine University of Zurich and Center for Organizational and Occupational Sciences, ETH Zurich, Hirschengraben 84 CH-8006 Zurich
Switzerland