HAL Id: hal-03023127
https://hal.uca.fr/hal-03023127
Submitted on 25 Nov 2020
HAL is a multi-disciplinary open access archive for the deposit and dissemination of sci-entific research documents, whether they are pub-lished or not. The documents may come from teaching and research institutions in France or abroad, or from public or private research centers.
L’archive ouverte pluridisciplinaire HAL, est destinée au dépôt et à la diffusion de documents scientifiques de niveau recherche, publiés ou non, émanant des établissements d’enseignement et de recherche français ou étrangers, des laboratoires publics ou privés.
Distributed under a Creative Commons Attribution| 4.0 International License
Use of fluorescent probes in supporting functional group
analysis resulting from polymer ageing
Baptiste Hervé, Géraldine Rapp, Pierre-Olivier Bussiere, Jean-Luc Gardette,
Sandrine Therias
To cite this version:
Baptiste Hervé, Géraldine Rapp, Pierre-Olivier Bussiere, Jean-Luc Gardette, Sandrine Therias. Use of fluorescent probes in supporting functional group analysis resulting from polymer ageing. Polymer Degradation and Stability, Elsevier, 2020, 177, �10.1016/j.polymdegradstab.2020.109167 Get�. �hal-03023127�
1
Use of fluorescent probes in supporting functional group analysis resulting from polymer ageing
Baptiste Hervé, Géraldine Rapp, Pierre-Olivier Bussiere, Jean-Luc Gardette, Sandrine Therias*
Université Clermont Auvergne-CNRS-SIGMA Clermont, ICCF, F-63000 Clermont–Ferrand, France
Abstract
Based on the determination of the solvatochromic parameters of a series of polymers with various functional groups containing oxygen atoms, a method was proposed which allowed for discriminating the oxidation products formed by exposure of polymers to photo- and/or thermo-ageing. The polymers used to determine the solvatochromic parameters contained polar groups such as chain-pendant ester (EVA, PMMA, PVAc), chain ester (PLA), alcohol (EVOH, PVA), chain-pendant acid (PAA), ketone (PK), ether (PEO). The solvatochromic parameters π*, α and β were determined following procedures reported in the literature, and it was shown that the most apolar polymer PE, displays the lowest π* value; the presence of acetate groups in PE makes the π* value increase. Polyesters (PLA, PMMA, PVAc) have similar π* values. Then, alcohols and ether groups (EVOH, PVA, PEO) have higher π* values. Finally, the highest π* values are obtained for PAA and PK. Concerning the β value, the highest value was obtained for (PE, EVOH, PEO), which have the highest capacity to accept a proton, and are close to polyethylene in terms of chemical structure. On the contrary, the polymers with the lowest β value are the ones which have acid/ester/ketone functions (PK, PAA, PLA), reflecting their lowest capacity to accept a proton. This method was successfully applied to discriminate the oxidation products formed in thermo- and photo-oxidation of polyethylene which are known to be slightly different due to the Norrish reactions that do not occur in thermooxidation.
Keywords: polymers, polyethylene, fluorescence, solvatochromic parameters, oxidation * Corresponding Author: Sandrine Therias
I.C.C.F. UMR 6296 - Institut de Chimie de Clermont-Ferrand Université Clermont Auvergne - CNRS - SIGMA Clermont
Campus des Cézeaux - 24, avenue Blaise Pascal - TSA 60026 - CS 60026 63178 Aubière Cedex
2 E-mail: sandrine.therias@uca.fr
1. Introduction
Fluorescence spectroscopy as an analytical technique widely used in a variety of applications can also be useful for polymer characterization as described in a paper on fluorescent probes for sensing processes in polymers[1]. Fluorescence analysis for characterizing polymer degradation was mainly reported concerning the fluorescence emission that appears upon polymer ageing due to the degradation products. There are very few papers dealing with fluorescent molecular probes in polymers and the use of their fluorescence to study the degradation. A first paper of Peinado et al. [2] reported that fluorescence emission, from two extrinsic probes that were added to a polymer, can be used as a valuable method to analyse photooxidation from the initial stages. Very recently, a study, based on the use of profluorescent nitroxide sensors as sensitive probes to detect early stage photodegradation [3], showed that the probes are able to highlight polymer degradation within the oxidation “induction” period.
It has been shown in our previous work [4] that the emission properties of a fluorescent molecular probe such as Prodan® depend on the solvent polarity [5, 6, 7] and are then modified with the oxidation extent of a polymer during ageing. This has been ascribed to the change of polarity in the polymer matrix that comes from the oxidation products which are formed during ageing. An interesting and complementary issue is then to evaluate if the features of this molecular fluorescent probe could be sensitive enough to the chemical nature of the products that are formed and could allow discriminating these products.
This study is devoted to the determination of the solvatochromic parameters of various polymers with the objective of using them as a tool for discriminating the various oxidation products in polymers. It has been completed by investigations on the distribution of Prodan® in photo- and thermo-oxidized polyethylene. The main objective of the present work is then to study the sensitivity of Prodan®to the chemical functions of oxidation products which are formed during photo and thermo-oxidation of polyethylene, in order to detect any change of polarity due to the accumulation of oxidation products and in order to discriminate the oxidation products depending on their chemical groups. The differences between the stoichiometry of the degradation products formed in photo and thermo-oxidation of polyethylene [8, 9, 10, 11] have been revealed by the fluorescence emission of Prodan® and
3
evaluated through the determination of the solvatochromic parameters of polyethylene after photooxidation and themooxidation.
In the first part of this article, we compared the emission spectra of Prodan® in either photooxidized polyethylene or thermooxidized polyethylene, which had been oxidized in order to reach the same level of oxidation, determined by infrared measurements. Since reference data were needed for establishing correlations between the features of Prodan®and the various chemical functions, several polymers have been chosen according to the chemical function in their repetitive unit and the features of the selected probes suitable as polarity indicators. This is reported in the second part of this article. These polymers have been selected because their chemical functions are representative of the oxidation products formed during photo and thermal ageing of polymers. The Kamlet-Taft solvatochromism method [12, 13, 14 , 15] has been applied in order to calculate the solvatochromic parameters of this panel of polymers. Polymers with a wide variety of chemical functions involving polar oxygen groups have been chosen: chain-pendant ester (EVA, PMMA, PVAc), chain ester (PLA), alcohol (EVOH, PVA), chain-pendant acid (PAA), ketone (PK), ether (PEO). Then we determined the solvatochromic parameters in photooxidized or thermooxidized polyethylene and we discussed the obtained results on the basis of the parameters determined for the panel of polymers with the various chemical functions.
2. Experimental section
2.1. Materials
Polymethyl methacrylate (PMMA); polyethylene oxide (PEO); ethylene vinyl alcohol 44 and 27% molar of ethylene (respectively EVOH44 and EVOH27); ethylene vinyl acetate 9 and 33% molar of acetate (respectively EVA9 and EVA33), polyacrylic acid (PAA) and polyvinyl acetate (PVAc) were purchased from Scientific Polymer Products. Linear low-density polyethylene (PE) was supplied by SABIC® and crosslinked with dicumyl peroxide (DCP, Arkema Luperox®, 2 wt.%) as described in a previous work [4]. Polylactic acid (PLA 4032D) was supplied by NatureWorks. Polyketone (PK) was purchased from GoodFellow. Polyvinyl alcohol (PVA) was purchased from TCI.
Solvents were purchased from either Sigma Aldrich, Acros Organics or VWR Chemicals. 2-dimethylamino-6-propionylnaphtalene (Prodan® >98%) was purchased from TCI, 4-nitroanisole (ANS, 97%) and 4-nitroaniline (ANL, >99%) were purchased from Sigma
4
Aldrich. All the probes were used as received. The chemical structures of ANS, ANL and Prodan® are given in Scheme 1.
ANS ANL Prodan®
Scheme 1: Chemical structure of 4-nitroanisole (ANS), 4-nitroaniline (ANL) and Prodan®.
2.2. Samples preparation
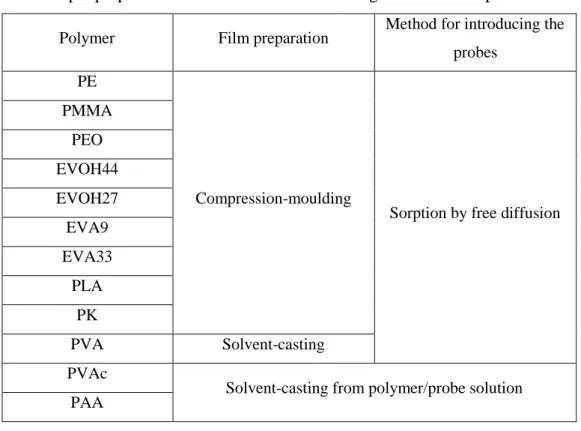
Different methods were used for preparing the samples and introducing the molecular probes into the polymer matrix (Table 1).
Samples preparation: films of PE, PMMA, PEO, EVOH, EVA, PLA and PK (with a thickness of 80-100 μm) were obtained by compression-moulding of pellets using a hydraulic press. In the case of PVA, films were obtained by solvent-casting from an aqueous solution (5 wt % of PVA was dissolved in water and stirred for few hours at 50°C). Then, the solution was spread onto Teflon sheets, free-standing films with thicknesses between 30 and 60 μm were obtained after drying at room temperature for few hours.
5
Table 1 – Polymers used in this study:
sample preparation and method for introducing the molecular probes.
Polymer Film preparation Method for introducing the probes
PE
Compression-moulding
Sorption by free diffusion PMMA PEO EVOH44 EVOH27 EVA9 EVA33 PLA PK PVA Solvent-casting PVAc
Solvent-casting from polymer/probe solution PAA
Sorption method used for introducing the molecular probes: methanol solutions at different concentrations of Prodan® (5.10-3, 1.10-2 M), ANS (1.10-1 M, 1.10-2 M, 5.10-3, 5.10-4 M) and ANL (1.10-2 M) were used. Polymer films were immersed in the methanolic solution of fluorescent probes for different soaking times, then removed and quickly washed by pure methanol and finally dried at 60°C for 1h [4].
The sorption method could not be used for PVAc (soluble in methanol) and PAA (polymer is in liquid form). Thus, a solvent-casting method from a polymer/probe solution was used in order to introduce the molecular probes into the polymer matrix. PVAc was dissolved in a 5.10-4 M solution of fluorescent probe (Prodan®, ANS or ANL) to achieve a 5 wt.% solution of PVAc in methanol, and the mixture was deposited onto Teflon® sheets resulting in free-standing films (between 60 and 100 µm) after drying at 60°C for few hours. PAA was dissolved in a 1.10-2 M solution of the fluorescent probes Prodan®or ANS, and or in a 1.10-3 M solution of ANL to obtain a 10 wt.% solution of PAA, and the mixture was deposited onto CaF2 then dried at 60°C for 30 min.
6
2.3. Photochemical and thermal ageing
Photooxidation of the samples was carried out in a SEPAP 12-24 from Atlas [16]. This device is equipped with four medium pressure mercury lamps located around the rotating carrousel which holds the samples. A borosilicate envelope filters the UV-light with wavelengths below 300 nm. The temperature at the surface of the samples was fixed at 60°C. This device is specifically designed to study the photodegradation of polymers in artificial conditions corresponding to accelerated ageing. Thermal oxidation of the samples was carried out in an air-circulation oven at 110°C.
For each ageing experiment, three samples were prepared and characterized in order to ensure reproducibility of the spectrometry measurements.
2.4. Characterization methods 2.4.1. UV-visible spectroscopy
UV-visible spectra of the polymer films were recorded on a Shimadzu UV-2600 scanning spectrophotometer equipped with an integrating sphere working with UVProbe software, between 200 and 800 nm.
2.4.2. IR spectroscopy
Infrared spectra of polymer films were recorded in transmission mode with a Nicolet 6700 FTIR spectrometer, working with OMNIC software. Spectra were obtained using 32 scans and a 4 cm-1 resolution.
2.4.3. Fluorescence spectroscopy
Fluorescence spectra were recorded between 300 and 800 nm on a Varian Cary Eclipse spectrophotometer. The excitation wavelength of Prodan® was chosen as 340 nm (excitation and emission slit: 2.5, except for PEO: 2.5/1.5). The emission spectra of the polymer films were recorded using a sample holder making a 45-degree angle with the excitation beam.
2.4.4. Fluorescence microscopy
Fluorescence microscopy was performed on a Leica DM6000 B microscope equipped with an Optigrid® system to perform structured illumination microscopy, a HC PL APO 20/0.7 dry lens and a Hamamatsu digital CMOS camera, ORCA-Flash 4.0V2 C11440-22CU, which
7
allows capturing 16-bit data depth images of 4.0 Megapixels (6.5 μm x 6.5 μm chip size). Using this optical system, the lateral resolution (dxy) is 0.325 nm. Pictures were acquired with “DAPI filter" (BP 405|60, DC455, BP 470|40).
3. Results and discussion
3.1. Morphology of polyethylene films impregnated with Prodan®
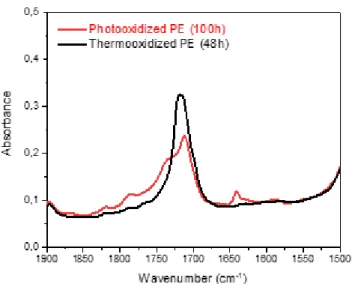
Prodan® was introduced into PE films before and after ageing for 48 hours in the case of thermooxidation at 110°C and 100 hours in the case of irradiations in the SEPAP unit. These times were chosen because they correspond to the same extent of oxidation. We have used two methods to determine the extent of oxidation: on the one side, we measured the areas of the carbonyl oxidation products detected by infrared measurements of both PE and chose the times giving the same areas (see Figure 1). On the other side, we have deconvoluted the complex carbonyl band following a procedure previously reported [17], and then determined the concentrations of the various carbonyls composing this band. The total concentration of the carbonyls was then used to calculate the corresponding concentration of oxygen consumed within the oxidation in thermal and photochemical processes. The obtained results were similar using both these methods.
Fig. 1. Infrared spectra of PE films either photooxidized during 100h or thermooxidized during 48h – zoom in the absorption range of carbonyl (1900-1500 cm-1).
8
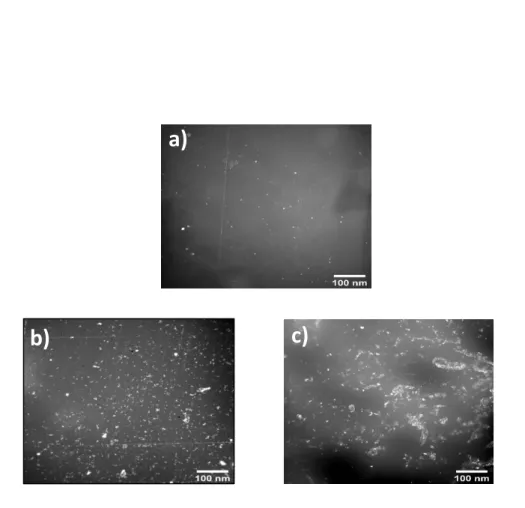
The surface distribution of Prodan® in PE films was then recorded using fluorescence microscopy. Figure 2 shows the fluorescence images of Prodan® impregnated into unaged and aged PE.
Fig. 2. Fluorescence microscopy images of Prodan® impregnated into a) unaged PE film b) 48h thermooxidized PE film and c) 100h photooxidized PE film.
For unaged PE (Figure 2a), one can see a weak fluorescence emission of Prodan® in the non -oxidized sample. This may result from the weak affinity of Prodan® with PE before oxidative ageing.
For thermooxidized PE (Figure 2b) and photooxidized PE (Figure 2c), one can observe a marked increase of the fluorescence intensity of Prodan®. This reflects an increase of the emission intensity of Prodan® after ageing, which was attributed to an increasing amount of Prodan® absorbed in the films with ageing time [4]. This confirms the higher affinity of the polymer to this fluorophore after ageing. Moreover, we can note that the fluorescence
a)
c)
b)
9
emission intensity is slightly lower in the case of photooxidation than in the case of thermooxidation.
3.2. Modifications of the emission spectrum of Prodan® with polyethylene oxidation
As shown in our previous work [4], the emission properties of Prodan® are dramatically influenced by the oxidation extent of polyethylene, because of the changes of polarity of the polymer during ageing and also hydrogen-bond interactions: a shift of the wavelength at the maximum of emission is observed as well as an increase of the emission intensity.
Figure 3 compares the emission spectra of Prodan® in PE film before ageing, after 100 h of photooxidation and after 48 h of thermooxidation.
Fig. 3. Emission spectra of Prodan® in PE films (sorption time 1 h in a Prodan® solution at 5.10-3 M) before ageing, after photooxidation (100 h) and after thermooxidation (48h).
Figure 3 shows that for a same oxidation extent of PE (thermooxidation 48h and photooxidation 100h), the shift of the emission maximum of Prodan® is different in photo- and thermo-oxidation. Thermooxidation of PE for 48 h provokes a shift of the emission wavelength maximum of Prodan® from 406 to 420 nm, whereas photooxidation for 100 h provokes a smaller shift of the emission maximum from 406 to 412 nm. Moreover, an increase of the emission intensity is observed in both cases, but in a different extent, which is consistent with the images shown in Figure 2.
We have also recorded the emission spectra of Prodan® for various photooxidation times. One can observe the same interesting features as already observed for thermooxidation: the
350 400 450 500 550 600 0 50 100 150 200 250 300 350 400 450 500 PE before ageing Thermooxidized PE (48 h) Photooxidized PE (100 h) I ( a.u .) Wavelength (nm) 420 412 406
10
wavelengths at the emission maximum increases with the oxidation time, shifting from 406 to 421 nm after 300 h under light irradiation and from 406 nm to 431 nm in thermooxidation (Table 2) (the data corresponding to thermooxidation have been extracted from reference [4]). This can be explained by the formation of the oxidation products which increase the polarity of the polymer matrix during photooxidation of polyethylene [17].
Table 2 – Dependence of the wavelength at the Prodan® maximum of emission for photo- and thermooxidation times.
Ageing time (h)
λmax (nm)
Thermooxidation Carbonyl area
Ageing time (h)
λmax (nm)
Photooxidation Carbonyl area
0 406 ± 1 0.50 0 406 ± 1 0.50 12 409 ± 1 0.70 50 411 ± 2 3.70 24 413 ± 1 1.70 100 412 ± 1 9.90 48 420 ± 2 11.2 200 418 ± 1 21.6 72 424 ± 2 26.5 300 421 ± 1 52.2 96 430 ± 2 69.3
Figure 4 shows the maximum emission wavelength of Prodan® vs. the area of the carbonyl oxidation products measured on the IR spectra of thermo- and photooxidized samples. The data for thermooxidation have been extracted from reference [4].
11
Fig. 4. Wavelength at the Prodan®maximum of emission (λmax) vs. carbonyl IR area.
As one can see in Figure 4, the shift of the maximum emission wavelength of Prodan® is not the same for a given area of carbonyl oxidation products. This result has to be linked with the different oxidation mechanisms in thermo- and photooxidation, with products being formed at different relative concentrations (Scheme 1).
One can observe on Figure 1 that the shape of the carbonyl band differs strongly, which reflects the differences of the products formed by thermo- and photooxidation of polyethylene. In both cases, the modification of the spectrum indicates that carboxylic acids (1713 cm−1), ketones (1720 cm−1), esters (1735 cm−1) and lactones (1780 cm−1) are formed. One can also notice the formation of double bonds (1640 cm−1) in the case of photooxidation only. The oxidation products are almost the same, but their relative concentrations are different, which reflects that the Norrish reactions occur in photooxidation and not in thermooxidation. Ketones accumulate during thermooxidation, whereas they react during photodegradation through the Norrish reactions, leading to the formation of unsaturations (vinyl and vinylene absorption bands) and carboxylic acids [17]. Comprehensive mechanisms of PE photooxidation and thermooxidation (Scheme 2) have already been proposed [17].
0 10 20 30 40 50 60 70 80 400 405 410 415 420 425 430 435 Photooxidation Thermooxidation lmax (n m)
12
Scheme 2 - Comprehensive mechanism of photooxidation and thermooxidation of polyethylene [17].
Our results clearly indicate that the emission of Prodan® is sensitive to the different carbonylated oxidation products, that is to say the ratio of ketone and carboxylic acids that are different between thermooxidation and photooxidation of PE. In order to complete these experiments, we compared the emission spectra of Prodan® in a 48 h thermooxidized PE with a sample thermooxidized for 48 h but which was then subjected to photolysis (irradiation in
T h e rm o -oxi d at ion P h ot o -oxi d at ion
13
the absence of oxygen) for 50 h, in order to make the ketones react through Norrish reactions (ketones transforming into unsaturations, acid and ester functions, see Scheme 1).
Figure 5a shows the IR spectra of both samples and Figure 5b displays the emission spectra of Prodan® in the two PE samples in order to observe the impact of photolysis on the emission fluorescence spectra.
Fig. 5. a) Infrared spectra and b) emission spectra of Prodan® in a 48h thermooxidized PE film before and after 50h photolysis –
zoom in the absorption range of carbonyl (1900-1500 cm-1).
One can observe that the IR absorption band corresponding to ketones (1720 cm-1) decreased after photolysis and the IR absorption band corresponding to esters (1735 cm-1), lactones (1780 cm-1) and vinyls (1640 cm-1) increased after photolysis, which means that the Norrish reactions took place in the thermooxidized PE sample under photolysis. Interestingly (Figure 5b), the emission wavelength maximum of Prodan® shifts towards lower wavelength after photolysis (from 420 nm to 414 nm).
3.3. Modifications of the emission spectrum of Prodan® in various polymers
In order to study the sensitivity of Prodan® to the oxidation products which are formed during the photo and thermal ageing of the polymer, we first need to obtain reference values for pure polymers which have chemical functions representative of the oxidation products. This will
14
allow obtaining a database of reference parameters, which will be used for comparing with polymer oxidation products.
Considering that the variations of the emission wavelength maximum of Prodan® after photo- or thermo-oxidation could result from various carbonylated and hydroxylated functions formed in different relative concentrations, we have monitored the emission spectra of Prodan® in different polymers with chemical structure chemical functions are representative of the oxidation products which are formed during polymer ageing. This is shown in Figure 6, which shows the emission spectra of Prodan® in the different polymer films and results are gathered in Table 3.
Fig. 6. Emission spectra of Prodan®in different polymers. a) PE, EVA9, EVA33, PLA, PMMA and PVAc. b) EVOH44, EVOH27, PEO, PVA, PAA and PK.
The data given in Figure 6 and Table 3 confirm that the wavelength at the maximum of emission λmax em of Prodan® is sensitive to the chemical function of polymers, as already
reported for some polymers [18,19]. It has also to be pointed out that, as already shown in our previous work [4], there is an increase of the emission intensity with a concomitant shift of the wavelength at the emission maximum when the polarity of the polymer increases.
350 400 450 500 550 600 0 100 200 300 400 500 600 700 800 900 1000 I ( a.u .) Wavelength (nm) EVA9 EVA33 PLA PMMA PVAc PE 408 417 427 429 430 406 a) 350 400 450 500 550 600 0 100 200 300 400 500 600 700 800 900 1000 I ( a.u .) Wavelength (nm) EVOH44 EVOH27 PEO PVA PAA PK 452 454 449 454 444 441 b)
15
Table 3 – Experimental data obtained for emission maximum wavelength of Prodan® in different polymers.
Polymer Chemical structure λmax em (nm)
νmax em (103 cm-1) PE 406 ± 1 24.63 ± 0.10 EVA9 408 ± 1 24.51 ± 0.10 EVA33 417 ± 1 23.98 ± 0.10 PVAc 430 ± 1 23.26 ± 0.10 PMMA 429 ± 1 23.31 ± 0.10 PLA 427 ± 1 23.42 ± 0.10 EVOH44 452 ± 1 22.12 ± 0.10 EVOH27 454 ± 1 22.03 ± 0.10 PVA 444 ± 1 22.52 ± 0.10 PEO 454 ± 1 22.03 ± 0.10 PAA 449 ± 1 22.27 ± 0.10 PK 441 ± 1 22.68 ± 0.10
16
These results indicate that the emission wavelengths of Prodan® are ranging from 406 to 454 nm depending on the chemical structure of the host polymer. This reflects the influence of the chemical functions of the polymer on the spectroscopic parameters of Prodan®.
The studied polymers can be separated in three groups, i.e aliphatic chain (PE, EVA9, EVA33) with the lowest λmax emission, then ester functions (PMMA, PVAc, PLA), carbonyl
and carboxyl functions (PK and PAA), and finally ether and hydroxyl functions (PEO, PVA and EVOH).
3.4. Determination of solvatochromic parameters in polymers
Over the past decade, Kamlet, Abraham, Taft (KAT) and co-workers have developed a linear solvation energy relationships (LSERs) for studying solute-solvent interactions for liquid solvent [12, 20]. Indeed, multiple solvent effects are unravelled and rationalized in terms of linear combinations of dependences on three indices of solvent properties: the solvatochromic parameters. These solvatochromic parameters are the dipolarity/polarizability of the solvent, the hydrogen bond acceptor basicity and the hydrogen bond donor acidity. Based on judicious choice of solvents and indicators, a linear solvation energy relationship has been proposed through Kamlet-Taft solvatochromic equation (1):
SP = SPo + sπ1* + bβ1 + aα1 (1)
where SP is a solvent-dependent property, SPo, s, b and a are constants, and π*, α and β are
solvatochromic parameters of the solvent [12,20].
Kamlet et al.[12] has shown that SP could be positions or intensities of maximal absorption in UV/visible absorption or fluorescence emission spectra ν (equation (2)):
ν = νo + sπ* + bβ + aα
(2)
This equation (2) is obtained experimentally and the solvatochromic parameters are derived empirically by using UV-visible absorption spectroscopy in liquid solvents. The maximum absorption wavelength of the solute is measured and used for the calculation of solvatochromic parameters (see equations below). The π* scale in an index of solvent dipolarity/polarizability, which measures the ability of the solvent to stabilize a charge or a dipole by virtue of its dielectric effect. The α scale of solvent describes the ability of the solvent to donate a proton in a solvent-to-solute hydrogen bond. The β scale provides a measure of the solvent’s ability to accept a proton in a solvent-to-solute hydrogen bond.
17
This empirical solvatochromic equation (2) is capable of correlating, predicting and elucidating physicochemical properties [21]. This method was applied by some authors to the determination of solvatochromic parameters of solid polymers [21,22,23,24], although few polar polymers were studied.
Thus, we decided to apply the Kamlet-Taft solvatochromism method to polymers with different chemical functions in order to obtain the π* values for these polymers, and then classify these polymers according to their chemical function.
3.4.1. Determination of π* of polymers
According to the literature, dipolarity/polarizability π* can be calculated using the wavelength at the maximum of the longest UV-visible absorption band of 4-nitroanisole (ANS) denoted λANS in the polymer, considering equation (3) [23]:
(3) where υANS (=1/λANS)is the maximum wavenumber of ANS. This equation was obtained from
experimental data concerning a series of liquid solvents, and this method has been applied to various polymers [21,22] which allowed the authors to determine π* values.
Figure 7 shows the UV-visible absorption spectra of ANS in the various polymers selected for our study, depending on their chemical structure and therefore their polarity. Figure 7a compares the spectra for polyethylene (PE) and polymers with ester functions (EVA, PLA, PMMA and PVAc), and Figure 7b compares the spectra of polymers with hydroxylated (EVOH and PVA), ketone (PK), ether (PEO) and carboxylic acid (PAA) functions.
Fig. 7. UV-absorption spectra of ANSin different polymers. a) PE, EVA9, EVA33, PLA, PMMA and PVAc. b) EVOH44, EVOH27, PEO, PVA, PAA and PK.
200 250 300 350 400 450 500 550 600 0,0 0,5 1,0 1,5 2,0 2,5 3,0 Absor ba nce Wavelength (nm) EVOH44 EVOH27 PEO PAA PVA PK 309 311 310 317 320 b) 323 200 250 300 350 400 450 500 550 600 0,0 0,5 1,0 1,5 2,0 2,5 3,0 Absor ba nce Wavelength (nm) EVA9 EVA33 PLA PMMA PVAc PE 308 306 298 300 305 310 a)
18
One can see in Figure 7 that the wavelength at the absorption maximum of ANSdepends on the chemical functions of the polymer. Table 3 summarizes the data obtained for the various spectra given in Figure 7, and compares then with the literature data, when available.
Table 4 – Experimental data obtained for UV-absorption maximum wavelength of ANS in different polymers and the corresponding π* values calculated from equation (3).
It is interesting to note that the π* values obtained in our experiments are close to those reported in the literature: 0.86 for PEO [22], 0.71/0.76 for PMMA [21,22], 0.77 for PVAc [21,22], 1.11 for PVA [21]. This confirms that the current experimental procedure and the calculation method are appropriate for the determination of polarizability π* in polymers.
Polymer λmax (nm) νmax abs (10 3 cm -1 ) Experimental π* π* from literature PE 298 ± 1 33.56 ± 0.10 0.26 - EVA9 300 ± 1 33.33 ± 0.10 0.36 - EVA33 305 ± 1 32.79 ± 0.10 0.55 - PVAc 310 ± 1 32.26 ± 0.10 0.77 0.77 [21,22] PMMA 308 ± 1 32.47 ± 0.10 0.71 0.71/0.76 [21,22] PLA 306 ± 1 32.68 ± 0.10 0.61 - EVOH44 309 ± 1 32.36 ± 0.10 0.74 - EVOH27 310 ± 1 32.26 ± 0.10 0.77 - PVA 317 ± 1 31.55 ± 0.10 1.10 1.11 [21] PEO 311 ± 1 32.15 ± 0.10 0.84 0.86 [22] PAA 320 ± 1 31.25 ± 0.10 1.22 - PK 323 ± 1 30.96 ± 0.10 1.35 -
19
One can see that the π* value is sensitive to the chemical functions of the polymers. In Table 4 the polymers have been grouped according to their chemical functions: first, the most apolar polymer selected for this study, PE, displays the lowest π* value; the presence of acetate groups in PE makes the π* value increase (EVA9, EVA33), whereas polyesters (PLA, PMMA, PVAc) have similar π* values. Then, alcohols and ether groups (EVOH, PVA, PEO) have higher π* values than polyesters. Finally, the highest π* values are obtained for PAA and PK, polymers with carboxylic acid or ketone functions.
One can observe that some polymers have similar π* values, whereas their chemical function is different, for example EVOH27 and PVAc, or (alcohol and acetate). It indicates that the π* parameter is not sensitive enough to discriminate between different chemical functions, other parameters, such as the β parameter, must be investigated.
3.4.2. Determination of β parameter for polymers
According to the literature, the β parameter can be determined from the wavelength at the maximum of the longest UV-visible absorption band of 4-nitroaniline (ANL) λANL in the
polymer, considering equation (4) [23] :
(4)
where υANL (=1/λANL)is the maximum wavenumber of ANL. Once again, this equation was
obtained from experimental data concerning a series of liquid solvents, and this method has been applied to various polymers [21,22], which allowed the authors to determine β values. Figure 8 shows the UV-visible absorption spectra of ANL in the various polymer selected for this study.
Fig. 8. UV-absorption spectra of ANLin different polymers. a) PE, EVA9, EVA33, PLA, PMMA and PVAc. b) EVOH44, EVOH27, PEO, PVA, PAA and PK.
200 250 300 350 400 450 500 550 600 0,0 0,5 1,0 1,5 2,0 2,5 3,0 Absor ba nce Wavelength (nm) EVOH44 EVOH27 PEO PAA PVA PK 388 374 379 384 384 b) 384 200 250 300 350 400 450 500 550 600 0,0 0,5 1,0 1,5 2,0 2,5 3,0 Absor ba nce Wavelength (nm) EVA9 EVA33 PLA PMMA PVAc PE 350 381 368 368 358 356 a)
20
Table 5 summarizes the experimental data obtained from the UV-absorption maximum wavelength of ANL given in Figure 8.
Table 5 – Experimental data obtained for UV-absorption maximum wavelength of ANL in different polymers and the corresponding β values calculated from equation (4).
One can see that the order of the classification of the polymers according to their β value is not the same than that obtained for π* (Table 4). Indeed, this can be ascribed to the different ability of each polymer to accept a proton depending on the chemical functions of the monomer unit. This could explain that, according to the chemical structure of the polymer, the α and β values could vary whereas the polarizability π* is the same.
One can notice that the polymers with the highest β value (PE, EVOH, PEO), i.e. the highest capacity to accept a proton, are close to polyethylene in terms of chemical structure. On the contrary, the polymers with the lowest β value are the ones which have acid/ester/ketone functions (PK, PAA, PLA), which is consistent with the fact that they have the lowest capacity to accept a proton.
The results given in Table 5 indicate that our experimental values differ slightly from the data found in the literature. This has already been noticed by Paley et al. [21] and the differences have been ascribed to the variety of polymer preparation processes, involving different
Polymer λmax (nm) νmax abs (*10 3
cm-1) Experimental β β from literature
PE 381 ± 1 26.25 ± 0.10 1.45 EVA9 350 ± 1 28.57 ± 0.10 0.50 EVA33 358 ± 1 27.93 ± 0.10 0.52 PVAc 368 ± 1 27.17 ± 0.10 0.54 0.70 [22] / 0.44 [21] PMMA 368 ± 1 27.17 ± 0.10 0.61 0.38 [22,21] PLA 356 ± 1 28.09 ± 0.10 0.39 EVOH44 384 ± 1 26.04 ± 0.10 0.98 EVOH27 384 ± 1 26.04 ± 0.10 0.95 PVA 388 ± 1 25.77 ± 0.10 0.67 0.52 [21] PEO 379 ± 1 26.39 ± 0.10 0.74 0.65 [22] PAA 384 ± 1 26.04 ± 0.10 0.44 PK 374 ± 1 26.74 ± 0.10 0.04
21
initiators, molecular weights, etc. As a consequence, it may induce some differences between the solvatochromic parameters from a study to another, according to the different sources of the polymers.
3.4.3. Determination of α parameter for polymers
According to the literature, the α parameter is determined from the wavelength at the maximum of the longest UV-visible absorption band of Reichardt’s dye (2,6,-Diphenyl-4-(2,4,5-triphenylpyridinium-1-yl) phenolate). Unfortunately, the probe used for the determination of α (Reichardt’s dye) might not have enough affinity with the polymers, so this molecular probe could not be introduced in the polymer matrix by diffusion.
It is reported in the literature that the emission band frequency of Prodan® could be correlated with the solvatochromic parameters π*, α and β according to equation (5) [24]:
νemmax = (25.2 ± 0.2) – (2.6 ± 0.2)π* - (2.5 ± 0.2)α - (1.0 ± 0.1)β (5)
For establishing this equation, the authors monitored the emission spectra of Prodan® in various solvents with known solvatochromic parameters π*, α and β. Considering this equation, it could be anticipated that recording the emission spectra of Prodan® in the polymers used in this study would allow us to determine the α parameters for these polymers. Table 6 summarizes the experimental data that were measured for emission maximum wavelength of Prodan® given in Figure 6 and the various α values calculated from equation (5) using the data given in Tables 3, 4 and 5.
The results summarized in Table 6 indicate that the α values depend on the polymer. PE has the lowest α value of -0.62, and α increases when the polymer contains hydroxyl groups to reach > 0 values (EVOH44 and EVOH27, values around 0.07 - 0.09). This reflects the ability of the polymer to act as a hydrogen bond donor. However, it should be also pointed out that there are some discrepancies between the various values of α reported in the literature. This makes questionable the use of α to discriminate polymers with some different chemical functions.
22
Table 6 – Experimental data obtained for emission maximum wavelength of Prodan® in different polymers and the α values calculated from equation (5).
3.5. Determination of solvatochromic parameters in oxidized polyethylene
On the basis of the previous experiments and the determination of the polarizability π* on a wide panel of polymers with various chemical functions, we applied the same methodology on aged PE in order to put in light the difference in the ageing mechanism of polyethylene can be assessed by the determination of solvatochromic parameters, and, if so, to what extent. The chosen ageing times corresponding to the same carbonyl area were 100 h in the case of photooxidation and 48 h in the case of thermooxidation.
Thanks to our database on the emission maximum wavelength of Prodan® in pure polar polymers, our goal was to discriminate the differences between photo- and thermooxidation mechanism of polyethylene, considering that the oxidation products formed during photo- and thermooxidation are different. We had them to determine the solvatochromic parameters π*, β and α using the procedure described above in parts 3.4.1 to 3.4.3.
Figure 9a and 9b show the UV-visible absorption spectra of respectively, ANS and ANL, in 100h photooxidized and 48h thermooxidized PE.
Polymer λmax em (nm)
νmax em
(*103 cm-1)
α from equation (5) and data from Tables 3, 4
and 5 α from literature PE 406 ± 1 24.63 ± 0.10 - 0.62 EVA9 408 ± 1 24.48 ± 0.10 - 0.29 EVA33 417 ± 1 23.96 ± 0.10 - 0.28 PLA 427 ± 1 23.43 ± 0.10 - 0.08 PMMA 429 ± 1 23.30 ± 0.10 - 0.22 0 [22] /0.24 [21] PVAc 430 ± 1 23.20 ± 0.10 - 0.22 0 [22] / 0.02 [21] PK 441 ± 1 22.68 ± 0.10 - 0.40 PVA 444 ± 1 22.54 ± 0.10 - 0.35 0.29 [21] PAA 449 ± 1 22.28 ± 0.10 - 0.28 EVOH44 452 ± 1 22.12 ± 0.10 0.07 EVOH27 454 ± 1 22.03 ± 0.10 0.09 PEO 454 ± 1 22.03 ± 0.10 0.10 0 [22]
23
Fig. 9. UV-absorption spectra of a) ANS and b) ANLin photo- and thermooxidized PE films.
One can see that the maximum absorption wavelength of ANS is the same in both oxidized PE (about 302 nm), which corresponds to a π* value of about 0.43 according to equation (3) (Table 7). Compared to the π* value of an unaged PE (0.26), there is a marked increase of the π* value, in other words polarizability, of PE during photo- and thermal ageing. This is consistent with the increase of polarity due to the accumulation of oxidation products in the polymer matrix. However, the π* value is the same regardless of the ageing method (photo- or thermooxidation). This means that, even if the oxidation products in photo and thermal oxidation are formed with different relative concentrations, the global polarizability of the medium is not changed. The π* parameter does not allow discriminating between the different oxidation products formed.
Determination of β was carried out using ANL (Figure 9b). One can observe that the maximum absorption wavelength of ANL is different in the two samples: around 350 nm for thermooxidation and 360 nm for photooxidation. This corresponds to a β value of about 0.48 for thermooxidized PE and 0.71 for photooxidized PE according to equation (4) (Table 7). In this case, the β value is sensitive to chemical functions of the products formed during ageing. The α parameter was then calculated following the same procedure as reported above, using equation 5 (Table 7). 200 250 300 350 400 450 500 550 600 0,0 0,2 0,4 0,6 0,8 1,0 1,2 1,4 1,6 1,8 2,0 Absor ba nce Wavelength (nm) Photooxidized PE (100h) Thermooxidized PE (48h) a) 200 250 300 350 400 450 500 550 600 0,0 0,2 0,4 0,6 0,8 1,0 1,2 1,4 1,6 1,8 2,0 Absor ba nce Wavelength (nm) Photooxidized PE (100h) Thermooxidized PE (48h) b)
24
Table 7 – Solvatochromic parameters π*, β and α in unaged, photo- and thermooxidized polyethylene.
νmax em from Figure 3 π* β α
Unaged 24.63 ± 0.10 0.26 1.45 -0.62
Thermooxidized for 48h 23.81 ± 0.10 0.43 0.48 -0.06
Photooxidized for 100h 24.27 ± 0.10 0.43 0.71 -0.36
These results reflect the differences between photo- and thermooxidation mechanism of PE. Indeed, the ketones accumulate in the polymer matrix during thermooxidation, but they react during photooxidation through the Norrish reactions and transform into carboxylic acids, esters, etc. As shown in Table 5, the β parameter of PK is very low (0.04), whereas it is higher in polyesters and PAA. This explains why the global β value of thermooxidized PE is lower, due to the accumulation of ketones in the polymer matrix, whereas the accumulation of carboxylic acids and esters during photooxidation of PE makes the β value higher.
One can observe that the α parameter is different between unaged and aged PE. Before ageing, the α value of PE is very low, which is consistent with the fact that PE has a very low capacity to donate a proton. However, after thermo- and photo-ageing, the α value increases for both PE (respectively -0.06 and -0.36). This reflects the increase of the capacity of the polymer to donate a proton. This can be explained by the accumulation of carbonylated and hydroxylated oxidation products in the polymer matrix during ageing, which have a higher capacity to donate a proton (Table 6). However, the variations of the α coefficient does not allow characterizing the differences between thermo- and photo-oxidation. Moreover, the α values reported in literature show important differences and at evidence α is not a sensitive criterium to discriminate changes of stoichiometries in thermo- and photooxidation of PE.
4. Conclusion
It has been shown that the solvatochromic parameters (π*, β, α) of a series of polymers with different functional groups could be determined. The parameters π*, α and β were determined following the procedures described in the literature and the obtained values of π* and β had a good fit with the reported values. This constitutes a solid data basis that could be applied to the oxidation of different polymers. Prodan® was proved to be a useful fluorescent probe to reveal different chemical functions in a polymer and different oxidation products. This methodology was successfully applied to discriminate photo and the thermooxidation of polyethylene which present different stoichiometries in the oxidation products formed
25
depending on the ageing stresses, it can be a complementary tool of other techniques such as FTIR to characterize polymer degradation. Moreover, the determination of the solvatochromic parameters such as π* and β, using UV-visible absorption of ANS and ANL, can reveal different stoichiometry in oxidation products of polymers.
Acknowledgement
The authors wish to thank Sophie Desset from the CLIC (Clermont Imagerie Confocale) from GReD laboratory at Clermont-Ferrand University (France) for fluorescence microscopy images.
26
Figure captions
Figure 1 : Infrared spectra of PE films either photooxidized during 100h or thermooxidized during 48h – zoom in the absorption range of carbonyl (1900-1500 cm-1).
Figure 2 : Fluorescence microscopy images of Prodan® impregnated into a) unaged PE film b) 48h thermooxidized PE film and c) 100h photooxidized PE film.
Figure 3 : Emission spectra of Prodan® in PE films (sorption time 1 h in a Prodan® solution at 5.10-3 M) before ageing, after photooxidation (100 h) and after thermooxidation (48h). Figure 4 : Wavelength at the Prodan®maximum of emission (λmax) vs. carbonyl IR area.
Figure 5 : a) Infrared spectra and b) emission spectra of Prodan® in a 48h thermooxidized PE film before and after 50h photolysis – zoom in the absorption range of carbonyl (1900-1500 cm-1).
Figure 6 : Emission spectra of Prodan®in different polymers. a) PE, EVA9, EVA33, PLA, PMMA and PVAc. b) EVOH44, EVOH27, PEO, PVA, PAA and PK.
Figure 7 : UV-absorption spectra of ANSin different polymers. a) PE, EVA9, EVA33, PLA, PMMA and PVAc. b) EVOH44, EVOH27, PEO, PVA, PAA and PK.
Fig. 8. UV-absorption spectra of ANL in different polymers. a) PE, EVA9, EVA33, PLA, PMMA and PVAc. b) EVOH44, EVOH27, PEO, PVA, PAA and PK.
Fig. 9. UV-absorption spectra of a) ANS and b) ANLin photo- and thermooxidized PE films.
Scheme 1: Chemical structure of 4-nitroanisole (ANS), 4-nitroaniline (ANL) and Prodan®. Scheme 2 : Comprehensive mechanism of photooxidation and thermooxidation of polyethylene [17].
Table 1 : Polymers used in this study: sample preparation and method for introducing the molecular probes.
Table 2 : Dependence of the wavelengths at the Prodan® maximum of emission vs. photo- and thermooxidation time.
Table 3 : Experimental data obtained for emission maximum wavelength of Prodan® in different polymers.
Table 4 : Experimental data obtained for UV-absorption maximum wavelength of ANS in different polymers and the corresponding π* values calculated from equation (3).
Table 5 : Experimental data obtained for UV-absorption maximum wavelength of ANL in different polymers and the corresponding β values calculated from equation (4).
27
Table 6 : Experimental data obtained for emission maximum wavelength of Prodan® in different polymers and the α values calculated from equation (5).
Table 7 : Solvatochromic parameters π*, β and α in unaged, photo- and thermooxidized polyethylene.
28
References
[1] Bosch P., Catalina F., Corrales T. Peinado C. Fluorescent probes for sensing processes in polymers. Chem Eur J 2005;11:4314-4325.
[2] Peinado C., Allen N.S., Salvador E.F., Corrales T., Catalina F. Chemiluminescence and fluorescence for monitoring thephotooxidation of an UV-cured aliphatic polyurethane-acrylate based adhesive. Polym Degrad Stab 2002;77:523-529.
[3] Lussini V.C, Blinco J.P., Fairfull-Smith K.E., Bottle S.E., Colwell J.M. Profluorescent nitroxide sensors for monitoring the natural aging of polymer materials. Polym Degrad Stab 2020;174:109091.
[4] Rapp G, Poutougnigni EA, Gardette JL, Bussiere PO, Therias S. Impact of thermal
oxidation of polymers on features of fluorescent probes. Polym Degrad Stab 2018;157:63-69. [5] Fukuda R, Chidthong R, Cammi R, Ehara M. Optical absorption and fluorescence of Prodan in solution : Quantum chemical study based on the symmetry-adapted cluster-configuration interaction method. Chem Phys Lett 2012;552:53-57.
[6] Artukhov VY, Zharkova OM, Morozova JP. Features of absorption and fluorescence spectra of Prodan. Spectrochimica Acta Part A 2007;68 :36-42.
[7] Sengupta B, Guharay J, Sengupta PK. Characterization of the fluorescence emission properties of Prodan in different reverse micellar environments. Spectrochimica Acta Part A 2000;56:1433-1441.
[8] Ginhac JM, Gardette JL, Arnaud R, Lemaire J. Influence of hydroperoxides on the photothermal oxidation of polyethylene. Makromolekulare Chemie 1981;182:1017-1025. [9] Lacoste J, Carlsson DL. Gamma-, photo-, and thermally-initiated oxidation of linear low density polyethylene : a quantitative comparison of oxidation products. J. Polym. Sci. Part A Polymer Chemistry 1992;30:493-500.
[10] Cruz-Pinto JJC, Carvalho MES, Ferreira JFA. The kinetics and mechanism of
polyethylene photooxidation, Die Angewandte Makromolekulare Chemie 1994;216(1):113-133.
[11] Costa L, Luda MP, Trossarelli L. Ultra high molecular weight polyethylene II. Thermal and photo-oxidation. Polym Degrad Stab 1997;58:41-54.
[12] Kamlet MJ, Dickinson C, Taft RW. Linear Solvation Energy Relationships. Solvent effects on some fluorescence probes. Chem Phys Lett 1981;77(1):69-72.
[13] Marcus Y. The properties of organic liquids that are relevant to their use as solvating solvents. Chem Soc Rev 1993:409-416.
[14] Zaslavsky BY, Miheeva LM, Masimov EA, Djafarov SF, Reichardt C. Solvent polarity of aqueous polymer solutions as measured by the solvatochromic technique. J Chem Soc, Faraday Trans 1990;86(3):519-524.
29
[15] McGill RA, Paley MS, Harris JM. Solvatochromic Characterization of polymers. Effects of relative humidity. Macromolecules 1992;25(12):3015-3019.
[16] Philippart JL, Sinturel C, Gardette JL. Influence of light intensity of the photooxidation of polypropylene. Polym Degrad Stab 1997;58:261-268.
[17] Gardette M, Perthue A, Gardette JL, Janecska T, Földes E, Pukánszky B, Therias S. Photo- and thermal-oxidation of polyethylene: Comparison of mechanisms and influence of unsaturation content. Polym Degrad Stab 2013;98:2382-2390.
[18] Barja BC, Chesta C, Atvars TDZ, Aramendia PF. Relaxations in poly(vinylalcohol) and in poly(vinyl acetate) detected by fluorescence emission of 4-aminophthalimide and Prodan. J Phys Chem B 2005;109:16180-16187.
[19] Stawinoga M, Sleiman M, Chastain J, Richard C. Usefulness of fluorescent probe Prodan to gain insight into the polarity of plant cuticles. J Agric Food Chem 2015;63:6932-6938. [20] Kamlet MJ, Abboud JLM, Abraham MH, Taft RW. Linear Solvation Energy
Relationships. 23. A Comprehensive Collection of the Solvatochromic Parameters, π*, α, and β, and Some Methods for Simplifying the Generalized Solvatochromic Equation. J Org Chem 1983;48:2877-2887.
[21] Paley MS, McGill RA, Howard SC, Wallace SE, Harris JM. Solvatochromism. A New Method for Polymer Characterization. Macromolecules 1990;23:4557-4564.
[22] Spange S, Vilsmeier E, Fishcer K, Reuter A, Prause S, Zimmermann Y, Schmidt Ch. Empirical polarity parameters for various macromolecular and related materials. Macromol Rapid Commun 2000;2:643-659.
[23] Salari H, Khodadadi-Moghaddam M, Harifi-Mood AR, Gholami MR. Preferential Solvation and Behavior of Solvatochromic Indicators in Mixtures of an Ionic Liquid with Some Molecular Solvents. J Phys Chem B 2010;114:9586-9593.
[24] Moyano F, Biasutti MA, Silber JJ, Correa NM. New Insights on the Behavior of Prodan® in Homogeneous Media and in Large Unilamellar Vesicles. J Phys Chem B 2006;110:11838-11846.