HAL Id: hal-00302122
https://hal.archives-ouvertes.fr/hal-00302122
Submitted on 25 Sep 2006HAL is a multi-disciplinary open access
archive for the deposit and dissemination of sci-entific research documents, whether they are pub-lished or not. The documents may come from teaching and research institutions in France or abroad, or from public or private research centers.
L’archive ouverte pluridisciplinaire HAL, est destinée au dépôt et à la diffusion de documents scientifiques de niveau recherche, publiés ou non, émanant des établissements d’enseignement et de recherche français ou étrangers, des laboratoires publics ou privés.
Ozone production and hydrocarbon reactivity in Hong
Kong, Southern China
J. Zhang, T. Wang, W. L. Chameides, C. Cardelino, J. Kwok, D. R. Blake, A.
Ding, K. L. So
To cite this version:
J. Zhang, T. Wang, W. L. Chameides, C. Cardelino, J. Kwok, et al.. Ozone production and hydro-carbon reactivity in Hong Kong, Southern China. Atmospheric Chemistry and Physics Discussions, European Geosciences Union, 2006, 6 (5), pp.8961-9002. �hal-00302122�
ACPD
6, 8961–9002, 2006 Ozone production and hydrocarbon reactivity in Hong Kong J. Zhang et al. Title Page Abstract Introduction Conclusions References Tables Figures J I J I Back CloseFull Screen / Esc
Printer-friendly Version Interactive Discussion
Atmos. Chem. Phys. Discuss., 6, 8961–9002, 2006 www.atmos-chem-phys-discuss.net/6/8961/2006/ © Author(s) 2006. This work is licensed
under a Creative Commons License.
Atmospheric Chemistry and Physics Discussions
Ozone production and hydrocarbon
reactivity in Hong Kong, Southern China
J. Zhang1,2, T. Wang3, W. L. Chameides1, C. Cardelino1, J. Kwok3, D. R. Blake4, A. Ding3, and K. L. So3
1
School of Earth and Atmospheric Sciences, Georgia Institute of Technology, Atlanta, GA 30332, USA
2
School of Geography, Beijing Normal University, Beijing 100875, China
3
Department of Civil and Structural Engineering, Hong Kong Polytechnic University, Hong Kong, China
4
Department of Chemistry, University of California, Irvine, CA 92697, USA
Received: 18 July 2006 – Accepted: 14 August 2006 – Published: 25 September 2006 Correspondence to: T. Wang (cetwang@polyu.edu.hk)
ACPD
6, 8961–9002, 2006 Ozone production and hydrocarbon reactivity in Hong Kong J. Zhang et al. Title Page Abstract Introduction Conclusions References Tables Figures J I J I Back CloseFull Screen / Esc
Printer-friendly Version Interactive Discussion Abstract
Data obtained in Hong Kong during the Hong Kong and the Pearl River Delta (PRD) Pilot Air Monitoring Study in autumn 2002 are analyzed to unravel the relationship be-tween ground-level ozone (O3), pollution precursors, and cross-border transport. Ten ozone episodes, during which the hourly O3 concentration exceeded 100 ppbv in 9 5
cases and 90 ppbv in one case, are subject to detailed analysis, including one case with hourly O3 of 203 ppbv, which is the highest concentration on record to date in Hong Kong. Combined with high-resolution back trajectories, dCO/dNOy is used to define whether O3is locally or regionally produced. Five out of the ten Hong Kong O3 -episodes studied show a “pollution signature” that is indicative of impact from Guang-10
dong Province. Examination of speciated volatile organic compounds (VOCs) shows that the reactivity of VOCs is dominated by anthropogenic VOCs, of which the reactive aromatics dominate, in particular xylenes and toluene. Calculations using a photo-chemical box model indicate that between 50–100% of the O3 increase observed in Hong Kong during the O3 episodes can be explained by photochemical generation 15
within the Hong Kong area, provided that nitrous acid (HONO) is present at the con-centrations derived from this study. An Observation-Based Model (OBM) is used to calculate the sensitivity of the O3 production to changes in the concentrations of the precursor compounds. Generally the production of O3 throughout much of the Hong Kong area is limited by VOCs, while high nitric oxide (NO) concentrations suppress O3 20
concentration.
1 Introduction
The Pearl River Delta and adjoining Hong Kong metropolitan area of China, like virtu-ally all other major urban-industrialized regions of the world, suffers from photochemical smog characterized by the unhealthily high concentrations of ozone (O3) and fine par-25
ticles (Kok et al., 1997; Wang et al., 2001a; CH2M Hill, 2002; Wang, 2003). To design 8962
ACPD
6, 8961–9002, 2006 Ozone production and hydrocarbon reactivity in Hong Kong J. Zhang et al. Title Page Abstract Introduction Conclusions References Tables Figures J I J I Back CloseFull Screen / Esc
Printer-friendly Version Interactive Discussion
an effective strategy for controlling ground-level O3pollution, it is critical to understand the O3 precursor relationships, i.e., the relative contributions of anthropogenic volatile organic compounds (VOCs) and nitrogen oxides (NOx = NO + NO2) emissions to O3 production in Hong Kong, as well as local and regional contribution to ozone.
Traditionally, sophisticated air quality simulation models (AQMs, i.e. Emission Based 5
Models – EBMs) have been used to determine whether a given airshed is VOC or NOx limited (Russell and Dennis, 2000, and papers cited therein). However, there are sig-nificant uncertainties in many aspects of EBMs (National Academy of Sciences (NAS), 1991; Oreske, 1994) including the emission inventories used to define the sources of O3 precursors (Pierson et al., 1990; Geron et al., 1994; Simpson, 1995; Guenther 10
et al., 2000; Tan et al., 2004), the meteorological fields (Hanna et al., 1996; Kumar and Russell, 1996) and parameterizations used to simulate boundary layer dynamics (Kuklin and Seinfeld, 1995; Hanna et al., 1996). Further uncertainties may arise in the case of grid-based or Eulerian models for the assumption that point source emissions are dispersed throughout a grid instantaneously (Sillman et al., 1990). A complemen-15
tary approach to the use of EBMs is the application of observation-based analyses and/or models (Hidy, 2000), which uses measurements of ambient concentrations of the chemical composition to check the applicability of physical/chemical mechanisms for the atmospheric processes (Calvert, 1976; Parrish et al., 1986; Chameides et al., 1990; McKeen et al., 1997) and for assessing the relative benefits of various proposed 20
emission control strategies for regulatory purposes (Chameides et al., 1992; Cardelino and Chameides, 1995, 2000; Sillman, 1995; Sillman et al., 1997; Blanchard et al., 1999). Since the observation-based methods do not use emission inventories and of-ten do not require the simulation of boundary layer dynamics, they avoid some of the uncertainties inherent in EBMs and thus provide a useful independent verification on 25
the results obtained using EBMs.
In this study, a variety of observation-based analyses and models are used to ana-lyze data collected during an intensive field campaign in the Hong Kong and the Pearl River Delta (PRD) Pilot Air Monitoring Study. The project was initiated in May 2002
ACPD
6, 8961–9002, 2006 Ozone production and hydrocarbon reactivity in Hong Kong J. Zhang et al. Title Page Abstract Introduction Conclusions References Tables Figures J I J I Back CloseFull Screen / Esc
Printer-friendly Version Interactive Discussion
and implemented over a 2-year period to better elucidate the emissions and processes responsible for the formation and accumulation of ground-level O3 in this area. Here we present the results of various observation-based analyses that were carried out (1) to identify the specific VOCs and VOC sources that contribute most to the formation of photochemical smog in Hong Kong, (2) to quantify the relative contributions of local 5
production and pollutant import from other locations to the presence of photochemi-cal smog, and (3) to assess, in a preliminary fashion, the relative benefits of various emission-control strategies for reducing the severity of photochemical smog.
2 Experimental data
Our analyses are based on data collected during an intensive sampling period from 1 10
October to 31 December, 2002 at five locations in Hong Kong: Central Western (CW), Yuen Long (YL), Tung Chung (TC), Tai O (TO), and Tap Mun (TM) (Plate 1). TO was operated by the Hong Kong Polytechnic University and the other four are monitoring sites operated by Hong Kong Environmental Protection Department (HK EPD).
2.1 Meteorological conditions 15
Hong Kong is situated on the South China coast and has a subtropical climate. The fall season is characterized by moderate temperatures, light winds out of the northeast and little precipitation. These conditions favor the transport of polluted air from the Asian continent to Hong Kong, as well as the accumulation of locally emitted pollutants in Hong Kong (Wang et al., 2001a). A detailed discussion of the meteorological conditions 20
during the intensive 3-month field campaign of the Pilot Study is presented by Zhang et al. (2004).
ACPD
6, 8961–9002, 2006 Ozone production and hydrocarbon reactivity in Hong Kong J. Zhang et al. Title Page Abstract Introduction Conclusions References Tables Figures J I J I Back CloseFull Screen / Esc
Printer-friendly Version Interactive Discussion
2.2 Sites description
Tai O (22.25◦N, 113.85◦E) is the Supersite for the study, where more intensive obser-vations were performed than at the other sites. It is located in a sparsely populated coastal area with light local emissions, on northwestern Lantau Island roughly in the north-south centerline of the Pearl Estuary with Hong Kong’s urban center of 32 km 5
to the east and Macau/Zhuhai to the west at about the same distance. The area is surrounded by major urban centers in the PRD region, making it a good location to characterize local and regional emissions and the photochemical evolution of urban plumes. TO was selected as the location for the Supersite because available air qual-ity data revealed that the highest ozone concentrations during air pollution episodes 10
are generally found in the western part of Hong Kong (Kok et al., 1997; Wang et al., 2001a). The measurement site is located inside an inactive barracks, at an elevation of ∼80 m above sea level. Information about the instruments can be found in Wang et al. (2003) and Zhang et al. (2004). Longer term (18-month) data on various trace gases from this site were analyzed by Wang et al. (2005) and Simpson et al. (2006), 15
and fine aerosol data in December 2002 and pollution episodes observed in the earlier periods were examined by Cheung et al. (2005); Wang and Kok (2003); and Wang et al. (2003). The Central-Western site (22.27◦N, 114.13◦E) is located in a residential area on the northern western part of Hong Kong Island and near Hong Kong’s busy “downtown” area (Plate 1). Yuen Long (22.45◦N, 114.02◦E) is located in a new town 20
in the northwestern part of New Territory in Hong Kong. It is about 15 km southwest of Shenzhen, a large and developing industrial city in Guangdong Province in South China. Tung Chung (22.30◦N, 113.93◦E) is located on north Lantau Island about 10 km to the east of TO and about 3 km south of Hong Kong International airport on Chek Lap Kok. TC is located in a relatively new town within a residential area, but adjacent to the 25
highway and to railway lines that connect the airport to the other islands of Hong Kong. Tap Mun (22.47◦N, 114.33◦E) is located on a remote island just off the northeast coast of Hong Kong. The surrounding area is rural and sparsely populated.
ACPD
6, 8961–9002, 2006 Ozone production and hydrocarbon reactivity in Hong Kong J. Zhang et al. Title Page Abstract Introduction Conclusions References Tables Figures J I J I Back CloseFull Screen / Esc
Printer-friendly Version Interactive Discussion
2.3 Continuous measurements
Trace gases including O3, NO, NO2, CO, SO2 and NOy were measured contin-uously at most of the sites, as were meteorological parameters. Among these species/parameters, O3, NO, CO, and temperature, together with organic compounds, are the critical inputs to the Observation Based Model (OBM) used to assess the sensi-5
tivity of local O3photochemical production to changes in the concentrations/emissions of NOx and VOC (Sect. 3.2). In addition, CO, SO2 and NOy can be used as tracers of specific types of pollution and thus can provide valuable insights into the specific sources of pollutants that contribute to concentrations measured at the site (e.g. pollu-tion from Hong Kong versus pollupollu-tion from Guangdong). However, among the species 10
needed for the OBM, CO was not measured at CW and YL, NO was not measured at YL, and CO measurements at TC and TM were made using instrumentation that lacked sensitivity to quantify CO concentrations when these concentrations are rela-tively low (i.e., <1 ppmv), because the EPD CO instruments were designed to monitor for compliance with the Hong Kong ambient air quality standard for CO (8-h average 15
of 8.7 ppmv). In order to carry out the OBM analysis for these sites, the required data were extrapolated from related measurements as described below. In the case of CO, sufficiently sensitive determinations of the 24-h averaged CO concentrations at CW, YL, TC, and TM were made using whole air samples collected from these sites (see Sect. 2.4 below). These 24-h averaged CO measurements were used to set the magni-20
tude of the CO concentration that was input into the OBM, and the local continuous CO measurements were used to establish the diurnal variations. At CW, where local, con-tinuous CO measurements were not available, concon-tinuous CO measurements made at a neighboring site (Central, located about 1 km to the southeast of CW) were used to set the diurnal variations. For YL, continuous CO measurements made at Tsuen Wan 25
(located about 10 km to the south of YL) were used for the diurnal variations. Sensitiv-ity calculations using constant CO concentrations at each of these sites throughout the diurnal cycle, based on the whole air sample analysis, indicate that the results of the
ACPD
6, 8961–9002, 2006 Ozone production and hydrocarbon reactivity in Hong Kong J. Zhang et al. Title Page Abstract Introduction Conclusions References Tables Figures J I J I Back CloseFull Screen / Esc
Printer-friendly Version Interactive Discussion
OBM analyses were not significantly affected by these approximations.
At YL, the NO concentrations required in the OBM were estimated from the NO2 and related data obtained for YL using the chemical mechanism and iterative algo-rithms already contained in the OBM. Sensitivity calculations in which the NO concen-trations were allowed to vary within reasonable limits at YL indicate that the conclusions 5
reached using the OBM calculations were again not substantively affected by these ap-proximations. The NO instruments at all the sites had enough sensitivity to measure the relatively high concentrations of NO during the episode days.
In addition, aerosol optical properties including light scattering and light absorption were measured during most of the measurement period at Tai O. These measurements 10
were used to identify whether significant statistical correlations existed between ozone and particulate matter pollution.
2.4 Collection of whole air samples and analysis for VOCs and CO
The ambient concentrations of C1–C10 hydrocarbons, CO, and C1–C2halocarbons at each of the sites were determined on selected days using whole air sampling canisters 15
with subsequent analysis using gas chromatography. The samples were then shipped to and analyzed at the University of California – Irvine. The detailed descriptions of the analytical techniques are given in Colman et al. (2001).
As noted above, hourly speciated VOC and CO concentrations are needed as input to the OBM for a given site. However, the VOC analyses made for the 4 EPD sites 20
were based on ambient whole air samples gathered over a 24-h period, and thus their use in the OBM required that estimates of hourly VOC concentrations at each site be derived. The derivation of diurnal VOC profile is presented in Sect. 3.2.2. In the case of the VOC concentrations at TO, while individual samples were generally collected at several times during the day, the frequency of collection was not hourly (see above). 25
For this site, hourly VOC concentrations were estimated through a simple linear inter-polation. Once again, it should be noted that sensitivity calculations with the OBM (in this case using constant, 24-h concentrations throughout the day) indicated that the
ACPD
6, 8961–9002, 2006 Ozone production and hydrocarbon reactivity in Hong Kong J. Zhang et al. Title Page Abstract Introduction Conclusions References Tables Figures J I J I Back CloseFull Screen / Esc
Printer-friendly Version Interactive Discussion
approximations involved in estimating the diurnal variation in the VOC concentrations did not substantively affect our results.
3 Results and analyses
3.1 Data and diagnostic analysis 3.1.1 O3Pollution episodes 5
Figure 1 illustrates the time series of measurements made at TO during the field mea-surement period. For the purposes of the analyses discussed here, we define an O3 episode day as a day when the peak one-hour averaged O3 concentration at TO (the site where O3 was generally the highest) exceeded 100 ppbv. (There were not any days during the measurement campaign when O3 exceeded 100 ppbv at one of 10
the other four sites but did not exceed 100 ppbv at TO, so this definition is inclusive.) Inspection of Fig. 1 reveals that during the campaign, 9 O3episode days were encoun-tered. Of these 9, 4 occurred during a multiple-day episode spanning 9–12 October (O3 maximum = 149 ppbv), 3 occurred during a multiple-day episode spanning 5–7 November (O3maximum= 203 ppbv). The November 7th episode day was especially 15
interesting as the peak O3on that day of 203 ppbv is the highest O3concentration ever reported for the Hong Kong/PRD region to date. The two other individual O3 episode days occurred on 25 October and 12 November.
Further inspection of Fig. 1 reveals that the O3 episode days occurred when the total UV was high, the wind speed was low, and the wind direction was generally from 20
the north/northeast/northwest, which is consistent with previous observations in the area (Wang and Kwok, 2003; Wang et al., 2003). On some episode days SO2 or NOy was high (e.g. 11 October and 7 November), but not on others (e.g. 9 October). CO was generally high on episode days, for example 9–11 October, 25 October, and 5–7 November. Aerosol absorption was high on 10–11 October and 7 November. On 7 25
ACPD
6, 8961–9002, 2006 Ozone production and hydrocarbon reactivity in Hong Kong J. Zhang et al. Title Page Abstract Introduction Conclusions References Tables Figures J I J I Back CloseFull Screen / Esc
Printer-friendly Version Interactive Discussion
November, when O3reached its record high of 203 ppbv, SO2, NOy, CO, TUV and light absorption were all relatively high. By contrast, note that on 30 November, CO, SO2, NOy, and aerosol absorption were all high and the wind direction was favorable for the import of O3 precursors into the Hong Kong area, and yet, probably because of low temperatures and overcast conditions (i.e., low total UV), an O3episode did not occur. 5
In the analyses presented here, we will focus on the aforementioned 9 O3 episode days as well as an additional near-O3 episode day (8 November) when O3 peaked at 91 ppbv to see if there are any striking differences on this day as compared to the actual episode days. Relevant episode characteristics on each of these days are listed in Table 1. For example, VOC data were obtained at TO on all days but 12 October, 10
and 7 November was the only day when VOC data was obtained at the EPD-operated sites as well as at TO. For this reason, and because the O3recorded on 7 November was the highest on record for the area, the data gathered on this day are subjected to the most comprehensive analysis.
3.1.2 Diurnal variations of O3and related species 15
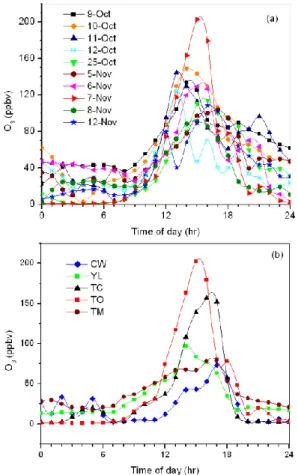
Figure 2a shows the diurnal O3 variations on the episode days at TO. As is typical of urban areas, O3 is low at night and in the morning (presumably due to NO titra-tion and dry deposititra-tion) and peaks during the afternoon (as a result of photochemical production and to a less extent downward mixing of ozone from above the boundary layer). There are some notable features of the O3 variation at TO. First, O3 does not 20
begin to increase until relatively late in the morning, and secondly, O3appears to peak relatively early and begins to decline relatively early in the afternoon, which is similar with the observations of Wang and Kwok (2003). This behavior could be attributed to high concentrations of NO (see later discussion), a short period of intense sunlight (the episodes are occurring well after the fall equinox), and transport of air masses of 25
different chemical characteristics to the site.
Figure 2b shows the O3 concentrations at all five sites on 7 November at EPD-operated sites. As is typical of the area and of all episodes encountered during the
ACPD
6, 8961–9002, 2006 Ozone production and hydrocarbon reactivity in Hong Kong J. Zhang et al. Title Page Abstract Introduction Conclusions References Tables Figures J I J I Back CloseFull Screen / Esc
Printer-friendly Version Interactive Discussion
field campaign, O3 was highest on Lantau Island (TC, TO), and higher at TO than at TC. The diurnal variations of O3observed at the EPD-operated sites are similar to that observed at TO in that the O3increase begins relatively late in the morning. However, unlike TO, only the YL site also showed an O3 peak relatively early in the afternoon; the TC, CW and TM sites showed peaks closer to 18:00.
5
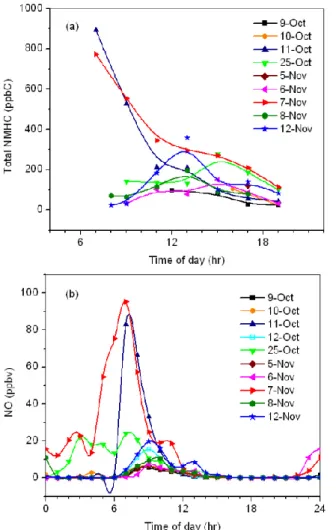
Figure 3 illustrates the diurnal variations of other primary and secondary pollutants at TO on the O3 episode days. There are two aspects of Fig. 3 that bear noting. The first is the generally large concentrations of NO that were encountered; daytime NO concentrations of several ppbv were the norm. Similarly high NO concentrations were also encountered at the other sites. As later discussion and analyses will show, 10
these high NO concentrations directly lead to two important conclusions: (1) HONO concentrations in the early morning hours may be quite high and may significantly enhance O3 production; and (2) photochemical O3 production in the area during the episode days was strongly VOC-limited.
The second feature of note is the anomalously high early morning concentrations of 15
NO and VOCs (as well as CO and aerosol absorption, not shown) on 11 October and 7 November. These high concentrations suggest that TO was subject to an unusually large amount of pollution during the early morning on these two days due to unusual nighttime transport patterns that brought urban emissions to TO.
3.1.3 Transport characteristics of O3episode days 20
One of the key questions to be addressed in this study is the relative roles of local emissions and emissions transported from Guangdong Province in producing O3 pol-lution in Hong Kong. To address this question, we attempted to characterize the degree to which the air masses encountered in Hong Kong on the O3episode days were im-pacted by air transported from Guangdong Province. Each day was assigned one of 25
three possible categories: “L”, indicating that the episode was largely local in character; “L, r”, indicating a local episode with some impact from Guangdong Province; and “R”, indicated an episode with significant impact from Guangdong Province. As described
ACPD
6, 8961–9002, 2006 Ozone production and hydrocarbon reactivity in Hong Kong J. Zhang et al. Title Page Abstract Introduction Conclusions References Tables Figures J I J I Back CloseFull Screen / Esc
Printer-friendly Version Interactive Discussion
below, two independent analyses were carried out to determine the appropriate cate-gory for each day. Only one of the episode days (7 November, the most severe episode) received an “R” categorization; 4 days (10, 11, 12 October, and 8 November) received an “L, r” categorization; and the remaining 5 days received an “L” categorization (Table 1). Thus it would appear that both local and transported pollutants can act indepen-5
dently or in concert to bring about O3 pollution in the Hong Kong area, although the days with the highest Nonmethane Hydrocarbon (NMHC) and NO levels (7 November and 11 October; Fig. 3) were associated with some degree of regional influence.
Chemical Tracers: The ratio of the enhancement of CO over background values to the enhancement of NOy (i.e., dCO/dNOy) in an air mass is a useful diagnostic 10
indicator of the relative influence of pollution from South Mainland China versus Hong Kong (Kok et al., 1997; Wang et al., 2001a, 2003), because the emission ratio of CO-to-NOx from Guangdong and Hong Kong are so different; i.e., ∼15 in Guangdong and ∼1 in Hong Kong (Streets et al., 2003). Therefore high ratios are generally indicative of air masses from Mainland China and low ratios of air masses impacted by local Hong 15
Kong emissions.
In the analysis presented here, dCO/dNOy was calculated from the 1-h averaged CO and NOy measurements recorded at TO and subtracting the background CO and NOy concentrations from the observed concentrations. The background CO and NOy concentrations were estimated in two ways. A “seasonal” dCO/dNOy was calculated 20
using constant background CO and NOy concentrations of 211 and 3.37 ppbv, respec-tively. These concentrations are the mean values observed for marine air advecting over Hong Kong in the fall season (Wang et al., 2001b). A “24 hourly” dCO/dNOywas calculated using the minimum CO and NOyconcentrations observed on that day. The diurnal variation in the two sets of ratios for each O3episode day can be found in Zhang 25
et al. (2004). In summary, 7 November is the only day with consistently high ratios dur-ing the late morndur-ing and early afternoon (consistent with its “R” categorization). 10 October, 11 October, 12 October and 8 November have transient spikes of high ratios and thus have “L, r” categorizations. On the other episode days, the ratios remained
ACPD
6, 8961–9002, 2006 Ozone production and hydrocarbon reactivity in Hong Kong J. Zhang et al. Title Page Abstract Introduction Conclusions References Tables Figures J I J I Back CloseFull Screen / Esc
Printer-friendly Version Interactive Discussion
low throughout the photochemically important period and thus have “L” categorizations. Back trajectories: As an independent check on the results obtained from the dCO/dNOyratios, back trajectories for air masses at TO during each of the O3episode days were calculated. Figure 4 shows the trajectories for 10 October, 7 November, and 12 November illustrating a case of “L, r”, “R”, and “L”, respectively. The back trajec-5
tories were calculated using the NOAA/ARL HYSPLIT4 model (HYbrid Single-Particle Lagrangian Integrated Trajectory model, version 4.6) driven by wind data with a 3-km resolution calculated by NCAR/PSU Mesoscale Meteorological Model (MM5 version 3.6) (Ding et al., 2004). These plots generally corroborate the results from the ratio dCO/dNOy.
10
3.1.4 Distribution and speciation of VOCs during the 7 November episode
To facilitate the analysis of the distribution and speciation of VOCs observed at the various sites during the 7 November O3 pollution episode, we have grouped the 40+ species measured at each site into three major types: CO, anthropogenic hydrocar-bons (AHC), and biogenic hydrocarhydrocar-bons (BHC), with BHC defined as isoprene and 15
the pinenes. AHC are further divided into five sub-types according to their structure and reactivity with the OH radical in the atmosphere: reactive aromatics (R-AROM) encompassing all aromatics except benzene; reactive olefins (R-OLE), comprising all olefins except ethylene; alkanes with four or more carbons (>=C4); ethylene (ETH); and the low reactivity hydrocarbons (LRHC) which include methane, ethane, propane, 20
acetylene and benzene.
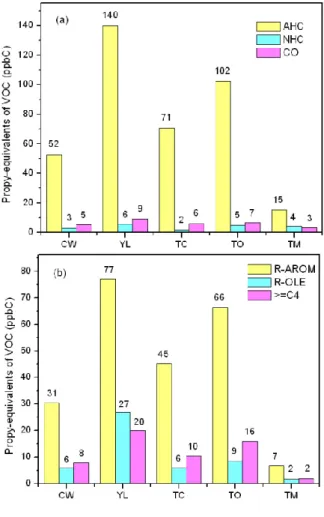
Based on the 24-h averaged concentrations of the major VOC groups and AHC sub-groups measured at the five sites on 7 November, AHC clearly dominates over BHC at all sites (Fig. 5). Note in the figure that methane is not included in AHC since its ex-tremely low reactivity though its high concentration. The AHC levels occur in the order 25
YL>TO>TC>CW>>TM. Although TC and TO are downwind of CW and YL, the AHC levels at these two sites are higher than at CW, and the AHC level at TO is comparable to that at YL. This suggests that there must be some other significant source of VOCs
ACPD
6, 8961–9002, 2006 Ozone production and hydrocarbon reactivity in Hong Kong J. Zhang et al. Title Page Abstract Introduction Conclusions References Tables Figures J I J I Back CloseFull Screen / Esc
Printer-friendly Version Interactive Discussion
at TC and TO other than simply transport from the urban/industrial areas surrounding CW/YL. Within the AHC group, R-AROM is the dominant subgroup, which in turn is richest in xylenes and toluene, and to a lesser extent tri-methylbenzenes and ethyl-benzene. As was the case with AHC, R-AROM is highest at YL and TO followed by TC, CW and TM. The ETH levels (not shown in Fig. 5) occur in the same order as the 5
AHC levels, but only contribute about 3% of the AHC concentrations.
3.1.5 VOC reactivity
Not all VOCs react at the same rate. In general the rate of reactivity among VOCs can vary as much as or even more than the concentrations of the VOCs in the atmosphere. To take both the concentration (on a C atom basis) and OH-reactivity of each VOC into 10
account, we use a reactivity scale called propy-equivalents (Chameides et al., 1992). Ci(propy−equiv)=Ci(observed) ∗ [kOH(i )/kOH(C3H6)] (1)
where Ci (propy-equiv) propy-equivalents (ppbC) of any VOC species i , Ci (observed) observed concentration (ppbC) of species i ,
kOH(i ) reaction rate coefficient (molec/cm3/s) of species i withradical OH, and
kOH(C3H6) reaction rate coefficient (molec/cm3/s) of C3H6with radical OH. In this formulation, the concentration (weighted by the number of carbons) of each VOC species is re-normalized by a factor that is proportional to its reactivity with OH. 15
The resulting reactivity is referred to as propy-equivalents because the normalization factor used is the rate constant for propylene with OH. The choice of propylene is arbitrary and another normalization factor could be used with the same results.
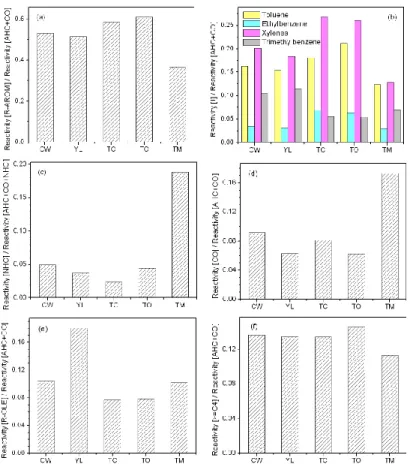
Distribution of Reactivities on 7 November: Figs. 6a–b shows the propy-equivalents of different VOC groups at the five sites on 7 November, and Figs. 7a–f shows the 20
relative contributions of the major VOC groups to the total reactivity. In general the reactivity analyses reinforce the conclusions reached earlier on the basis of the VOC
ACPD
6, 8961–9002, 2006 Ozone production and hydrocarbon reactivity in Hong Kong J. Zhang et al. Title Page Abstract Introduction Conclusions References Tables Figures J I J I Back CloseFull Screen / Esc
Printer-friendly Version Interactive Discussion
concentrations; i.e., AHC dominated over BHC, and R-AROM was the most impor-tant AHC subgroup. However, there are a number of additional insights that can be garnered from the propy-equivalents analysis. For example, even though the CO con-centrations were greater than the total VOC concon-centrations at all sites (Fig. 5a), the total AHC reactivity was greater than that of CO at all sites (Fig. 6a). This suggests 5
that AHC played a greater role in generating local O3than CO though CO might have an impact on O3 formation on a regional scale because of its longer lifetime. Among the AHCs, R-AROM contributed most to the total anthropogenic reactivity at all sites, accounting for over 50% at CW, YL, TC and TO and close to 40% at TM (Figure 7a). Of the species included in the R-AROM group the xylenes dominated, accounting for 10
over 25% of the total reactivity of anthropogenic VOCs (including CO) at TC and TO and over 18% of that at CW and YL. Toluene follows the xylenes in the R-AROM group (Fig. 7b). At YL, R-OLE also made a significant contribution to the total reactivity from anthropogenic compounds (about 18%, Fig. 7e). At CW, YL, TC, and TO, the contri-butions from >=C4 were also high (about 14%, Fig. 7f). ETH and LRHC contributed 15
much less to the total anthropogenic reactivity, with ETH contributed only 2–3% and LRHC 2–4% (not shown).
The results from TM are interesting because even though TM is a rural site, the influence of anthropogenic compounds appears to have been significant. While the contribution of BHC to the total anthropogenic reactivity was highest at TM (about 19%, 20
Fig. 7c), AHC (Figure 7a) and CO (Fig. 7d) still dominated. The fraction of CO reactivity to the total anthropogenic reactivity was highest at TM; i.e. ∼17% as compared to about 6–9% at other four sites. This might be due to the fact that CO has a much longer lifetime than most VOCs. As more reactive VOCs are consumed by photochemistry, the relative importance of CO will tend to rise. Since TM is a rural site, one might 25
expect CO would account for a higher fraction than at other sites. On the other hand, the contribution from R-OLE was relatively high at TM (about 10%, Fig. 7e), and given the relative short lifetimes of R-OLE, this would appear to suggest that TM was directly influenced by local anthropogenic emissions.
ACPD
6, 8961–9002, 2006 Ozone production and hydrocarbon reactivity in Hong Kong J. Zhang et al. Title Page Abstract Introduction Conclusions References Tables Figures J I J I Back CloseFull Screen / Esc
Printer-friendly Version Interactive Discussion
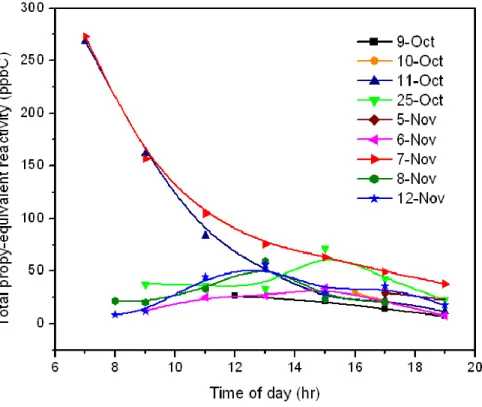
Reactivity at Tai O: Fig. 8 shows the total propy-equivalent reactivity at Tai O on all episode days with VOC data. 11 October and 7 November are similar in that the early morning total propy-equivalent reactivity is much higher than that observed later during the day. As the morning progresses, however, the total propy-equivalent reactivity decreases rapidly and by noon the total reactivity on these two days was close to that 5
on other episode days. As noted earlier, the anomalous behavior on 11 October and 7 November may reflect the presence of unusual meteorological conditions that caused the early-morning accumulation of pollutants at the TO site. Similar to the situation for 7 November, AHC dominated the total reactivity on all the episode days, and R-AROM was the most important subgroup of AHC (not shown).
10
3.2 Ozone production and relative incremental reactivity
In this section we present the results of our application of the Observation Based Model (OBM, Cardelino and Chameides, 1995) to the data collected at each of the five sites on the 7 November episode and at TO on all episode days. We begin with a brief overview of the OBM.
15
3.2.1 Introduction to OBM
The OBM uses the concentrations of primary hydrocarbons, NO, CO and O3, as well as meteorological data measured as a function of time at a given location as input for a coupled set of photochemical box models that calculates the total amount of ozone that is photochemically produced during the daytime at that location based on Carbon-20
Bond IV mechanism (Cardelino and Chameides, 1995). The model also calculates the sensitivity of the O3 production to changes in the concentrations of the precursor compounds, i.e. Relative Incremental Reactivity (RIR). Since the production of O3 is related to the concentration of O3 at the site, and the concentration of a precursor is essentially linearly related to its emissions, RIR can be used to assess a given emission 25
reduction on O3concentrations at a site without detailed knowledge of the emissions. 8975
ACPD
6, 8961–9002, 2006 Ozone production and hydrocarbon reactivity in Hong Kong J. Zhang et al. Title Page Abstract Introduction Conclusions References Tables Figures J I J I Back CloseFull Screen / Esc
Printer-friendly Version Interactive Discussion
Internal tests can be carried out to confirm that the application of the OBM to a given dataset is appropriate. One test is to assess the consistency of the RIRs across multiple sites and/or multiple days. For example, if the standard error of the mean for the area-averaged RIRs defined in the OBM is relatively small, the calculated RIRs are more likely to be robust. Another test is to consider the magnitude of the ozone 5
production calculated by the OBM at each site and compare it to the increment of O3 observed at the site during the episode. If the calculated O3 production is similar in magnitude to the observed increment, it suggests that the RIR explains a significant portion of the amount of O3that appeared at the site and is therefore relevant to policy-making decisions with regard to emission control strategies. As noted earlier, because 10
the OBM uses observed concentrations, it is an observation-based as opposed to an emission-based model. It complements emission-based models as part of a weight-of-evidence approach to air quality control.
3.2.2 Deduction of hourly VOC profiles
Since the VOC data at the four EPD sites are 24-h averages, it was necessary to derive 15
time-dependent concentrations from these averages for use in the OBM. The method for accomplishing this is based on the entraining Eulerian box model (Seinfeld and Pandis, 1997). Assuming the atmosphere in the area of interest is well-mixed, the con-centration of a species is determined by its emissions, chemical reactions, deposition (dry/wet), advection, and vertical entrainment. Equations 2a-b give the resulting rate 20
of change with time in the concentration of species i :
d ci d t = qi H(t) + Ri − vd ,i H(t)ci + c0i − ci τr for d H d t ≤ 0 (2a) d ci d t = qi H(t) + Ri − vd ,i H(t)ci + c0i − ci τr + cai − ci H(t) d H d t for d H d t > 0 (2b) 8976
ACPD
6, 8961–9002, 2006 Ozone production and hydrocarbon reactivity in Hong Kong J. Zhang et al. Title Page Abstract Introduction Conclusions References Tables Figures J I J I Back CloseFull Screen / Esc
Printer-friendly Version Interactive Discussion
where ci concentration (mol m−3) of species i ,
qi emission rate (mol m−2s−1) of species i per unit area,
H(t) mixing height (m) as a function of time t,
Ri chemical production/destruction rate (mol m−3s−1) of species i ,
vd ,i dry/wet deposition rate (m s−1) of species i (assumed to be zero for all the hydrocarbons),
c0i background concentration (mol m−3) of species i ,
τr residence time (s) of air over the area (which is the ratio of the length of the box to the prevailing wind speed), and
cai concentration (mol m−3) of species i above the boundary layer (assumed . to be zero for all the hydrocarbons)
For our purposes, the advection term (c0i−ci)/τr in Eqs. (2a–b) is combined with the emission term qi/H(t). Equations (2a–b) are solved using Gear’s backward differentiation formula (e.g., see Jacobson, 1999).
Since emission rates for the different VOCs and their chemical destruction rates are 5
unknown (in the latter case because OH is unknown), we adopt an iterative approach to determine the hourly variations in the VOC species, along with their emission and destruction rates on the basis of their 24-h averaged concentrations and other inputs. We begin by assuming an initial OH profile and an emission rate for the VOCs, then calculate the time variation in the VOC species. The resulting 24-h averaged VOC 10
concentrations thus calculated are compared to the observed 24-h average concen-trations, and the emission rates are appropriately scaled to bring the calculated 24-h averages in line with the observed averages. A new OH profile is calculated on the basis of the VOC concentrations, and the process is repeated until convergence is ob-tained. In the results presented a 2% agreement is used as the basis for establishing 15
consistency.
In addition to calculating the diurnal VOC profiles, this approach is also used to calculate the diurnal profiles in HONO, formaldehyde and higher aldehydes – species
ACPD
6, 8961–9002, 2006 Ozone production and hydrocarbon reactivity in Hong Kong J. Zhang et al. Title Page Abstract Introduction Conclusions References Tables Figures J I J I Back CloseFull Screen / Esc
Printer-friendly Version Interactive Discussion
that were not observed during the field campaign but can impact the OBM results. These calculations and their implications are discussed in Sect. 3.2.3.
Emission Rates: The annual emissions of speciated anthropogenic VOCs from the NASA TRACE-P project (Streets et al., 2003) were used to set the initial VOC emis-sion rates of the VOCs. The diurnal variations in the anthropogenic VOC emisemis-sions 5
were estimated on the basis of the source type: industry and power generation were assumed to have no diurnal variation; domestic sources were kept constant during the daytime and set to 0 at night (9 p.m.–5 a.m.); and mobile emissions were assigned a diurnal variation that differed as a function of day of the week (Cardelino, 1998). The diurnal variations of biogenic VOCs (isoprene, α-pinene and β-pinene) were estimated 10
considering the temperature and solar radiation.
Mixing height profile: The mixing height was estimated based on the principle that heat transferred from the surface to the atmosphere results in convection, vigorous ver-tical mixing, and establishment of a dry-adiabatic lapse rate (Holzworth, 1967). Here upper air soundings and hourly temperature were used to compute morning and after-15
noon mixing heights. The upper air soundings are reported by National Climate Data Center (NCDC) and available at the NOAA website (http://raob.fsl.noaa.gov/). We fol-lowed the approach of Holzworth (1967) with the exception that 2◦C instead of 5◦C was used to account for the temperature difference between rural and urban environments and for some initial surface heating just after sunrise while calculating the morning 20
mixing height, since Hong Kong has a latitude of 22.32◦N and the daily temperature difference between different areas is probably not as much as that at mid-latitudes. The hourly mixing height profiles were obtained by interpolating between the morning and afternoon mixing heights, considering that the mixing height increases rapidly after sunrise and slowly in early afternoon until it reaches the afternoon mixing height. 25
The diurnal variations in the total VOC reactivity at the 4 EPD sites on 7 November were therefore derived through the above method. Encouraging similarity is found between the calculated profile at YL and the observed profile at TO (two sites with similar average reactivities), and the inferred VOC diurnal profiles are utilized for OBM
ACPD
6, 8961–9002, 2006 Ozone production and hydrocarbon reactivity in Hong Kong J. Zhang et al. Title Page Abstract Introduction Conclusions References Tables Figures J I J I Back CloseFull Screen / Esc
Printer-friendly Version Interactive Discussion
calculations presented below.
3.2.3 OBM-calculated net O3production
In principle, the O3 that appears at a given site during a pollution episode is due to local photochemical production plus the transport of O3 that has been produced else-where. However, the OBM only calculates the O3produced locally and/or in air masses 5
with similar chemical compositions as that found locally. As a result the RIR functions calculated by the OBM only pertain to the O3 produced locally; i.e., they represent estimates of the sensitivity of the O3 produced locally to changes in precursor con-centration/emissions, and not of the O3 that had been transported to the site. If local production represents a significant portion of the total O3 increase (or increment) ex-10
perienced in the area, then this feature of the OBM does not represent a significant limitation. On the other hand, if local production is much smaller than the O3 incre-ment, then the RIR functions calculated by the OBM are of limited utility. In this section we examine this issue by comparing the net photochemical production O3 calculated by the OBM at each site with the actual O3increment observed at each site over the 15
course of the episode day.
Figures 9a–b illustrates the model-calculated net O3 production and the observed O3 increment at each of the sites on 7 November and at TO for all episode days, with and without early morning HONO and aldehydes (see below). In general the O3 increment calculated by the OBM agreed well with observations at all sites on 7 20
November, with the exception of TC (Fig. 9a). At TO, the agreement between the OBM and observations ranged from excellent during the 11 October and 7 November episodes to much poorer during the 6 and 12 November episodes (Fig. 9b). Generally between 50–100% of the O3increase observed in Hong Kong during the O3episodes can be explained by photochemical generation within the Hong Kong area. When 25
HONO and aldehydes were omitted from the OBM the agreement with observations significantly deteriorated (Figs. 9a–b). These latter results suggest that early morning HONO and aldehydes concentrations were significant (as estimated by the OBM), and
ACPD
6, 8961–9002, 2006 Ozone production and hydrocarbon reactivity in Hong Kong J. Zhang et al. Title Page Abstract Introduction Conclusions References Tables Figures J I J I Back CloseFull Screen / Esc
Printer-friendly Version Interactive Discussion
as a result of the OH produced by these compounds in the early morning, the OBM was able to account for much/most of the ozone increments observed during episode days when HONO and aldehydes were included. Exceptions to the latter conclusion are TC on 7 November and TO on 9 October, 6 November, and 12 November when the calculated O3 production was significantly less than the observed increment even 5
with early morning HONO and aldehydes included.
The role of HONO and aldehydes in early morning chemistry: Previous investigators have found that the presence of HONO and/or aldehydes in the urban atmosphere in the early morning hours can significantly enhance the amount of O3 produced over the course of the day (Jenkin et al., 1988; Alicke et al., 2002, 2003; Hu et al., 2002; 10
Finlayson-Pitts et al., 2003). HONO and aldehydes are fairly reactive and as a result their concentrations are usually fairly small during most of the daylight hours. However, at night, in the absence of sunlight and OH, their concentrations can accumulate if sufficient sources of these compounds are present. Then, in the early morning when the sun first appears, they can be rapidly photolyzed; one product of this photolysis is 15
OH. Because other sources of OH (e.g., O3 photolysis) tend to be small in the early morning, HONO and aldehyde photolysis can represent a significant early-morning source of OH, and this source can jump-start the photochemical reactions that lead to O3production. The net result is more O3production over the entire course of the day.
HONO and aldehydes were not measured during the field campaign and thus could 20
not be specified in the OBM. We therefore carried out two sets of OBM calculations: in the calculations labeled “OBM w/o HONO and ALD” we assumed that no HONO, H2CO,and higher aldehydes were present in the morning; in the standard OBM calcu-lations we allowed the OBM to estimate the early morning HONO, H2CO, and aldehyde concentrations using the iterative process described in Sect. 3.2.2. In these calcula-25
tions, we assumed that HONO was produced at night via a heterogeneous reaction involving NOx:
2NO2+ H2Osurface−→ HONO+ HNO3 (3)
ACPD
6, 8961–9002, 2006 Ozone production and hydrocarbon reactivity in Hong Kong J. Zhang et al. Title Page Abstract Introduction Conclusions References Tables Figures J I J I Back CloseFull Screen / Esc
Printer-friendly Version Interactive Discussion
We further assumed a mixing height dependent rate constant following Harrison et al. (1996):
Rate Constant for HONO Production= 3.36 × 10
−2
MixingHeight(m)(min
−1) (4)
Nighttime losses of HONO include dry deposition (with a rate constant of 1.2/mixing height (m) in units of min−1).
5
The resulting diurnal variations in HONO, formaldehyde and higher aldehydes cal-culated by the OBM at TO on 7 November are shown in Fig. 10a. Note the high HONO concentrations (of ∼10 ppbv) just before sunrise. As the sun comes out, however, HONO starts to photolyze and its concentration rapidly drops to sub-ppbv levels. How-ever, as illustrated in Fig. 10b, the photolysis of HONO in the early morning represents 10
a major source of OH in the OBM calculations, and, as a result, early morning OH concentrations are significantly enhanced (Fig. 10c). Inspection of the figures reveals that although the concentrations of formaldehyde and higher aldehydes are higher than HONO, their impact on OH production is relatively small. In addition, after ∼11:00 LT, HONO concentrations have fallen sufficiently and O3photolysis takes over as the dom-15
inant source of OH.
Similar results are achieved at CW, YL, and TC on 7 November (not shown), suggest-ing that HONO played an important role in the early mornsuggest-ing chemistry provided that HONO was present at the concentrations derived from the OBM calculations. Early-morning HONO concentrations of ∼10 ppbv in the Hong Kong area do not seem un-20
reasonable given that Hu et al. (2002) observed peak early-morning HONO levels ap-proaching 12 ppbv in nearby Guangzhou in June 2000. Nevertheless, because HONO was not measured during the field campaign, future field experiments will be needed to determine whether the OBM-based predictions of high HONO concentrations in the early morning in Hong Kong area and the resultant enhancement in early morning OH 25
production rates are appropriate.
ACPD
6, 8961–9002, 2006 Ozone production and hydrocarbon reactivity in Hong Kong J. Zhang et al. Title Page Abstract Introduction Conclusions References Tables Figures J I J I Back CloseFull Screen / Esc
Printer-friendly Version Interactive Discussion
3.2.4 Relative incremental reactivity
RIRs on 7 November: Figs. 11a–b shows the calculated RIRs for AHC, BHC, CO, NOx, and each AHC subgroup at each site on 7 November, and Figs. 12a–b shows the area-averaged RIRs for each precursor group and subgroup. The AHC group shows by far the highest RIR, meaning that AHC is the most important group in producing O3. 5
BHC has a significant RIR at TM, the most rural site, but even here AHC has a much larger RIR. Not surprisingly (in light of the reactivity analysis presented in Sect. 3.1.5) R-AROM has the largest RIR among the AHC sub-groups.
The RIR for NOx is negative at all sites except TO where it is essentially zero (Fig. 11a), and the area-averaged RIR for NOx is also negative (Fig. 12a). This nega-10
tive RIR for NOxis the result of the relatively high NO concentrations that were typically encountered at the sites during the field campaign. The results suggest that O3 pho-tochemistry is strongly VOC-limited throughout the Hong Kong area, and that initial reductions in NOxemissions in the area would actually lead to local O3enhancements. Finally it should be noted that the standard error σ of the means in the area-averaged 15
RIRs tend to be relatively small when compared to the RIRs themselves (Fig. 12). This suggests that, at least from a statistical point of view, the RIR functions calculated here are robust.
RIRs at TO: The calculated RIRs for the major O3 precursor groups at TO on the episode days with VOC data generally confirm the results obtained from the other sites 20
for the 7 November episode. AHC is the dominant precursor group with largest RIRs, and, among the AHCs, R-AROM dominate (not shown). On all days except 9 October the RIR for NOx was negative, and thus NOx tended to suppress O3 production on most of the episode days. The anomalous result for 9 October can be attributed to the fact that the NO concentrations were significantly lower than on other episode days; 25
the maximum NO concentration on 9 October was only 5.5 ppbv, compared to maxima of 7.6–95.4 ppbv on other days (Fig. 1).
Sensitivity of RIRs to model uncertainties and model inputs: There are a large
ACPD
6, 8961–9002, 2006 Ozone production and hydrocarbon reactivity in Hong Kong J. Zhang et al. Title Page Abstract Introduction Conclusions References Tables Figures J I J I Back CloseFull Screen / Esc
Printer-friendly Version Interactive Discussion
ber of input parameters and model formulations in the OBM that are uncertain and add uncertainty to the RIR-functions calculated by the OBM. However, we have carried out a wide variety of sensitivity studies where we allowed input parameters and formula-tions to vary over reasonable ranges. In all cases, the major results were essentially the same. For example, we compared the RIRs obtained with the standard version 5
of the OBM using diurnal profiles for VOC species (Sect. 3.2.2) with OBM results ob-tained with constant VOC concentrations as a function of time of day. While differences between the two calculations were obtained, the essential results are the same; i.e., the RIRs for AHC are large and positive and the RIRs for NOxare negative at the four EPD sites and small at TO.
10
We also examined the sensitivity of the OBM results to the methods used to calcu-late both the inputs into the OBM and the RIR functions. In the standard model, the hourly-averaged concentrations input into the model are arithmetic means of the high-resolution data collected at the sites. The RIRs were calculated from the difference in the net O3 production for the observed concentrations and for a –10% of change in a 15
precursor’s concentrations. Here again, the essential results of the OBM calculations were unchanged.
Applicability of the autumn results: The findings that the O3 photochemistry in the Hong Kong area is strongly VOC-limited and dominated by anthropogenic VOCs, es-pecially reactive aromatics, are robustly supported by data that were gathered during 20
one autumn. A comparison with the results from a similar analysis of summer episodes observed at Tai O and at an inland PRD site (Wan Qing Sha) suggests that these con-clusions generally hold for inland PRD sites during a majority of summer episodes, although natural HCs could play an important role during summer at Tai O (So and Wang, manuscript in preparation). Undoubtedly, analysis of data from other areas in 25
the PRD would provide more insights into O3photochemistry for the whole PRD region.
ACPD
6, 8961–9002, 2006 Ozone production and hydrocarbon reactivity in Hong Kong J. Zhang et al. Title Page Abstract Introduction Conclusions References Tables Figures J I J I Back CloseFull Screen / Esc
Printer-friendly Version Interactive Discussion
4 Conclusions
Various observation-based approaches were used to analyze the relationships be-tween ozone, ozone precursors, and cross-border transport during ozone episodes observed in the Hong Kong area.
Local emissions from Hong Kong as well as emissions from Guangdong Province 5
appear to act in concert or individually in fostering O3pollution episodes in Hong Kong. Between 50–100% of the O3 increase observed in Hong Kong during O3-pollution episodes can be explained by photochemical generation within the Hong Kong area. In addition, HONO (and to a lesser extent aldehydes) was calculated to play a critical role in local O3generation, provided that HONO was present at the concentrations derived 10
from OBM calculations.
The reactivity of the VOCs is dominated by anthropogenic VOCs, with VOCs from natural or biogenic sources making a minor contribution during fall, when this field study was conducted. Of the anthropogenic VOCs, reactive aromatics dominate, of which xylenes and toluene are the most important.
15
The formation of O3 throughout much of the Hong Kong area is limited by VOCs, and high NO concentrations suppress O3production in much of the Hong Kong area. Ozone sensitivity to VOCs is dominated by the contribution from reactive aromatics.
Further studies are needed to confirm and quantify the role of HONO in early morn-ing chemistry. While a preliminary comparison with the results obtained durmorn-ing summer 20
both in Hong Kong and at a PRD inland site suggests that the conclusions obtained in the present study generally hold, analysis of data collected from more areas in the PRD would be valuable to characterize additional areas of significant O3pollution and to determine the relative roles of anthropogenic and natural VOCs and the VOC- versus NOx-limitations of the O3photochemistry.
25
Acknowledgements. This work was funded by Hong Kong Jockey Club Charities Trust, Castle
Peak Power Co. Ltd., the Environmental Protection Department of the Hong Kong Special Administrative Region, and Shell Hong Kong Ltd., through Civic Exchange. Additional support
ACPD
6, 8961–9002, 2006 Ozone production and hydrocarbon reactivity in Hong Kong J. Zhang et al. Title Page Abstract Introduction Conclusions References Tables Figures J I J I Back CloseFull Screen / Esc
Printer-friendly Version Interactive Discussion
to the PolyU team was provided by the Research Grants Council of the Hong Kong Special Administrative Region (Project No. PolyU 5144/04E). We thank C. Loh and C. S. Kiang for coordinating the Pilot Study Project, K. Ubergang for providing various supports to the project team, S. Poon for contributing to field measurements at Tai O, and I. Simpson for giving helpful comments on this manuscript . MM5 and HYSPLIT models were made available by NCAR and
5
NOAA Air Resources Laboratory (ARL), respectively.
References
Alicke, B., Platt, U., and Stutz, J.: Impact of nitrous acid photolysis on the total hydroxyl radical budget during the Limitation of Oxidant Production/Pianura Padana Produzione di Ozono study in Milan, J. Geophys. Res., 107(D22), 8196, doi:10.1029/2000JD000075, 2002.
10
Alicke, B., Geyer, A., Hofzumahaus, A., Holland, F., Konrad, S., Patz, H. W., Schafer, J., Stutz, J., Volz-Thomas, A., and Platt, U.: OH formation by HONO photolysis during the BERLIOZ experiment, J. Geophys. Res., 108(D4), 8247, doi:10.1029/2001JD000579, 2003.
Blanchard, C. L., Lurmann, F. W., Roth, P. M., Jeffries, H. E., and Korc, M.: The use of ambient data to corroborate analyses of ozone control strategies, Atmos. Environ., 33, 369–381,
15
1999.
Calvert, J. G.: Test of the theory of ozone generation in Los Angeles atmosphere, Environ. Sci. Technol., 10, 248–262, 1976.
Cardelino, C.: Daily variability of motor vehicle emissions derived from traffic counter data, J. Air Waste Manage. Assoc., 48, 637–645, 1998.
20
Cardelino, C. and Chameides, W. L.: An observation-based model for analyzing ozone pre-cursor relationships in the urban atmosphere, J. Air Waste Manage. Assoc., 45, 161–180, 1995.
Cardelino, C. and Chameides, W. L.: The application of data from photochemical assessment monitoring stations to the observation-based model, Atmos. Environ., 34, 2325–2332, 2000.
25
CH2M HILL (China) Limited: Final report: agreement No. CE 106/98: Study of Air Quality in the Pearl River Delta Region, April 2002.
Chameides, W. L., Davis, D. D., Bradshaw, J., Sandholm, S., Rodgers, M., Baum, B., Ridley, B., Madronich, S., Carroll, M. A., Gregory, G., Schiff, H. I., Hastie, D. R., Torres, A., and Condon, E.: Observed and model-calculated NO2:NO ratios in tropospheric air sampled during the
30
NASA GTE/CITE 2 field study, J. Geophys. Res., 95, 10 235–10 247, 1990.
ACPD
6, 8961–9002, 2006 Ozone production and hydrocarbon reactivity in Hong Kong J. Zhang et al. Title Page Abstract Introduction Conclusions References Tables Figures J I J I Back CloseFull Screen / Esc
Printer-friendly Version Interactive Discussion
Chameides, W. L., Fehsenfeld, F., Rodgers, M. O., Cardelino, C., Martinez, J., Parrish, J. D., Lonneman, W., Lawson, D. R., Rasmussen, R. A., Zimmerman, P., Greenberg, J., Middleton, P., and Wang, T.: Ozone precursor relationships in the ambient atmosphere, J. Geophys. Res., 97, 6037–6055, 1992.
Cheung, H. C., Wang, T., Baumann, K., and Guo, H.: Influence of regional pollution outflow
5
on the concentrations of fine particulate matter and visibility in the coastal area of southern China, Atmos. Environ., 39, 6463–6474, 2005.
Colman, J. J., Swanson, A. L., Meinardi, S., Sive, B. C., Blake, D. R., and Rowland, F. S.: De-scription of the analysis of a wide range of volatile organic compounds in whole air samples collected during PEM-Tropics A and B, Anal. Chem., 73, 3723–3731, 2001.
10
Ding, A., Wang, T., Zhao, M., Wang, T. J., and Li, Z. K.: Simulation of sea-land breezes and a discussion of their implications on the transport of air pollution during a multi-day ozone episode in the Pearl River Delta of China, Atmos. Environ., 38, 6737–6750, 2004.
Finlayson-Pitts, B. J., Wingen, L. M., Sumner, A. L., Syomin, D., and Ramazan, K. A.: The het-erogeneous hydrolysis of NO2in laboratory systems and in outdoor and indoor atmospheres:
15
An integrated mechanism, Phys. Chem. Chem. Phys., 5, 223–242, 2003.
Geron, C. D., Guenther, A. B., and Pierce, T. E.: An improved model for estimating emissions of volatile organic compounds from forests in the eastern United States, J. Geophys. Res., 99, 12 773–12 791, 1994.
Guenther, A., Geron, C., Pierce, T., Lamb, B., Harley, P., and Fall, R.: Natural emissions of
20
non-methane volatile organic compounds, carbon monoxide , and oxides of nitrogen from North America, Atmos. Environ., 34, 2205–2230, 2000.
Hanna, S. R., Moore, G. E., and Fernau, M. E.: Evaluation of photochemical grid models (UAM-IV, UAM-V, and the ROM/UAM-IV couple) using data from the Lake Michigan Ozone Study (LMOS), Atmos. Environ., 30, 3265–3279, 1996.
25
Harrison, R. M., Peak, J. D., and Collins, G. M.: Tropospheric cycle of nitrous acid, J. Geophys. Res., 101, 14 429–14 439, 1996.
Hidy, G.: Ozone process insights from field experiments—Part I. NARSTO Critical Review Papers Special Issue, Atmos. Environ., 34, 2001–2022, 2000.
Holzworth, G. C.: Mixing depths, wind speeds and air pollution potential for selected locations
30
in the United States, J. Appl. Meteorol., 6, 1039–1044, 1967.
Hu, M., Zhou, F., Shao, K., Zhang, Y., Tang, X., and Slanina, J.: Diurnal variations of aerosol chemical compositions and related gaseous pollutants in Beijing and Guangzhou, J. Environ.
ACPD
6, 8961–9002, 2006 Ozone production and hydrocarbon reactivity in Hong Kong J. Zhang et al. Title Page Abstract Introduction Conclusions References Tables Figures J I J I Back CloseFull Screen / Esc
Printer-friendly Version Interactive Discussion
Sci. Heal. A, A37(4), 479–488, 2002.
Jacobson, M. Z.: Fundamentals of Atmospheric Modeling, Cambridge University Press, 385– 393, 1999.
Jenkin, M. I., Cox, R. A., and Williams, D. J.: Laboratory studies of the kinetics of formation of nitrous acid from the thermal reaction of nitrogen dioxide and water vapor, Atmos. Environ.,
5
22, 487–498, 1988.
Kok, G. L., Lind, J. A., and Fang, M.: An airborne study of air quality around the Hong Kong Territory, J. Geophys. Res., 102, 19 043–19 057, 1997.
Kuklin, A. and Seinfeld, J. H.: Emissions reductions needed to meet the standard for ozone in Southern California: effect of boundary conditions, J. Air Waste Manage. Assoc., 45, 899–
10
901, 1995.
Kumar, N. and Russell, A. G.: Comparing prognostic and diagnostic meteorological fields and their impacts on photochemical air quality modeling, Atmos. Environ., 30, 1989–2010, 1996. McKeen, S. A., Mount, G., Eisele, F., Williams, E., Harder, J., Coldan, P., Kuster, W., Liu, S. C., Baumann, K., Tanner, D., Fried, A., Sewell, S., Cantrell, C., and Shetter, R.:
Photochem-15
ical modeling of hydroxyl and its relationship to other species during the Tropospheric OH Photochemistry Experiment, J. Geophys. Res., 96, 6467–6493., 1997.
National Academy of Sciences (NAS): Rethinking the ozone problem in urban and regional air pollution, Natl. Acad. Press, Washington, D. C, 1991.
Oreske, N., Shrader-Frechette, K., and Belitz, K.: Verification, validation, and confirmation of
20
numerical models in the Earth sciences, Science, 263, 641–646, 1994.
Parrish, D. D., Trainer, M., Williams, E. J., Fahey, D. W., Hubler, G., Eubank, C. S., Liu, S. C., Murphy, P. C., Albritton, D. L., and Fehsenfeld, F. C.: Measurements of the NO-O3 photosta-tionary state at Niwot Ridge, Colorado, J. Geophys. Res., 91, 5361–5370, 1986.
Pierson, W. R., Gertler, A. W., and Bradow R. L.: Comparison of the SCAQS tunnel study with
25
other on-road vehicle emission data, J. Air Waste Manage. Assoc., 40, 1495–1504, 1990. Russell, A. G. and Dennis, R. L.: Critical review of photochemical models and modeling.
NARSTO Critical Review Papers Special Issue, Atmos. Environ., 34, 2283–2324, 2000. Seinfeld, J. H. and Pandis, S. N.: Atmospheric Chemistry and Physics: From Air Pollution to
Climate Change, John Wiley & Sons, Inc., New York, 1997.
30
Sillman, S.: The use of NOy, H2O2and HNO3as indicators for O3-NOx-ROG sensitivity in urban locations, J. Geophys. Res., 100, 14 175–14 188, 1995.
Sillman, S., He, D., Cardelino, C., and Imhoff, R. E.: The use of photochemical indicators to
ACPD
6, 8961–9002, 2006 Ozone production and hydrocarbon reactivity in Hong Kong J. Zhang et al. Title Page Abstract Introduction Conclusions References Tables Figures J I J I Back CloseFull Screen / Esc
Printer-friendly Version Interactive Discussion
evaluate ozone-NOx-hydrocarbon sensitivity: Case studies from Atlanta, New York and Los Angeles, J. Air Waste Manage. Assoc., 47, 642–652, 1997.
Simpson, D.: Biogenic emissions in Europe, 2, implications for ozone control strategies, J. Geophys. Res., 100, 22 891–22 906, 1995.
Simpson, I. J., Wang, T., Guo, H., Kwok, Y. H., Flocke, F., Atlas, E., Meinardi, S., Rowland, F.
5
S., and Blake, D. R.: Long-term atmospheric measurements of C1–C5 alkyl nitrates in the Pearl River Delta region of southeast China, Atmos. Environ., 40, 1619–1632, 2006.
Streets, D. G., Bond, T. C., Carmichael, G. R., Fernandes, S. D., Fu, Q., He, D., Klimont, Z., Nel-son, S. M., Tsai, N. Y., Wang, M. Q., Woo, J.-H., and Yarber, K. F.: An inventory of gaseous and primary aerosol emissions in Asia in the year 2000, J. Geophys. Res., 108(D21), 8809,
10
doi:10.1029/2002JD003093, 2003.
Tan, Q., Chameides, W. L., Streets, D., Wang, T., Xu, J., Bergin, M., and Woo, J.: An eval-uation of TRACE-P emission inventories from China using a regional model and chemical measurements, J. Geophys. Res., 109(D22), D22305, doi:10.1029/2004JD 005071, 2004. Wang, T.: Study of visibility reduction and its causes in Hong Kong, Final report to the
Environ-15
mental Protection Department, Hong Kong Special Administrative Region, 2003.
Wang, T., Wu, Y. Y., Cheung, T. F., and Lam, K. S.: A study of surface ozone and the relation to complex wind flow in Hong Kong, Atmos. Environ., 35, 3203–3215, 2001a.
Wang, T., Cheung, V. T. F., Lam, K. S., Kok, G. L., and Harris, J. M.: The characteristics of ozone and related compounds in the boundary layer of the South China coast: temporal and
20
vertical variations during autumn season, Atmos. Environ., 35, 2735–2746, 2001b.
Wang, T. and Kwok, Y. H. J.: Measurement and analysis of a multi-day photochemical smog episode in Pearl River Delta of China, J. Appl. Meteorol., 42, 404–416, 2003.
Wang, T., Poon, C. N., Kwok, Y. H., and Li, Y. S.: Characterizing the temporal variability and emission pattern of pollution plumes in the Pearl River Delta of China, Atmos. Environ., 37,
25
3539–3550, 2003.
Wang, T., Guo, H., Blake, D. R., Kwok, Y. H., Simpson, I. J., and Li, Y. S.: Measurements of Trace Gases in the Inflow of South China Sea Background Air and Outflow of Regional Pollution at Tai O, Southern China, J. Atmos. Chem., 52, 295–317, 2005.
Zhang, J., Chameides, W. L., Wang, T., and Kiang, C. S.: Ground-level ozone pollution in Hong
30
Kong, Final report. Civic Exchange, Hong Kong. Available athttp://www.civic-exchange.org/
website, 2004.