Accessibility-Based Analysis of Infrastructure Improvements to the Multimodal Western Corridor in Massachusetts
by
Katharina A. McLaughlin
B.S. Civil and Environmental Engineering University of California, Berkeley, 2013
Submitted to the Department of Civil and Environmental Engineering in partial fulfillment of the requirements for the degree of
Master of Science in Transportation at the
Massachusetts Institute of Technology June 2016
© 2016 Massachusetts Institute of Technology. All rights reserved
Signature of Author ………. Department of Civil and Environmental Engineering May 19, 2016 Certified by ……….. Frederick P. Salvucci Senior Lecturer of Civil and Environmental Engineering Thesis Supervisor Certified by ……….. Mikel E. Murga Lecturer and Research Associate of Civil and Environmental Engineering Thesis Supervisor Accepted by ………. Heidi M. Nepf Donald and Martha Harleman Professor of Civil and Environmental Engineering Chair, Graduate Program Committee
Accessibility-Based Analysis of Infrastructure Improvements to the
Multimodal Western Corridor in Massachusetts
by
Katharina A. McLaughlin
Submitted to the Department of Civil and Environmental Engineering on May 19, 2016, in partial fulfillment of the requirements for the degree of
Master of Science in Transportation
Abstract
MassDOT is in the planning stages of the Allston I-90 Interchange Improvement Project which, largely due to public participation, could evolve into a multimodal project involving replacing the structurally deficient highway interchange, providing enhanced bike and pedestrian connectivity, building a new West Station, and eventually introducing new passenger rail service using DMU’s through Kendall to North Station. With the roadway network operating close to, at, or beyond its practical capacity, these changes could allow for a major modal shift to transit for commuters from the largely residential western suburbs to multiple high growth areas in Boston, including Kendall, Downtown, the Innovation District, and Longwood Medical Center. Growth in these areas is currently occurring in the absence of viable transportation options, rather than because of them, and additional options will need to be provided if future growth in the area is to be sustained.
This thesis assumes an optimistic view of continued development by continuing to project high job growth and related transportation demand in the Western Corridor to the year 2030. This includes identifying the mode shift that would be necessary to accommodate this future and designing the service characteristics of the system required to support this shift. These forecasts are considered in the context of other major infrastructure projects and the regional economic impacts they have had.
With sufficient investment in new and existing transportation infrastructure in the Western Corridor, including all-electronic tolling on the turnpike, off-ramp reconfiguration, increased frequency on commuter rail, new DMU service on the Grand Junction, and supplementary bus connections throughout the region, it will be possible to sustain high job and residential growth in the Boston area. Without these improvements, particularly those on the transit side, industries and individuals may see reduced accessibility to workers, jobs, and services and may therefore choose to move elsewhere. It is important to factor in these greater regional economic impacts when reviewing the true value of potential improvements to the transportation system.
Thesis Supervisor: Frederick P. Salvucci
Title: Senior Lecturer of Civil and Environmental Engineering Thesis Supervisor: Mikel E. Murga
5
Acknowledgments
My thesis would not have been possible without the wisdom and support of my advisors, Fred Salvucci and Mikel Murga. Thank you so much for your advice and feedback in solidifying the ideas pursued throughout my research and my time at MIT.
Thank you also to the other researchers and students in the Transit Lab and MST program, for the many ideas shared in our weekly meetings and informal conversations. Thanks in particular to Anson, Javier, and Matthew for sharing your work and helping with various aspects of this thesis.
There have been many people and organizations who have provided data, whether directly or as a public resource, that helped guide this research, including but not limited to the Accessibility Observatory, MassDOT, the US Census Bureau, and the CTPS.
Thank you to my friends and family, near and far, for always being there with positivity and perspective. I am especially grateful to my parents and to Narayanan. All of your support means the world to me.
7
Table of Contents
Acknowledgments ... 5 List of Figures ... 10 List of Tables ... 12 List of Equations ... 14 1 Introduction ... 151.1 Background and Methodology ... 15
1.2 Objectives and Framework ... 16
1.3 Thesis Organization ... 17
2 Western Corridor Characteristics and Transportation Constraints ... 19
2.1 High Growth Employment Areas ... 20
2.2 Residential Suburbs ... 24
2.3 Roadway Capacity Constraints ... 27
2.4 Transit Capacity Constraints ... 36
2.4.1 Current Transit Service ... 37
2.4.2 Constraints to Transit Service and Potential Solutions ... 38
2.5 Allston I-90 Interchange Improvement Project ... 43
2.6 Unique Challenges and Opportunities ... 45
3 Comparison of Regional Model Predictions to Actual Conditions ... 47
3.1 Transportation Network Impacts ... 48
3.1.1 Traffic Impacts ... 49
3.1.2 Transit Impacts ... 53
3.2 Impacts on Accessibility ... 55
3.3 Wider Economic Impacts ... 56
3.3.1 Real Estate Impacts ... 57
3.4 No-Build Scenario ... 61
3.5 Lessons Learned for Future Projects ... 62
4 Importance of Multi-Modality ... 65
4.1 Factors that Impact Mode Choice ... 67
4.2 Discussion of Capacity Constraints by Mode ... 73
8
4.4 Relative Accessibility and Mode Choice ... 78
4.5 Conclusions ... 81
5 Past, Current, and Future Demographic Trends ... 82
5.1 Changes in Population ... 82
5.1.1 Changes in Population Characteristics... 83
5.2 Changes in Jobs ... 85
5.2.1 Job Characteristics ... 89
5.3 Current Transportation Demand ... 90
5.3.1 Current Demand Patterns ... 90
5.3.2 Commuting to MIT Survey ... 93
5.3.3 Recent Changes in Traffic Conditions ... 95
5.4 Changes in Transportation Demand ... 97
5.4.1 Back of the Envelope Projections ... 97
5.4.2 Modeled Projections ... 98
5.5 Proposed Solutions to Satisfy Growth by Addressing Transit Capacity Constraints ... 99
5.5.1 Planning Horizons... 101
6 Accessibility-Based Analysis of Infrastructure Improvements... 104
6.1 Measures of Accessibility ... 105
6.1.1 Literature Review ... 105
6.1.2 Accessibility Measure Used in this Thesis ... 106
6.1.3 Gamma Function Sensitivity Analysis... 108
6.2 Methods ... 109
6.2.1 Conveyal Analyst ... 109
6.2.2 Cube Voyager Model ... 111
6.3 Current Accessibility ... 113
6.3.1 Accessibility to Jobs ... 113
6.3.2 Accessibility to Workers ... 118
6.4 Impact of Infrastructure Improvements on Accessibility ... 121
6.4.1 Addition of West Station and Boston Landing to the Framingham/Worcester Commuter Rail Line ... 121
6.4.2 Transfers at West Station to the Grand Junction... 125
6.4.3 Extension of Grand Junction Service to the West, Along Existing Western Corridor Commuter Rail Lines ... 130
9
6.5 Projected Changes in Relative Accessibility and Mode Choice ... 132
6.6 Capacity Modifications to Accessibility ... 133
6.7 Changes to Auto Accessibility due to Induced Mode Shift ... 135
6.8 Allston as a Growth Node ... 137
7 Conclusions ... 140
7.1 Findings and Recommendations ... 140
7.2 Future Research ... 142
7.3 Closing Remarks ... 143
10
List of Figures
Chapter 2
2.1 Boston high growth employment areas (yellow) and Western Corridor transportation ... 20
2.2 High-density land use is possible due to transit usage (Zupan & Pushkarev, 1977) ... 21
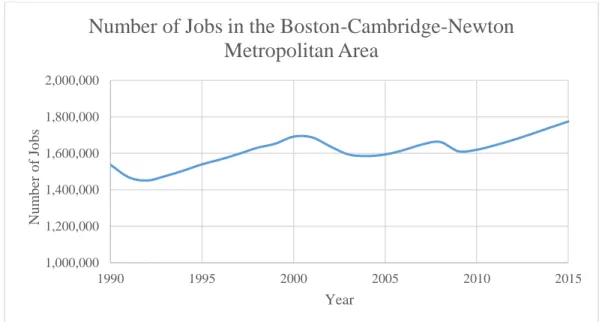
2.3 Change in number of jobs in the Boston metropolitan area (Executive Office of Labor and Workforce Development, 2016) ... 22
2.4 Change in number of jobs in Cambridge, MA over the past decade (United States Department of Labor, 2016) ... 23
2.5 Historic average commute time to work shown at the destination (U.S. Census Bureau, 2016) ... 24
2.6 Home prices in the Western Corridor (Trulia, 2016) ... 25
2.7 Greenshields Model – Fundamental Diagram (Odoni, 2014) ... 28
2.8 Average Daily Traffic Volumes – Eastbound ... 29
2.9 Average Daily Traffic Volumes – Westbound ... 30
2.10 2010 traffic volumes during AM peak ... 31
2.11 2010 traffic volumes during PM peak... 32
2.12 Theoretical visualization of peak and shoulder travel demand, volume, and capacity ... 33
2.13 Accessibility to jobs by transit in the Boston metropolitan area (Owen & Levinson, 2014) ... 36
2.14 Schematic of South Station Terminal and Interlocking (MassDOT, 2014) ... 40
2.15 MassDOT’s vision for 2024, with Grand Junction service included (MassDOT, 2014) ... 42
2.16 Project area for Allston Interchange Improvement Project (O'Dowd, 2014) ... 44
Chapter 3
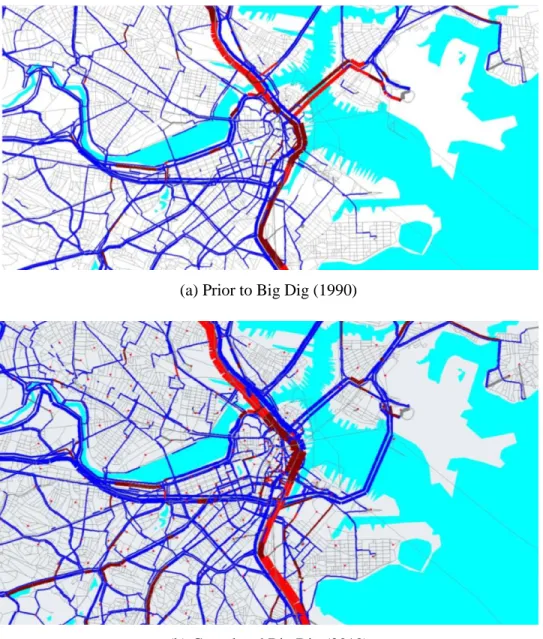
3.1 Site of I-90 and I-93 in Downtown Boston (Google, 2016) ... 473.2 Modeled road flows before and after the Big Dig (Peralta-Quirós, 2013) ... 49
3.3 Traffic patterns in Downtown Boston before and after the Big Dig (Richard, 2015)... 52
3.4 Changes in accessibility by auto to jobs for zones in the Boston area from 1990 to 2010 ... 55
3.5 Theoretical “two-hump” trend of economic benefits of a large infrastructure project (Morales Sarriera, 2016) ... 56
3.6 Changes in median sales price in (a) South Boston and (b) the North End for all properties (Trulia, Inc., 2016) ... 59
3.7 Locations of three analysis sites in the South Boston/Innovation District (Google, 2016) ... 60
3.8 Changes in accessibility by auto to jobs for zones in the Boston area from 1990 to 2010 under “no build” scenario ... 62
11
Chapter 4
4.1 Employee Commute Mode Shift due to Office Relocation – Outer London ... 68
4.2 Employee Commute Mode Shift due to Office Relocation – Trondheim ... 68
4.3 Ratio of non-auto mode share to auto mode share on the residential end ... 71
4.4 Residential density in the Boston area ... 77
4.5 Western Corridor zones and major transportation options (turnpike in purple, commuter rail in orange) ... 81
Chapter 5
5.1 Population by TAZ for 1990, 2000, and 2010 in the urban Boston core ... 845.2 Population by TAZ for 1990, 2000, and 2010 for Western Corridor communities ... 84
5.3 Employment and labor force sizes from 1976 to 2015 (Executive Office of Labor and Workforce Development, 2016) ... 85
5.4 Population and employment growth in the South Boston Waterfront (VHB, 2015) ... 86
5.5 Existing height limits in Cambridge near Kendall Square (Cambridge Community Development Department, 2013) ... 88
5.6 Area jobs by industry ... 89
5.7 Area professional jobs by sub-industry ... 90
5.8 Modal split in Boston and Cambridge over the past three decades ... 92
5.9 Current Allston Interchange ramp configuration (Boston Regional Metropolitan Planning Organization, 2012) ... 92
5.10 Boston high growth employment areas (yellow) and Western Corridor transportation ... 97
5.11 Projected 2030 accessibility to jobs by auto ... 99
5.12 Importance of Allston Interchange as providing access to high growth areas (MassDOT, 2015) ... 100
5.13 Projected Timeline for Allston Interchange Improvement Project (MassDOT, 2015) ... 102
Chapter 6
6.1 Example impedance functions (based on (Kwan, 1998)) ... 1066.2 Travel time decay function for commute trips in the Greater Boston Area (Peralta-Quirós, 2013) ... 107
6.3 Stops served within Route 128 by proposed transit services ... 110
6.4 Current accessibility to jobs by auto in Boston, using congested travel times (Murga, 2015) .... 114
6.5 Current accessibility to jobs by auto in Boston, using free-flow travel times ... 115
6.6 Current accessibility to jobs by transit in Boston ... 117
6.7 Current accessibility to workers by auto in Boston ... 119
12
6.9 Change in 60-minute travel time isochrone from South Station (Conveyal, 2016) ... 122
6.10 Change in 60-minute travel time isochrone from West Station, regionally and in the Western Corridor, respectively ... 123
6.11 Changes in areas accessible to West Station ... 124
6.12 Changes in accessibility of residents and jobs to West Station (blue is before, green is after) ... 124
6.13 Grand Junction service and proposed stops ... 125
6.14 Changes in areas accessible to West Station with Grand Junction service ... 126
6.15 Changes in accessibility of residents and jobs to West Station with Grand Junction service (blue is before, green is after) ... 127
6.16 Changes in areas accessible to Kendall Station with Grand Junction service ... 128
6.17 Changes in accessibility of residents and jobs to Kendall Station with Grand Junction service (blue is before, green is after) ... 128
6.18 Changes in areas accessible to North Station... 129
6.19 Changes in accessibility of residents and jobs to North Station with Grand Junction service (blue is before, green is after) ... 129
6.20 Changes in areas accessible to Kendall... 130
6.21 Projected 2030 accessibility to workers by auto ... 136
6.22 Job density in the Boston urban core ... 138
6.23 Projected changes in travel time isochrones from West Station ... 139
6.24 Projected changes to accessibility to workers at West Station (blue is before, green is after) .... 139
List of Tables
Chapter 2
2.1 Results of survey conducted in September and October 2014 (Murphy, 2015) ... 262.2 Highway level of service definitions and corresponding flow and density ranges (Homburger, Hall, Reilly, & Sullivan, 2007) ... 28
2.3 Number of weekday transit vehicle trips (Massachusetts Bay Transit Authority, 2015) ... 37
2.4 Estimated Western Corridor transit capacity ... 38
2.5 Estimated current transit ridership through the Western Corridor ... 38
Chapter 3
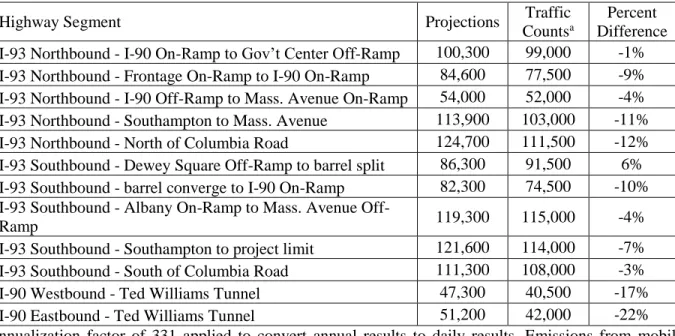
3.1 Comparison of VHT Changes with Original Projections (Economic Development Research Group, Inc., 2006) ... 5013
3.3 Comparison of projected transit and auto trips to study area and Boston proper, 1987, 2010
Baseline, and 2010 Build (Massachusetts Department of Public Works, 1990)... 54
3.4 Comparison of existing and projected VMT and VHT in study area (Massachusetts Department of Public Works, 1990) ... 61
Chapter 4
4.1 Person miles traveled on transit per year (MassDOT, 2014) ... 664.2 Average travel time to work by mode in the United States (American Association of State Highway and Transportation Officials, 2015) ... 72
4.3 Average travel time to work by mode in the Boston area for 2010 to 2014 (U.S. Census Bureau, 2010-2014) ... 73
4.4 Ranking of top US cities and metropolitan areas ... 75
4.5 Accessibility to workers at job destinations in the Boston area ... 76
Chapter 5
5.1 Boston Metro Area Population (U.S. Census Bureau, 1850-2010) ... 835.2 Future Employment for Kendall Square (Metropolitan Area Planning Council, 2011) ... 87
5.3 Current Development Projects in the Longwood Medical Area (MASCO Area Planning, 2012) 88 5.4 Mode share for Western Corridor commuters to MIT ... 94
5.5 MIT employee commute mode share for selected towns and areas ... 94
5.6 Travel speed distributions on I-90 westbound during the evening peak (4 pm – 6 pm) (miles per hour) ... 95
5.7 Travel speed distributions on I-90 westbound during the extended evening peak (3 pm – 7 pm) (miles per hour) ... 96
5.8 Travel speed distributions on I-93 during the morning peak (7 am – 9 am) (miles per hour) ... 96
5.9 Future travel demand under Allston Interchange ENF assumptions ... 97
5.10 Future travel demand under high growth assumptions ... 98
Chapter 6
6.1 Accessibility rankings to workers by auto on the congested network ... 1086.2 Accessibility rankings to workers by transit ... 109
6.3 Simplified current Worcester/Framingham commuter rail schedules ... 110
6.4 Link travel characteristics for Grand Junction service (proposed stops in bold, where 893998 is West Station, 88444 is Kendal Station, and 894282 and 894290 are North Station) ... 111
6.5 Current Western Corridor transit service (number of trips per period)... 134
6.6 Proposed Western Corridor transit service (number of trips per period) ... 134
6.7 Proposed Western Corridor transit capacity (number of passengers) ... 135
14
List of Equations
Chapter 4
4.1 Relative Accessibility and Mode Choice Regression Model ... 79
Chapter 6
6.1 Commute Trip Travel Time Decay Function ... 107 6.2 Commute Trip Travel Time Decay Function with 15 minute cutoff ... 108 6.3 Commute Trip Travel Time Decay Function with 30 minute cutoff ... 108
15
Chapter 1 – Introduction
The Boston area is growing. While in the past, growth in the area could be accommodated by the historic transit system as well as by the auto network, both networks are now running close to, at, or over capacity during peak hours. In order for projected growth to occur and not be constrained by an inadequate transportation network, improvements to the system need to be made because growth in demand is exceeding transportation capacity. Otherwise, roadway congestion and transit vehicle overcrowding will impose increased discomfort to commuters, accessibility to jobs and workers will decline, and economic growth will be constrained.
Infrastructure projects require a large upfront cost, with benefits lagging years behind in an unpredictable and perhaps very different future, making it challenging to justify these projects to taxpayers. It can also be difficult to quantify all the varying benefits that can ripple through society, including avoiding the cost of what would occur if nothing is done to improve transportation capacity. This challenge is studied in the Boston area in the context of improvements to the I-90 Turnpike and parallel commuter rail and other transit service now being considered in Allston. If improvements are made, particularly to improve transit capacity, current levels of service for auto travelers in the corridor could be maintained and additional demand could be satisfied by transit. If sufficient transit improvements are not made, auto traffic volumes will approach capacity, resulting in unstable flow and reduced capacity. This could increase commuter dissatisfaction, reduce the economic attractiveness of the region, and constrain the amount of development that is now occurring in existing growth nodes and could continue to occur in new areas in the future.
1.1 Background and Methodology
To compare future potential investments in transportation capacity and measure their potential impact, this thesis will employ an accessibility-based analysis to evaluate possible transportation improvement scenarios. Accessibility is defined as the number of jobs or workers than can be accessed from a home or job site within a certain travel time threshold. This measure is used to capture the economic and societal impacts of location choice by integrating not just travel time but also the number of opportunities that can be reached within a particular travel time (Ducas, 2011). This will capture the impacts of both additional congestion in the network and additional jobs and housing in the area. Further effort will be taken to disentangle these two impacts to better understand the types of changes that should be made in order to accommodate alternative potential futures.
16
This analysis will be applied to the transit and auto networks. The primary challenge facing the auto system is restoring a physical state of good repair to the aging infrastructure. Because few changes can or should be made to increase the capacity of the auto network, the only way to avoid further congestion on roadways will be to encourage some existing and new travelers to use alternate modes. Capacity constraints on a highway cause flow to be nonlinear, with density and travel speed ranges that can be difficult to predict and lead to reduced throughput. Free flow travel on the turnpike will not be possible during peak hours, nor is this necessarily desirable. But by preventing travel speeds from dropping from the 30 to 40 mile per hour range into the completely unstable 10 to 20 mile per hour range, satisfactory conditions and capacity could be maintained for adequate service for those who choose to travel by private vehicle.
An effort currently being planned by MassDOT to address structural deficiencies in a highway interchange could be developed to address these transportation network constraints. This project is the Allston Interchange Improvement Project, and while it was originally conceptualized as just a highway project, it has evolved in the planning stages into a multi-modal transportation project (MassDOT, 2014). This development could lead to better transit service in the Western Corridor, as will be discussed in the second chapter. If implemented in full, this project could help restore roadway flow to more stable conditions, improve transit frequency and reliability, alleviate growth constraints for commuters from the residential Western Corridor to high growth areas in and near Downtown Boston, and eventually support a new high accessibility growth node to complement these existing areas. This project is used to test the methodology in this thesis, particularly since the State of Massachusetts may have additional data on accessibility available in future years that could fit in with this framework for future project analysis.
This thesis will also look at changes in travel times and incorporate these results into the accessibility calculations. This is done in order to disentangle the two large-scale changes that will be occurring – job growth and congestion intensification. Accessibility is an insightful measure for comparison, but is best when considered alongside other methods that can provide additional understanding into the reasons behind the trends that are detected.
1.2 Objectives and Framework
Instead of the reactionary transit planning policy seen traditionally, this thesis intends to explore a methodology where anticipated problems are addressed before they become critical. This includes anticipating demand reaching the capacity constraints of a system while congestion is still at a manageable level. This is expected to better utilize existing resources in the long-run, because as networks become less
17
efficient they also become less cost effective. Therefore, the timing of infrastructure improvement projects is very important, as these projects can be much more effective if they are implemented before the problems they are trying to solve have been exacerbated or have led to catastrophic consequences, as well as before construction costs have increased further, as they tend to outpace inflation.
This is illustrated by designing a system based not solely on demand, but by considering what capacity is possible. First, the limiting constraints of the transit and highway networks will be calculated. This allows alternative possible transit investments to be designed. Then, these systems must be compared to traveler preferences on mode choice in order to determine whether they will be sufficient to encourage the appropriate behavioral change. The final step will be to go back and calculate whether this level of transit usage will be enough to accommodate growth in the area and successfully bring turnpike traffic congestion down to levels that can maintain throughput capacity. If this is not possible, other changes to the auto network such as tolling, parking pricing, and parking restrictions will be suggested.
Real world projects are often constrained to looking at the world as it currently is and assuming it is likely to remain that way. Research offers the flexibility to test potential scenarios associated to specific trends – such as lower auto mode share, shifting residential patterns, more frequent transit service on new modes – in order to project a new future. The work in this thesis will assume high growth in the Boston area, particularly in certain existing and proposed job-dense areas, and attempt to design a transportation system that could sustain this growth. While this level of growth is possible it is not guaranteed, as it is much more likely to occur if it is not stunted by a lack of viable transportation options.
1.3 Thesis Organization
This thesis is organized into seven chapters including this introduction. Chapter two introduces the project area in which MassDOT is in the preliminary stages of the highway interchange improvement project that will integrate multi-modal components. This chapter analyzes the opportunities and challenges facing the transportation corridor this interchange serves and the communities along it.
The third chapter looks at a recently completed large infrastructure project, The Central Artery and Tunnel Project. In this chapter, projections made in the environmental review process can now be compared to actual conditions in order to provide insights on how accessibility by road and transit was affected by this project.
18
Chapter four discusses the literature on mode choice. Because a modal shift to transit will be necessary to accommodate projected growth in the area, this chapter looks at why travelers, particularly commuters, make the modal choices we have observed.
The fifth chapter takes a look at the past, analyzing the trends in demographics and transportation demand in order to create the framework and provide the expectations for future changes.
These future changes are further explored in chapter six where an accessibility-based analysis is conducted, so that potential improvements to the transportation network are analyzed and compared.
The seventh and final chapter will present the design of the multi-modal transportation system that would be sufficient to address the network and demographic changes explored in the previous chapters. This chapter will also provide recommendations on how similar methods can be used to analyze other infrastructure improvement projects in the future, before summarizing the findings of this thesis and suggesting future work.
19
Chapter 2 – Western Corridor Characteristics and Transportation Constraints
This chapter describes the current conditions of the area under analysis and the constraints facing its existing and potential transportation network. The area referred to as the Western Corridor runs about 50 miles mostly east-west from Downtown Boston through Allston, Newton, and suburban communities out to Worcester. By car, the corridor is served by the I-90 Turnpike, the eastern-most portion of the interstate highway that traverses the country from Seattle to Boston and charges a distance-based toll within the state of Massachusetts. The Western Corridor is also served by the Worcester/Framingham commuter rail line with 24 weekday trips in each direction (Massachusetts Bay Transit Authority, 2015). There is also some service provided through this corridor by the MBTA Green Line light rail system and nine overlapping commuter bus routes on the turnpike. Auto drivers can also take parallel routes on roads such as State Route 9, Nonantum Road, and Soldier’s Field Road for parts of the corridor.This corridor is important because it provides service from largely residential areas west of Boston to high growth employment areas in and near Downtown Boston, as highlighted in the map shown in Figure 2.1. These employment areas are expected to continue growing, despite constraints to employee access due to congested conditions on the turnpike and due to infrastructure restrictions that limit the expansion of service on commuter rail. Because the turnpike cannot accommodate additional traffic and will not be expanded to do so, the best option for moving a growing number of commuters through the Western Corridor is to encourage a modal shift of existing and new commuters to an enhanced and expanded transit network, which will be possible due to infrastructure improvements in the area referred to in Figure 2.1 as West Station. These changes could relieve the current single track bottleneck in the area, and allow for a new rail link from West Station through Kendall to North Station, possible due to new federal regulations on the use of Diesel Multiple Units (DMU) on corridors shared with freight rail. This link could also be expanded along existing commuter rail lines further into the Western Corridor. Additionally, there is potential for increased capacity on the Riverside branch of the Green Line and additional express buses on the turnpike to provide additional transit capacity in the corridor.
The chapter will begin by providing the context for why additional transportation demand is expected in the Western Corridor before introducing the constraints and opportunities for meeting this demand across the possible modes. Chapter 6 will elaborate further on whether these ideas could be successful.
20
Figure 2.1: Boston high growth employment areas (yellow) and Western Corridor transportation
2.1 High Growth Employment Areas
The Boston economy is growing, and the transportation network is nearing the capacity to adequately serve the corresponding growth in travel demand. There are a few areas in particular whose growth is outpacing that of Boston as a whole, such as Longwood Medical Center, Kendall Square, the Innovation District, Logan Airport, and the Financial District and Back Bay in Downtown Boston. There is also potential for a new growth node at Allston near West Station. Some of these have traditionally been employment centers while others are newer. All lie within a reasonable distance of the I-90 Turnpike as it weaves through Boston and have a level of transit access such that service from the Western Corridor via the Framingham/Worcester commuter rail line is possible, directly or with a single transfer.
Kendall Square lies adjacent to MIT’s campus and is a booming computer and biomedical technology center. This area benefits greatly from agglomeration effects of being close to MIT’s and Harvard’s campuses as well as many medical centers such as Massachusetts General Hospital and the Longwood Medical Center. Kendall is experiencing high growth in high-income jobs in biotech and other technology industries. High-income job growth will in turn increase the number of lower-income jobs to supplement the developing area. Correspondingly high residential growth has not occurred. According to the US Census, from 2000 to 2010 the number of households in the city of Cambridge increased just 3%, from 42,615 to 44,032 (U.S. Census Bureau, 2000; U.S. Census Bureau, 2010). This trend is expected to continue so many of these future employees will need to travel to their jobs (generally during peak hours) and the number of home-based work trips to Kendall is expected to increase.
21
The most direct transit option to Kendall is the Red Line, which is currently operating at capacity during the peak. Improvements to the signaling system could decrease headways to as low as 2 minutes, supporting more than double the capacity if sufficient vehicles are acquired. Arterial streets are also at capacity during peak hours and will not be able to adequately accommodate all additional users if growth happens as expected. Even if job growth is less than expected (as it may be if transportation constraints are not adequately addressed or if a large industry shift occurs), changes to the transit network through Cambridge could improve accessibility for residents from the west to travel to North Station, better linking the greater transit network of the Boston area and encouraging additional users to shift their travel mode to transit.
Zupan’s historical analysis of the relationship between transportation modes and land use density demonstrated that high density development is not possible with auto usage alone (Zupan & Pushkarev, 1977). As the number of trip ends per square mile exceeds a certain threshold, the density of vehicles on the roadway and the amount of parking required is not sustainable and thus change in modal split between auto and other modes is required. Zupan and Pushkarev made this observation by comparing the number of daily person trips by auto across cities in the United States, and seeing that they did not exceed a rough threshold regardless of the density of the city. Boston had already exceeded this threshold in 1977 when the book was originally published, and today areas like Kendall and the Innovation District have even higher transportation demand, with approximately 350,000 and 340,000 trip ends per square mile, respectively, in the most dense centers of development (VHB, 2015; Fay, Spofford & Thorndike, 2015). If full build-out projections are realized, growth in Kendall and the Innovation District is estimated to increase these values to 460,000 and 530,000, respectively.
22
Despite recent periods of worldwide recession, the change in the number of jobs in the metropolitan area has been net positive over the past 25 years (Executive Office of Labor and Workforce Development, 2016). Figure 2.3 includes jobs in all industries and in all locations in the Boston-Cambridge-Newton Metropolitan Area. Because this growth is expected to continue, so is the number of trip ends per mile, especially since the growth will be concentrated in certain industries and at certain high density locations. It will require increasing transit usage to sustain that development.
Figure 2.3: Change in number of jobs in the Boston metropolitan area (Executive Office of Labor and Workforce Development, 2016)
When looking just at high-growth industries in high-growth areas, the increase is much more significant. The number of jobs in the Innovation District increased from 28,800 to 36,500 from 2000 to 2013, an increase of 7,700 jobs, or 27% (VHB, 2015), higher than the overall increase of 3% in the city of Boston and 1% for the metropolitan area. The number of jobs in the Innovation District is expected to increase another 63% of current values by 2035, to 59,430 jobs. Concentrated growth is a larger issue from a transportation perspective because it places more strain on lower-capacity infrastructure such as off-ramps as well as larger-capacity infrastructure such as the main thoroughfare or highway. Longwood Medical Center is another example of concentrated job density and growth, as it already employs 45,200 people with an average of 1,100 new jobs per year (MASCO Area Planning, 2012). In Kendall, the majority of job growth has been in industries categorized as “Professional and Technical Services” which, when separated from total jobs or service jobs as in the following figure, shows substantially higher growth in the past decade than both total jobs and “Accommodation and Food Services” (United States Department of Labor, 2016). 1,000,000 1,200,000 1,400,000 1,600,000 1,800,000 2,000,000 1990 1995 2000 2005 2010 2015 Nu m b er o f Jo b s Year
Number of Jobs in the Boston-Cambridge-Newton
Metropolitan Area
23
Figure 2.4: Change in number of jobs in Cambridge, MA over the past decade (United States Department of Labor, 2016)
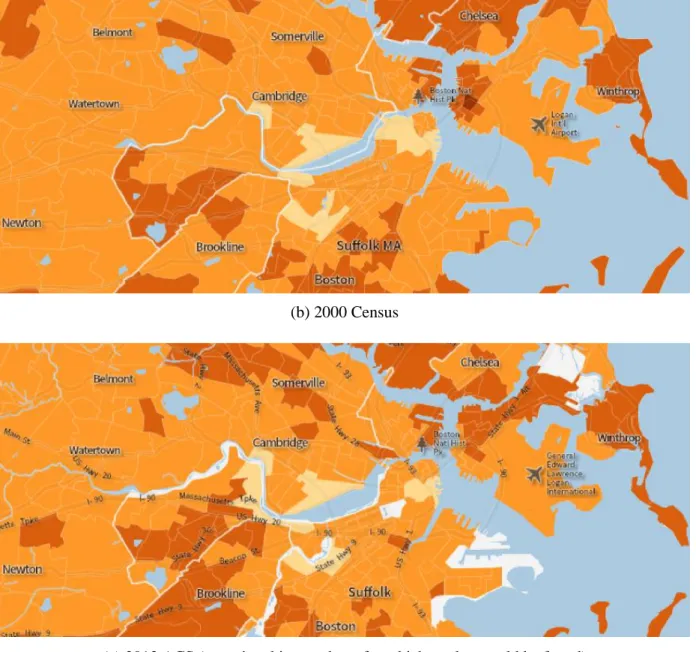
Because of this job growth and relatively few infrastructure investments to help accommodate it, commuting times have been increasing over the same period. The following plots show the average commute time to a destination across all modes for the years 1990, 2000, and 2013. From 1990 to 2000, the Central Artery and Tunnel project helped mitigate increases to the average auto commute time in north Boston, but commute times outside of that area increased noticeably. It appears that between 2000 and 2013 capacity on the expanded Central Artery began to be reached again and average commute times across all modes increased relatively consistently across all of Boston. These trends will be analyzed further by mode in Chapter 4. (a) 1990 Census 0.400 0.600 0.800 1.000 1.200 1.400 1.600 2005 2006 2007 2008 2009 2010 2011 2012 2013 2014 Nu m b er o f jo b s in d ex ed to 2 0 0 5
Job Growth in Cambridge
Professional and Technical Services (20,701 jobs in 2005) Accommodation and Food Services (8,371 jobs in 2005) Total, All Industries (102,272 jobs in 2005)
24 (b) 2000 Census
(c) 2013 ACS (areas in white are those for which no data could be found) Scale:
Figure 2.5: Historic average commute time to work shown at the destination (U.S. Census Bureau, 2016)
2.2 Residential Suburbs
It has been difficult for residential growth in desirable locations to keep pace with employment growth. This has led to substantial increases in housing prices near job centers, and as a result many employees have had to move further away from their jobs, thereby placing additional strain on the
25
transportation network with their longer daily commutes. For some, it is a preference to live in a less urban area but for many it is a choice made purely due to financial constraints (Ralph, Taylor, Blumenberg, Brown, & Voulgaris, 2016). Some commuters live as far as Worcester, but most remain within a more reasonable distance to Boston. Another reason for this distribution is two-income families where the job location constraints of both earners must be considered. The following figure pinpoints median sale prices of homes in communities along the Western Corridor where employees could move instead of living in Downtown Boston or Cambridge. Proximity to Boston is not the only factor for high home prices, as there is a ring around the Route 128 corridor with higher home prices, due to the size of the homes, quality of schools, and the appeal of suburban living. However, sale price per square foot shows a clearer gradient of decreasing unit cost from downtown outwards.
Figure 2.6: Home prices in the Western Corridor (Trulia, 2016)
According to a survey done as part of a City of Cambridge Incentive Zoning Nexus Study published in early 2015, the majority of new employees in Cambridge do not demand housing within the city of Cambridge (Murphy, 2015). This study asked participants whether after accepting a job offer in Cambridge they looked for housing in Cambridge and either moved there or did not, due just to the cost of housing. The question was phrased this way in order to capture not just those who live and work in the same city, but also those who want to, but were unable to do so due to financial constraints. The responses are summarized by employee industry in Table 2.1.
26
Table 2.1: Results of survey conducted in September and October 2014 (Murphy, 2015) Tenant Use/Industry
Percentage of New Employees Desiring Cambridge Housing
Research and Development 11.3%
Office 13.3%
Educational Institutions 26.5%
Retail, Restaurant, and Hotel 12.3%
Employees at educational institutions were the most likely to desire housing within the city at 26.5%, while those in all other industries were roughly equally likely to desire housing within the city, with around 11 to 13 percent of new Cambridge employees demanding housing in Cambridge. This distinction between industries is important, because much of the new employment in Kendall is expected to be research and development or office, rather than educational institutions, meaning that it is expected that a higher percentage of future Cambridge employees will live outside the city (especially when the increasing cost of living in Cambridge is considered) and they will likely have a longer commute, generating a larger strain on transportation infrastructure during peak hours.
Currently around 47% of Cambridge employees are also Cambridge residents, though this is likely so high due to the large number of undergraduate and graduate students in the city. Also partially due to the large student population, around 25% of people working in Cambridge walk to work, meaning they have a very low impact on the transportation network compared to other types of commuters. This is also expected to change, both because of local housing constraints and a shift in employment character from educational institutions to high-tech research and development and office jobs. However, if alumni of the educational institutions are those taking the jobs in the research and development fields, this change may be moderated. Many Red Line commuters travelling within Cambridge or from other urban areas such as Somerville do so partially due to the lower relative cost of living near places like Porter and Davis Squares than places like Kendall Square. Additional transit service along the Grand Junction could greatly benefit these types of commuters by providing additional living options along transit, allowing them to live in areas like Allston with a similar transit commute. These types of commuters are hypothesized to be the same type of people attracted to the new types of jobs in Kendall Square, so this change could have a large impact on the future commuting profile of the area.
While suburbs in the Western Corridor are close in distance to employment centers in Boston, they are often much further from a travel-time perspective. One example is Kendall Square and the residential Newtonville community in Newton, only 7.5 miles and around 16 minutes apart by car under free-flow conditions (Google Maps, 2016). However, this can take somewhere between 25 and 50 minutes by car
27
during peak hours, which is both significantly longer and significantly more variable. Travel by transit requires at least one transfer, likely in downtown Boston, and will take around 45 minutes to an hour. With a better connection through West Station, travel time by transit could be competitive with or faster than travel by car, especially during peak hours, with in-vehicle time of around 15 minutes plus time spent accessing stations on both ends.
When studying the future of the Western Corridor from an accessibility standpoint, a different picture appears than for that of the downtown core and other high job growth destinations. Since accessibility measures not just travel time but the number of jobs that can be reached within this time, an increase in congestion can have a huge impact on the accessibility of an origin. Because of this, without improvements to the transportation network, Western Corridor communities are likely to see lower accessibility to jobs despite economic growth in the region.
2.3 Roadway Capacity Constraints
The Massachusetts I-90 Turnpike is one of just two interstate highways serving Downtown Boston, the other being I-93 which serves commuters from the north and from the south. Because of the high desire for travel from the western suburbs to job areas in and near downtown, demand on the turnpike has exceeded capacity for years, and as a result the turnpike has been operating at capacity during peak hours and the duration of the congested peak has increased. Congestion is also observed during off-peak times, not just for temporary reasons such as construction and lane closures but also because demand can genuinely exceed capacity during the off-peak (Boston Regional Metropolitan Planning Organization, 2012).
The turnpike has two lanes in either direction outside of the Boston metropolitan area which grow into three lanes just before the turnpike enters Newton. There are three lanes for most of the turnpike’s journey through Boston, with the exception of four lanes between the Newton Corner and Prudential/Copley exits and two lanes in the Ted Williams Tunnel. Highway lanes are assumed to have a maximum capacity of around 2,000 vehicles per lane per hour, which can vary due to a variety of factors including driver behavior, weather, vehicle mix (of cars and trucks as well as locals and those less familiar with the road), and level of congestion (TRB National Cooperative Highway Research Program, 1999). Ideally, a highway will operate at somewhere under 1,500 vehicles per lane per hour, a level at which consistent travel movement can be maintained, but continuous flow at lower speeds is also possible for higher traffic volumes (Homburger, Hall, Reilly, & Sullivan, 2007). This corresponds with the theory behind the Fundamental Diagram of Traffic Engineering, simplified by the Greenshields Model in Figure 2.7, which demonstrates the relationship between traffic density (vehicles per unit length on a roadway) and traffic flow (vehicles
28
per hour passing a reference point). The first range of the plot represents free flow conditions and, as the density of vehicles on a road increases and speed is maintained, flow increases. However, beyond the peak flow point, flow begins to decrease despite the increase in the number of vehicles on the road due to unstable flow which leads to a decrease in traffic speeds, and the relationship becomes less predictable, as demonstrated by the grey lines. This also corresponds to the range of values for speed, flow, and density in Table 2.2, which shows the peak flow point beyond which conditions become unstable, as demonstrated by the growing error bars.
Table 2.2: Highway level of service definitions and corresponding flow and density ranges (Homburger, Hall, Reilly, & Sullivan, 2007)
LOS Speed Range (mph) Flow Range (veh./hour/lane) Density Range (veh./mile/lane)
A Over 60 Under 700 Under 12
B 57-60 700-1,100 12-20
C 54-57 1,100-1,550 20-30
D 46-54 1,550-1,850 30-42
E 30-46 1,850-2,000 42-67
F Under 30 Unstable 67-Maximum
Figure 2.7: Greenshields Model – Fundamental Diagram (Odoni, 2014)
Travel demand on the I-90 Turnpike has greatly exceed this optimal density level during peak hours, effectively decreasing the capacity of the road when it is needed most. Figures 2.8 and 2.9 show average daily traffic volumes in each direction over the past three decades (Boston Regional Metropolitan Planning Organization, 2012). Traffic volumes have been consistently increasing and are particularly high in the Allston Interchange through the exit that leads to Cambridge and the growing job center in Kendall Square. Overall, daily capacity exceeds daily demand, but there are periods during the day when demand exceeds capacity due to peaking behavior. Traffic volumes are presented through the Allston Interchange
Flo w ( q ) (v eh /h o u r/lan e) Density (k) (veh/mile/lane)
Greenshields Model – Fundamental Diagram
Peak Value: k = 67, q = 2000 Final Value: k = 134, q = 0 Initial Value: k = 0, q = 0
29
because major infrastructure improvements are currently being proposed for this area, as will be discussed further in Section 2.5.
Figure 2.8: Average Daily Traffic Volumes – Eastbound
0 10,000 20,000 30,000 40,000 50,000 60,000 70,000 80,000 (a) From Newton (b) Exiting at Allston (c) Through Allston Interchange (d) Allston to Copley (e) Copley toward Boston and I-93
I-90 Average Daily Traffic Volumes - Eastbound
30
Figure 2.9: Average Daily Traffic Volumes – Westbound
As mentioned, demand exceeds capacity on the roadway during peak hours and thus traffic volumes are at capacity under slow-moving, congested conditions during this time. Traffic volumes during peak hours, as measured by MassDOT, are presented in Figures 2.10 and 2.11 (Boston Regional Metropolitan Planning Organization, 2012). The peaks are defined as 6 am to 10 am and 3 pm to 7 pm. In theory, capacity through this area is around 8,000 vehicles per hour assuming each of the four lanes has a capacity of 2,000 vehicles per hour. Actual capacity is likely more complicated due to the toll booths in the interchange, which cause complicated weaving between lanes as vehicles enter and exit as well as a variable amount of additional time to queue and make a payment, either in cash or electronically, at the booth. Traffic volumes do not reach the theoretical maximum value during any hours of the AM and PM peaks, likely due to the impact of congested travel speeds and conditions. Travel volumes are highest inbound in the morning and outbound in the evening, which makes sense given traditional patterns of travel from residential suburbs to the job-dense city, though travel in the reverse-commute direction is also significant. Overall, around 31-34% of all daily traffic passes through each location in the peak-direction and 19-26% of all daily traffic passes through each location during the peak in the reverse-commute direction. This is during four hours,
0 10,000 20,000 30,000 40,000 50,000 60,000 70,000 80,000
(a) To Newton (b) Entering at Allston (c) Through Allston Interchange (d) Copley to Allston
(e) Boston and I-93 to Copley
I-90 Average Daily Traffic Volumes - Westbound
31
or 17%, of the day. Peaking behavior is higher in the morning than in the evening. Traffic volumes are distributed approximately equally across the peak but with the “peak of the peak”, or the orange and grey bars in each figure, recording slightly higher traffic volumes than the “shoulders of the peak” in blue and yellow.
32
Figure 2.11: 2010 traffic volumes during PM peak
There are a variety of ways to measure traffic congestion since it is a somewhat subjective measure. These include roadway level-of-service classifications, as previously introduced in Table 2.2. Other methods include defining a travel time index as the ratio of peak to off-peak travel speeds, measuring the duration of the congested peak period, and calculating the number of “delay hours”, or extra travel time felt
33
by users due to congestion. However, calculating an exact value for congestion is difficult because congested travel is inherently unstable. Since throughput decreases under high-volume conditions, demand is not always adequately measured by traffic volume. Demand beyond capacity splits into neighboring hours (or alternative paths), so during a time period such as 9-10 AM, actual travel demand may be below capacity but traffic volumes may still be high due to the presence of vehicles that would have liked to have traveled earlier but are still on the road due to the low travel speeds. Similarly, traffic volumes in the early morning hours such as 5 to 6 AM are likely higher than it would be if peak hours were not so congested as many commuters will choose to travel earlier and arrive at work before they are required to, in order to avoid congestion, shorten their time spent traveling, and lessen the frustration of their commute. This smooths traffic volumes from the peak into the “shoulders of the peak”, as visualized in the following figure, where demand is defined as the original demand for travel during an hour and volume is defined as the actual number of vehicles that choose to or are able to travel during that time.
Figure 2.12: Theoretical visualization of peak and shoulder travel demand, volume, and capacity Congestion also has an impact on driver behavior. Under high density conditions, drivers tend to be more cautious and may maintain large car spacing despite low travel speeds. Drivers, from the perspective of the roadway, do not have full information on the cause of the delay. Even as a road clears, drivers tend to maintain relatively low travel speeds with the expectation that they may need to suddenly slow down again later. Alternatively, they could become more aggressive in response to their frustration with travel conditions. Such changes in passenger behavior add to the instability of traffic conditions under periods of congestion. Travelers also begin to factor in reliability buffer time, and plan their trips based on the maximum amount of time they expect to take rather than the average due to the high level of variability
0 1000 2000 3000 4000 5000 6000 7000 8000 5-6 AM 6-7 AM 7-8 AM 8-9 AM 9-10 AM 10-11 AM 11-12 AM Veh icles p er Ho u r
Theoretical Behavior in the Shoulders of the Peak
34
in travel times under unstable conditions. Even when this leads to an early arrival, the perceived total travel time could still be considered the full reliability buffer time because this time is generally not spent optimally, as it would be if the user were not concerned about uncertainty in travel time and could plan their trip without this constraint.
The added cost of time and frustration, including unreliability in travel times, that comes with traveling during peak hours does encourage some users to shift their behavior to other time periods. Some cities have begun implementing strategies to further encourage users to shift driving behavior to the off-peak. This can potentially be achieved by implementing time-based tolling in order to allow users to weigh their travel value of time against the toll during the times in which they could travel, with discounts given for traveling outside of the peak hour. This is done in a variety of other systems, such as MTR in Hong Kong on the transit side and in the San Francisco/Oakland Bay Bridge in California on the roadway side. Time-based pricing does not completely eliminate congestion but it does influence some behavior, and is a relatively low-cost method of increasing the effective capacity of a highway or other transportation system, by better utilizing under-used capacity. It can also help dissuade users from avoiding the toll road during times when it would be socially optimal for them to use it, such as during the night when the alternative is traveling through a residential neighborhood. However, raising toll rates during peak hours to a level sufficient to influence behavior is likely not politically feasible in the short term in eastern Massachusetts. The toll rate from Framingham to the exit leading into Kendall Square in Cambridge currently totals $2.90 for the 19.5-mile journey, on the same order of magnitude as gasoline for most vehicles and minor compared to the cost of parking at the destination, which can run on the order of $6 just for the first half hour and up to $25 a day in parking facilities such as the One Kendall Square Garage. For this reason, it is unlikely that peak tolling will actually significantly modify behavior, though it may yield higher revenue for the state to meet its other goals.
In Massachusetts and in the United States as a whole, there is very little desire or feasibility to expand existing roads or build new highways, especially in dense urban areas. This has been the trend for decades as the negative externalities of highway expansion have been considered to outweigh the benefits of additional traffic capacity, particularly where this would come at the expense of displacing homes, businesses, and entire neighborhoods. Additionally, the sheer costs and disruption due to construction make it not a viable option, as the marginal cost to accommodate the peak of the peak is high. It is possible to work with these problems, such as during the Central Artery and Tunnel Project where capacity was added, and they were able to coordinate tunneling while the elevated structure was still operational and avoid taking residences and displacing jobs permanently. Still, the original decision was forced by a deteriorating viaduct structure. Building additional lanes for the turnpike or a high-capacity alternate route for Western
35
Corridor commuters is not considered a viable strategy to accommodate travel growth in the area. One option for highway expansion is in the existing right-of-way of the roadway, for example allowing use of the shoulder or breakdown lanes during peak hours, but this is only possible where this space has already been left available and has generally already been exhausted (as in the case of the Southeast Expressway). One way to increase the throughput of people through a roadway without increasing roadway space or traffic volume is to increase the number of passengers per vehicle. In 2009, average vehicle occupancy for trips to and from work was 1.13, lower than 1.67 passengers per vehicle for trips of all purposes (Santos, McGuckin, Nakamoto, Gray, & Liss, 2011). Given that commute flows tend to be concentrated by time and space, there should be ample opportunity for carpooling with minimal inconvenience to the driver and passengers. Employers in job-dense areas with expensive parking can encourage carpooling by helping facilitate trip matching and offering parking incentives, such as a refund on the parking fee or a spot closer to the job site (or a spot at all in parking-sparse areas). The government can theoretically help encourage carpooling by offering lower or free tolls to carpoolers, though this can be hard to regulate and is likely to be ineffective since the cost and availability of parking at the destination is a much more dominant factor for commuters. A lane in the roadway could be dedicated exclusively to carpoolers, shielding them from the worst congestion, but this is likely not possible on the turnpike where there are only 3 lanes in each direction. Therefore, this research will not evaluate infrastructure improvements to encourage carpooling and assumes that employers will encourage carpooling at their job sites in the short-term.
With MassDOT moving to all-electronic tolling, there is some potential for improved traffic flow through the turnpike in certain areas, as users will no longer need to come to a stop and complete a cash transaction in order to pay their toll. However, this is not expected to have a significant impact on overall traffic conditions in the corridor. There are not very many toll booths and, more importantly, the cause of congestion on the turnpike is that demand exceeds capacity of the entire roadway rather than just of some bottlenecks, so fixing these bottlenecks is not expected to address the entirety of the congestion problem. Some additional throughput may be made possible through the Allston Interchange, due to the straightening of the highway allowing for higher speeds, and the potential reconfiguring of the off-ramps to permit better distribution to more of the urban network, with an exit onto Commonwealth Avenue and Beacon Street feeding more directly to Longwood and other areas.
Route 9 is an example of another road that serves the Western Corridor, even for longer distance trips, without charging a toll. According to a 2010 study, average travel speeds in 2005 were observed to be slower than those in 1996, at all but a few locations along this route (CMRPC, 2010). This has led to levels of service of C or D during peak hours, which the CTPS considers to be at or beyond practical capacity (CTPS, 2016). Some users may be using Route 9 in order to avoid the toll on the turnpike while
36
others may be using this road in order to more conveniently reach their destination. Regardless of why users choose this route, it is clear it is also congested and cannot accommodate additional traffic growth, as was the case on the turnpike. In similar fashion, some drivers use Nonantum Road to bypass the toll, but this flow is joined by traffic from Greenough Boulevard and Fresh Pond Parkway, to overload the capacity of Solders Field Road and Memorial Drive, and so provides only modest turnpike relief for motorists with local Brighton destinations.
Given the lack of solutions to highway congestion available in the auto network, solutions to the congestion problem in the Western Corridor must be found in other modes where existing capacity is under-utilized or where expansion could be more feasible.
2.4 Transit Capacity Constraints
The western suburbs have historically been underserved by the transit network relative to suburbs to the north and the south of Boston, as is visualized in Figure 2.13. The key is calibrated to all areas in the United States, with Manhattan, New York being one of the only areas in the highest red category. While there are theoretical limits to transit capacity in the area, current service is well below these limits and there are many relatively inexpensive changes that could be made to vastly improve service and hopefully encourage a modal shift to transit.
37 2.4.1 Current Transit Service
Current transit service, as measured by the number of vehicle trips per weekday, is summarized in the following table (Massachusetts Bay Transit Authority, 2015). The inbound peak is defined as 6 am to 9 am (start of service to 9 am for commuter rail) and the outbound peak is defined as 4 pm to 7 pm. Refer to Figure 2.1 for a geographic visualization of these services, which all travel through the Western Corridor, though some more directly than others relative to the turnpike.
Table 2.3: Number of weekday transit vehicle trips (Massachusetts Bay Transit Authority, 2015)
Weekday Peak
Inbound Outbound Inbound AM Outbound PM
Commuter Rail 24 24 9 8
Green Line D 138 138 30 30
Turnpike Buses 223 214 111 94
The Worcester/Framingham commuter rail line utilizes six-car trains with a capacity of 100 to 150 passengers per train, leading to a full vehicle capacity of 600 to 900 passengers. The Green Line D Branch uses two-car trains with a capacity of 100 to 125 passengers per car, for a total capacity of 200 to 250 per train, and 2000 to 2500 passengers per hour (with 6 minute headways during peak hours) for this branch. Three-car trains are possible and have been used occasionally, which could increase train capacity to 300 to 375 passengers if more vehicles are introduced. New vehicles could also be introduced with higher capacity design. There are nine turnpike express bus routes. All routes run along the turnpike for at least part of their journey, some just to Brighton and others as far as Newton and Waltham. Each bus has a capacity of 40 to 70 passengers, depending on whether passengers are comfortable standing while traveling on the turnpike. Buses are currently well within capacity so passengers do not usually need to stand. Each route has between 10 and 50 scheduled trips per weekday, generally concentrated during peak hours.
For longer transit trips from the outer suburbs in the Western Corridor, the effective capacity is somewhere between seated capacity and standing crush capacity. While standing passengers will be able to board a specific trip, they may shift their future travel mode to auto, even on congested roads due to the higher relative comfort of sitting in a private vehicle. Ideally, users with long trips will have a seat for their entire inbound journey and at least part of their outbound journey and full capacity will only be reached at the peak load point near downtown with a mix of long and short commuters. With these assumptions, estimates of capacity are obtained from the MBTA Blue Book and are summarized in the following table (MBTA Service Planning Unit, 2010):
38 Table 2.4: Estimated Western Corridor transit capacity
Weekday Peak
Inbound Outbound Inbound AM Outbound PM
Commuter Rail 14,400 – 21,600 14,400 – 21,600 5,400 – 8,100 4,800 – 7,200 Green Line D 27,600 – 34,500 27,600 – 34,500 6,000 – 7,500 6,000 – 7,500 Turnpike Buses 8,900 – 15,600 8,600 – 15,000 4,400 – 7,800 3,800 – 6,600 Total 110,900–151,700 110,600–151,100 33,800 – 47,400 32,600 – 45,300 Current transit ridership through the Western Corridor was also estimated using data provided in the MBTA Blue Book (MBTA Service Planning Unit, 2010). Total ridership on commuter rail and turnpike buses is considered in the Western Corridor, while for the Green Line D branch just boardings on the spur were considered to represent Western Corridor transit demand. Local behavior within Downtown Boston is not considered Western Corridor ridership, and as the capacity is considered at the load point approximately parallel to the Allston Interchange (between Longwood and Fenway), this should appropriately estimate just Western Corridor Green Line D branch demand relative to capacity and not demand and capacity for travel through other overlapping corridors. The AM peak is defined as 6am to 9am (start of service to 9am for commuter rail). Trips between 4pm and 7pm are considered the PM peak. Table 2.5: Estimated current transit ridership through the Western Corridor
Weekday Peak
Inbound Outbound Inbound AM Outbound PM
Commuter Rail 8,800 8,500 7,200 6,300
Green Line D 22,800 24,100 7,500 7,500
Turnpike Buses 4,500 4,100 2,200 1,800
Total 36,100 36,700 16,900 15,600
Demand is below capacity on existing vehicles, and the number of commuter rail and turnpike express vehicles is well below the theoretical maximum, so there is potential for increased transit service and usage in the Western Corridor. The Green Line D branch only barely serves Western Corridor demand, so if the Green Line isn’t considered mode share is 16% transit and 84% auto for travelers through the Western Corridor on the average weekday, comparing Table 2.5 to turnpike volumes from Section 2.3.
2.4.2 Constraints to Transit Service and Potential Solutions
Beacon Park Yard is a rail yard in Allston that was used for maintenance and freight transloading until 2013 when operations were moved out to Worcester. Due to a historical arrangement, the MBTA, and therefore the Framingham/Worcester line, only has access to a single track through Beacon Park Yard for an approximately 1.7-mile stretch between Yawkey and Newtonville stations (Central Transportation
39
Planning Staff, 2012). Assuming that, at a conservative speed of 40 miles per hour, it takes 3.4 minutes to clear this single-track section, this constraint caps the theoretical maximum capacity of the commuter rail line and any other potential service through the area to 17 trains per hour total in both directions, or a train approximately every seven minutes in each direction if distributed evenly. However, this single-track constraint will soon be lifted due to the closure of the rail yard and subsequent agreement to provide the MBTA with an additional track through the yard, eliminating this bottleneck to rail operations and the interdependency between schedules in opposing directions.
The currently scheduled minimum time between a train leaving Yawkey outbound toward Beacon Park Yard and a train entering Yawkey from Beacon Park Yard is 2 minutes (Massachusetts Bay Transit Authority, 2015). This occurs when an outbound train is scheduled to leave Yawkey at 6:51 PM and an inbound train is scheduled to enter Yawkey at 6:53 PM, near the end of the PM peak. The single-track constraint begins just about 1.0 miles outbound from Yawkey, so these two trains must be scheduled such that inbound train leaves the single-track area just before the outbound train reaches it. Other than that, and one other example where the time between an outbound and inbound train is 3 minutes, the single-track constraint does not seem to be an issue with regards to the currently scheduled 24 trains in each direction every weekday.
Unique among the MBTA Commuter Rail lines, the Framingham/Worcester line must share the tracks it runs on with freight railroad CSX. Historically, CSX controlled dispatching, so freight trains have often disrupted passenger service. However, in June 2015, the MBTA announced that they had completed acquisition of the CSX rail lines used for the Framingham/Worcester commuter rail service (Massachusetts Bay Transit Authority, 2015). This allows the MBTA to control dispatch and prioritize passenger rail over freight rail, effectively increasing the reliability of passenger rail in this corridor. Changing this priority, especially through the single-track constraint in Beacon Park Yard, has already greatly increased reliability on the commuter rail line.
Outside of Beacon Park Yard, there are a variety of additional constraints. Constraints going into Back Bay and South Station, including platform constraints that are being worked-on in a separate project, could limit the theoretical maximum capacity of the track space allocated to the Framingham/Worcester Line once it reaches downtown Boston. This problem is compounded by vehicle fleet constraints. One potential solution to address this problem is scheduling some trains to short-turn at various locations along the route, as it is already done on the outer end of the line, with some trains traveling to Framingham and others all the way out to Worcester. This could include ending some trains at Back Bay or at the new West Station, which must be balanced against the inconvenience it could create for some passengers who did not previously transfer but would now need to transfer in order to reach their final destination. However, it is