HAL Id: hal-02355001
https://hal.archives-ouvertes.fr/hal-02355001
Submitted on 8 Nov 2019
HAL is a multi-disciplinary open access
archive for the deposit and dissemination of
sci-entific research documents, whether they are
pub-lished or not. The documents may come from
teaching and research institutions in France or
abroad, or from public or private research centers.
L’archive ouverte pluridisciplinaire HAL, est
destinée au dépôt et à la diffusion de documents
scientifiques de niveau recherche, publiés ou non,
émanant des établissements d’enseignement et de
recherche français ou étrangers, des laboratoires
publics ou privés.
Micrometeorite mass flux measurement at Dome C,
Antarctica
J Rojas, J. Duprat, C. Engrand, E. Dartois, L. Delauche, J Carillo-Sánchez, J.
Plane
To cite this version:
J Rojas, J. Duprat, C. Engrand, E. Dartois, L. Delauche, et al.. Micrometeorite mass flux
measure-ment at Dome C, Antarctica. 50th Lunar and Planetary Science Conference 2019, Mar 2019, The
Woodlands, Texas, United States. 2019. �hal-02355001�
MICROMETEORITE MASS FLUX MEASUREMENTS AT DOME C, ANTARCTICA. J. Rojas1 J. Duprat1,
C. Engrand1, E. Dartois2. L. Delauche1, J. D. Carillo-Sánchez3, J. M. C. Plane3 , 1CSNSM, CNRS/Univ. Paris Sud,
Univ. Paris-Saclay, Bat 104, 91405 Orsay, France (Julien.Rojas@csnsm.in2p3.fr), 2ISMO, CNRS/Univ. Paris Sud,
Univ. Paris-Saclay, Bat 520, 91405 Orsay, France, 3School of Chemistry, University of Leeds, Leeds LS2 9JT, UK.
Introduction: Extraterrestrial mass input on Earth
is largely dominated by particles in the 30-300 µm di-ameter range [1-2]. Measuring the size distribution of incoming particles in this range requires the combina-tion of complementary techniques such as infrared ob-servations of the Zodiacal Cloud [3], dust detectors in space [1], deep sea sediment measurements [4], and sample recovery campaigns in polar ice caps [5-8]. We present here an estimation of the extraterrestrial mass input that reaches Earth surface as particles (i.e. mi-crometeorites) based on the CONCORDIA collection and compare the measurements with simulations of the atmospheric entry of interplanetary dust [9]. We then used the inferred mass distributions to perform numeri-cal simulations to evaluate the dependence of such measurements on the exposure parameter (i.e. the area-time product expressed in m².yr).
Samples & Methods: Micrometeorites were
col-lected in the vicinity of the French Italian CONCORDIA station (S 75°, E 123°) located 1100 km inland on the high Antarctic plateau at Dome C (DC). Its specific location offers unique conservation condi-tions for micrometeorites against aqueous alteration as well as anthropic and terrestrial contaminations [10]. The set of micrometeorites presented in this work was collected during 3 field campaigns (2002, 2006, 2016). Ultra-clean snow was extracted from trenches at depths ranging from 3 m to 8 m, corresponding to times (~ 1950-60) before the establishment of the station. The snow was melted using a dedicated stainless steel dou-ble tank melter. The melter is a closed system and for each melt the volume of water was measured. The ex-posure parameter of a melt can be inferred from its volume of water considering the average local precipi-tation rate. Past studies have determined the precipita-tion rate to be stable over the last decades and equal to 3.5±0.1 g.cm-2.yr-1 at DC [11]. The snow melt water
was sieved with a 30 µm mesh filter without pumping to avoid mechanical stress on the micrometeorites. The duration of the exposure of particles to water was lim-ited to 1 to 48h. We selected melts where the volume of water of each melt was ranging from 170 to 2100 liters. We manually handpicked under a binocular mi-croscope the particles in each filter, setting aside only obvious terrestrial contaminations (mainly fibers and plastic chips arising from the collect means). Optical pictures of all the extracted particles were taken and their long and short axes measured. The particles were subsequently fragmented and analyzed with a Scanning
Electron Microscope equipped with an Energy Disper-sive X-ray Spectrometer to obtain their major element compositional pattern and assess their extraterrestrial origin. For this study, we considered two types of ex-traterrestrial particles: unmelted MicroMeteorites (MMs) and Cosmic Spherules (CS, spherical melted grains).
The flux values were corrected for recovery effi-ciency that was monitored by introducing in the melter a given number of small (i.e. 50-100 µm and 100-400 µm) colored particles before the melting, and counting them on the filter after sieving, during the particle ex-traction procedure. The inferred average recovery effi-ciency was close to unity (90 ± 10)% and we did not observe any significant efficiency variations from one melt to another nor between the two size ranges of the calibration particles.
A comprehensive search for all extraterrestrial par-ticles was performed in 3 melts for both MMs and CSs plus 1 additional large melt where only MMs were fully extracted. This selected sub-set contains a total of 657 MMs with size ranging from 17 µm to 330 µm extracted from a total weight of snow of ~ 3600 kg (i.e. a total equivalent exposure parameter of 102 m2.yr).
The extraction of CSs leads to a total of 328 particles with size ranging from 25 µm to 230 µm, from a total weight of snow of ~ 2400 kg, corresponding to an equivalent exposure parameter of 69 m2.yr. The
recov-ery of particles with equivalent diameters lower than the size of the filter mesh (30 µm) is due to the irregu-lar shape of the particles and/or trapping within the few textile fibers that accumulated in the filters. The num-ber and inferred mass of MMs or CSs per kg of snow is similar in each melt, and this value is higher than that recorded in filters where only partial sorting was per-formed, confirming the comprehensive extraction of both MMs and CSs in this sub-set.
Beside these 4 selected melts, we also report here the results from additional melts in which we extracted and characterized 623 MMs and 480 CSs. The size distribution of the particles from the full data set was found to be similar to that obtained with the selected melt sub-set indicating that the extraction from the ad-ditional dataset did not favour a specific size range. We normalized the size distribution of the additional melts to that of the selected melts in order to obtain size dis-tributions including all the particles available.
Dynamical simulations were performed to model the motion and structural evolution of extraterrestrial
1968.pdf 50th Lunar and Planetary Science Conference 2019 (LPI Contrib. No. 2132)
particles from the interplanetary medium to the Earth surface. For this purpose, the Chemical Ablation MODel (CABMOD) was combined with the Zodiacal Cloud Model (ZoDy), which is constrained by IR ob-servations made by the IRAS and PLANCK satellites [9].
Results & Discussion: The global DC mass flux
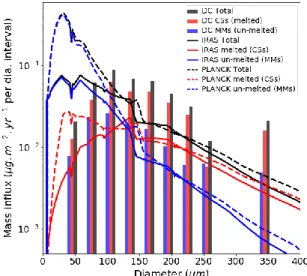
distribution was calculated assuming an average densi-ty of 1.5 for MMs and 3 for CS (Figure 1), leading to an integrated mass influx of 3.9 ± 1.0 µg.m-2.yr-1 for
MMs and 8.5 ± 2.0 µg.m-2.yr-1 for CSs. Scaled to the
entire Earth’s surface these fluxes represent 2,000 ± 500 tons.yr-1 for MMs, 4,400 ± 1,000 tons.yr-1 for CS
and a total mass input of 6,400 ± 1,100 tons.yr-1. The
CS distribution peaks at a particle size around 120 µm, whereas the MM distribution peaks at slightly lower sizes (~90 µm). For large particles (above ~150 µm) the mass influx is dominated by CSs. For smaller parti-cles (below ~ 100 µm) the contributions of MMs and CSs are comparable within uncertainties.
Figure 1 : Mass distribution of particles collected in Dome C (DC) snow (total, melted, and unmelted) compared to expectations inferred from IRAS and PLANCK observations. Data are plotted using 30 µm bin widths for DC and 1 µm bin widths for IRAS and PLANCK (the ordinates are normalized to the bin width).
The mass inputs deduced from IRAS are 3,500 tons.yr-1 for unmelted particles (MMs) and ~1,900
tons.yr-1 for melted (CSs) whereas the inputs deduced
from PLANCK are 10,100 tons.yr-1 for MMs and 2,500
tons.yr-1 for CSs. Given the overall uncertainties, there
is a reasonable match, within a factor of 2, between the integrated flux of both melted and unmelted particles measured at DC and that inferred from IRAS. By
con-trast, the integrated flux inferred from PLANCK data is close to that of DC only for melted particles but well above for unmelted particles, by about a factor of 5. Both dynamical simulations tends to predict a substan-tially greater amount of unmelted particles (mainly carried by MMs with sizes < 100 µm) than observed in DC measurements.
We used the Dome C mass distributions to model the dependency of the measured flux with the exposure parameter. The results reported in Figure 2 show that flux estimations based on exposure parameters lower than 10 m².yr will over- or under-estimate by at least 20% the real flux input in more than 50% of the cases. Exposure parameters above 100 m².yr are mandatory to limit the statistical errors to less than 10%.
Figure 2 : Numerical simulation of the median values
of the Measured/True fluxes ratio against exposure parameter. Red and blue are the 25-75% and 10-90% quantiles.
Acknowledgements: This study was funded by the
ANR project OGRESSE and COMETOR, DIM-ACAV, CNRS (Defi Origines), CNES, PNP and PCMI. The collection of MMs at CONCORDIA sta-tion was supported by IPEV and PNRA.
References: [1] Love, S.G. and D.E. Brownlee,
Science 1993. 262: 550-553. [2] Plane, J.M.C., Chem. Soc. Rev. 2012. 41: 6507-6518. [3] Nesvorny, D.,
AAS/Div. Planet. Sci. Meeting #41. 2009. [4]
Peucker-Ehrenbrink, B. GCA 1996. 60: 3187-3196. [5] Maurette, M., et al., Nature 1987. 328: 699-702. [6] Taylor, S., et al., Nature 1998. 392: 899-903. [7] Yada, T., et al., EPS 2004. 56: 67-79. [8] Duprat, J., et al., Meteoritics 2006. 41: 5239. [9] Carrillo-Sánchez, J.D., et al., GRL 2016. 43: 11,979-11,986. [10] Duprat, J., et al., Adv. Space Res. 2007. 39: 605-611. [11] Petit, J.R., et al., JGR 1982. 87: 4301-4308.
1968.pdf 50th Lunar and Planetary Science Conference 2019 (LPI Contrib. No. 2132)