Université de Québec
Institut National de la Recherche Scientifique Énergie Matériaux Télécommunications
THE INVESTIGATIONS OF HOST/GUEST
STRUCTURES BASED ON COVALENT ORGANIC
FRAMEWORKS AT SOLUTION/SOLID INTERFACES
Daling Cui
Thèse présentée pour l’obtention du grade de Philosophiæ Doctor (Ph.D.)
en Sciences de l’énergie et des matériaux
Members Du Jury
Director of research: Prof. Federico Rosei, INRS-EMT, Université of Québec Examinateur interne: Prof. Andreas Ruediger, INRS-EMT, Université of Québec Examinateur externe: Prof. Louis Cuccia, Université de Montréal
I
ABSTRACT
Covalent organic frameworks (COFs) have gained significant attention in many applications due to their porous crystalline structures with high architectural and chemical robustness and customized topologies. A high-quality extended two-dimensional (2D) hexagonal porous COF-1 network can be obtained through cyclocondensation of three 1,4-benzenediboronic acid (BDBA) monomers by using excess water as the chemical-equilibrium-manipulating agent on a highly oriented pyrolytic graphite (HOPG) substrate. The surface-confined COF-1 can be used as template to recognize different guest molecules, allowing formation of a host/guest (H/G) structure. The intrinsic features of H/G structures lead to their wide applications in molecular recognition, catalysis, gas storage, separation and directed crystallization. Driven by the potential applications, the present work in this thesis concentrates on the preparation and properties of H/G structures based on COF-1 templates at the solution/solid interface.
Firstly, scanning tunneling microscopy (STM) images show that the surface-supported two-dimensional COF-1 can act as a host architecture for C60 fullerene molecules,
predictably trapping the molecules under a range of conditions. C60 adsorbs in the
COF-1 template in two different sites, the top-site (T) and the pore-site (P). The fullerenes occupy the COF-1 lattice at the heptanoic acid/HOPG interface, and in dried films of the COF-1/fullerene network that can be synthesized through either
II
drop-deposition of fullerene solution or by a dipstick-type synthesis in which the surface-supported COF-1 is briefly dipped into the fullerene solution.
COF-1 can be synthesized from different solvents. When 1,2,4-trichlorobeznene (TCB) is used, STM images reveal the adsorption of TCB in the hexagonal pore of COF-1 template at TCB/HOPG interface. A well-defined loop boundary formed by a chain of pentagonal and heptagonal pores allowed us to investigate the effect of pore shape and size on TCB adsorption, suggesting that both geometrical and size effects are important in binding the TCB. When both C60 and TCB are present at the
TCB/HOPG interface, TCB molecules are selectively trapped in the pore-site, whereas fullerenes adsorb on the top-site of COF-1. While the former structure is stabilized by Cl…H hydrogen bonds, the latter is controlled by van der Waals (vdW) interactions. These results suggest that surface-supported 2D porous COFs can selectively bind different molecules at specific sites via different types of interactions and COFs may offer a powerful platform for the recognition and patterning of guest molecules.
Moreover, a 2D COF-1 can template solution-processed C60 guest molecules to form
several solvent-dependent structural arrangements and morphologies via a 2D to 3D growth process. When TCB is used as solvent, C60 molecules form a template-defined
close packed structure. When heptanoic acid is used as solvent, a range of lower density architectures that deviate from the template-defined close packing are observed. This difference is attributed to the co-adsorption of the heptanoic acid
III
solvent molecules, which is only achieved in the presence of the template. This work demonstrates the possibility to precisely control molecular self-assembly to form designed 3-dimensional (3D) structures through the synergistic combination of template and solvent effects.
IV
ACKNOWLEDGEMENTS
Foremost, I would like to thank my supervisor, Prof. Federico Rosei for the continuous support of my Ph.D study and research activities. He has created a warm and free research environment allowing me to explore my interest in a forefront and fascinating scientific field. Without whom, I could not have made it possible. Being able to study under his supervision is one of the most important achievements in my life.
I would like also to express my sincere gratitude to Dr. Jennifer M. Macleod and Dr. Maryam Ebrahimi. They have made vital contributions to most of my work and given me invaluable help and comments on my research and thesis writing.
I also acknowledge Prof. Dmitrii Perepichka, from McGill University, for the comments and discussions and Dr. Catalin Harnagea for the assistance in the maintenance of STM facilities and Dr. Josh Lipton-Duffin for the design and production of the reactor.
I would like to also thank my colleagues, Fabrizio De Marchi and Gianluca Galeotti, for their help throughout the duration of my Ph.D. I would like to thank Sarah Xing for the translation of french section.
I am grateful to all my friends who have made the last five years so enjoyable: Shun Li, Yue Huang, Wei Huang, Haiguang Zhao, Xin Chai, Fan Yang, Qingzhe Zhang, Mengyang Fan, Joyprokash Chakrabartty, Chao Wang, Qiliang Wei, Xin Tong, Yufeng Zhou et al.
V
VI
CONTENTS
ABSTRACT ... I ACKNOWLEDGEMENTS ... IV LIST OF TABLES ... IX LIST OF FIGURES ... X Chapter 1.Introduction ... 11.1. Molecular self-assembly on 2D surfaces ... 1
1.2. Covalent Organic Frameworks ... 12
1.3. Host/Guest chemistry based on 2D templates ... 17
1.4. Thesis objectives and organizations ... 25
Chapter 2.Experimental techniques ... 27
2.1. COF synthesis on HOPG and guest molecule ... 27
2.2. Scanning Tunneling Microscopy (STM) ... 31
Chapter 3.Solution and air stable host/guest architectures from a single layer covalent organic framework ... 38
3.1. Introduction ... 38
3.2. Results and discussions ... 40
3.3. Conclusions and perspectives ... 47
3.4. Experimental methods ... 48
3.5. Calculations ... 50 Chapter 4.Selective binding in different adsorption sites of a 2D covalent organic
VII
framework template ... 53
4.1. Introduction ... 53
4.2. Results and discussions ... 55
4.3. Conclusions and perspectives ... 64
4.4. Experimental methods ... 65
4.5. Calculations ... 66
Chapter 5.Control of fullerene crystallization from 2D to 3D through combined solvent and template effects ... 71
5.1. Introduction ... 71
5.2. Results and discussions ... 75
5.2.1. C60 self-assembly at heptanoic acid/HOPG interface ... 77
5.2.2. Identification of the solvent co-adsorption effect ... 86
5.2.3. Additional solvent effects on film packing and morphology ... 96
5.3. Conclusions and perspectives ... 100
5.4. Experimental methods ... 101
5.5. Calculations ... 103
5.5.1. COF-1/graphene bilayer... 104
5.5.2. C60 molecules adsorbed on COF-1/graphene bilayer... 105
5.5.3. Bader charge calculation ... 111
5.5.4. Solvent molecule (heptanoic acid) adsorption on COF-1/graphene bilayer... 111
VIII
5.5.5. The co-adsorption of heptanoic acid in shift structures and
template defined close packing structures ... 113
Chapter 6.Conclusions and perspectives ... 116
6.1. Conclusions ... 116 6.2. Perspectives ... 119 Appendix A Abbreviations ... 122 Appendix B RÉSUMÉ ... 125 L’Introduction ... 125 Résultats et discussions ... 131 Conclusions ... 150 References ... 153
IX
LIST OF TABLES
Table 1.1 Intermolecular interactions of self-assembly24 ... 7
Table 4.1 Van der Waals radii140 and calculated inter-atom distance* ... 70
Table 5.1 The adsorption and total cohesive energy of 2D-to-3D growth of C60 (1st,
2nd, and 3rd layer of C60 formed of one, two, and three C60 molecular layers,
respectively) on COF-1/graphene bilayer ... 110
Table 5.2 The Bader charge for top-site and shift structures ... 111
Table 5.3 Adsorption energy of one heptanoic acid at three adsorption sites ... 112
Table 5.4 Total cohesive energies of T-layer C60, shift structures and template-defined
X
LIST OF FIGURES
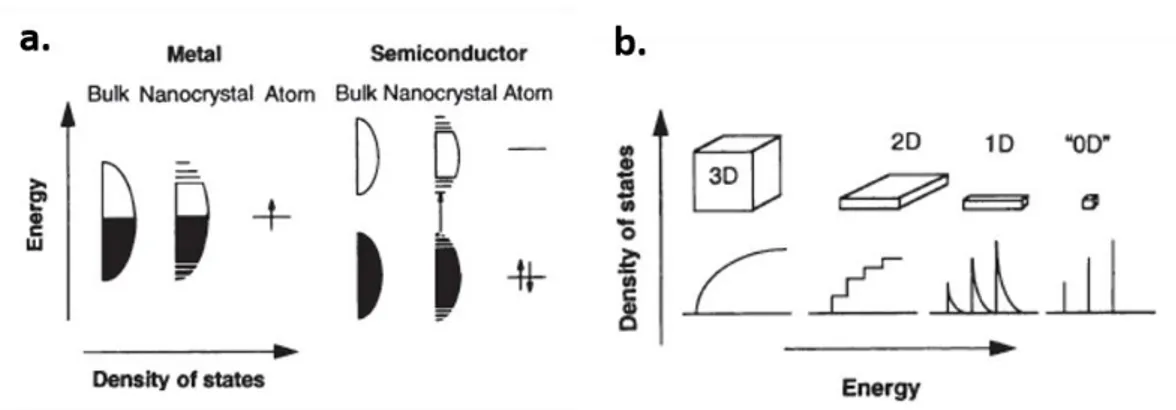
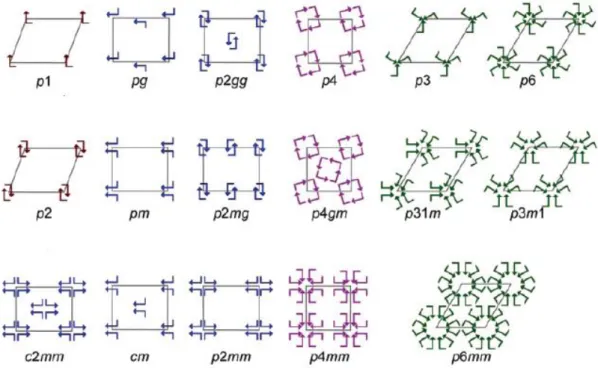
Figure 1.1 (a) Schematic representation of change in the density of state in one band according to the size of material (metal and semiconductor). (b) The density of state in one band of a semiconductor as a function of dimension. Reproduced with permission from the Science.4 ... 2 Figure 1.2 Two methods (top-down vs bottom-up) to produce matter at the nanoscale. Top-down methods, such as lithography, writing or stamping, are used to define the desired features. The bottom-up techniques use self-processes to produce ordered patterns of supramolecular or solid-state architectures from the atomic to the mesoscopic scale. Reproduced with permission from the Nature Publishing Group.5 . 3 Figure 1.3 Schematic illustration of the possible 17 plane groups in 2D, describing the symmetry of monolayer molecular self-assembly. An arrow indicates each asymmetric unit, and unit cells are denoted with gray lines. Reproduced with the permission from American Chemical Society.15 ... 5 Figure 1.4 (a) STM image of self-assembly of C18ISA molecules at 1-octanol/graphite
interface. The value of ∆L1 corresponds to interdigitated C18ISA, identical with the
one in (c).The value of ∆L2 corresponds to the width of the lamella formed by
1-octanol molecules. Image size is 10 × 10 nm2. (b) Molecular model represents the area indicated in (a). The unit cell for 1-octanol molecules coadsorption in two-dimensional packing of C18ISA molecules was proposed. (c) STM image of
XI
10.7 × 10.7 nm2. (d) Molecular model represents the area indicated in (c), showing no
solvent coadsorption. Reproduced with the permission from American Chemical Society. 33... 9 Figure 1.5 (a) (Top) The STM image and models for chickenwire structure of TMA. STM image was collected at the heptanoic acid/HOPG interface. Image size: 15×15 nm2. (Bottom) The STM image and models for flower structure of TMA. STM image
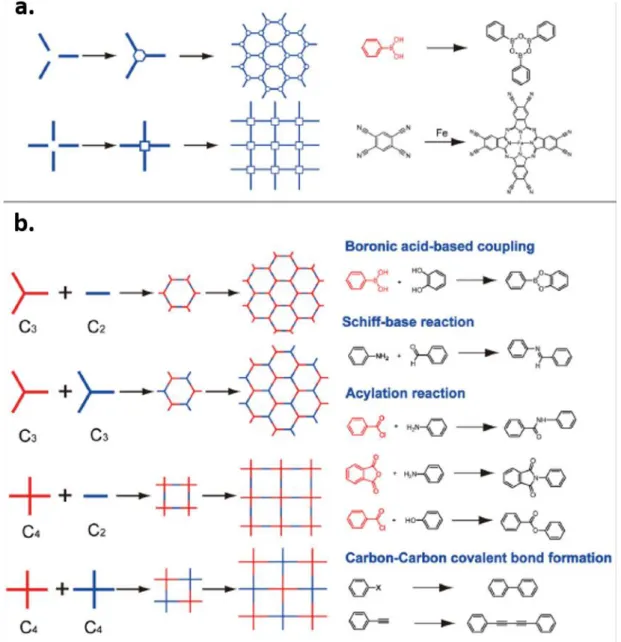
was collected at the pentanoic acid/HOPG interface. Image size: 15×15 nm2.38 (b) Schematic representation of the seeding process for the oblique pattern (left) and the chickenwire motif (right) with the BTB dimer as the repeating unit forming. The count represents the number of polar functional groups exposed to the solvent, and those in the brackets represent the number of BTB molecules involved in the assembly. (c) Schematic representation of the properties for the series of alkanoic acids from butanoic to nonanoic acid and the respective interfacial monolayer polymorphs. Reprodiced with the permission from American Chemical Society. 37 ... 11 Figure 1.6 (a) The “node” approach for synthesis of 2D COFs. Examples are given on the right: cyclocondensation of three boronic acids molecules and tetramerization of four 1,2,4,5-tetracyanobenzene (TCNB) molecules with one Fe atom. (b) The spacer approach for synthesis of 2D COFs according to the symmetries of builders. Corresponding examples are given on the right for the construction of 2D COFs: the condensation reaction between boronic acids and diols, the Schiff-based reaction, polyamide formation, polyimide formation, polyester condensation, Ullmann coupling,
XII
and Glaser coupling. Reproduced with the permission from Wiley.42 ... 13 Figure 1.7 Enthalpic diagram showing the different transition states during polymerization reaction. The energies (in eV) are relative to the monomers. After each transition, a water molecule is released (arrows).Reproduced with the permission from Wiley.47 ... 15 Figure 1.8 Synthesis of high-quality 2D COF-1 monolayer polymers. (a) BDBA monomer self-condenses onto crystalline metal surfaces in UHV to form COF-1 monolayer which containing various pentagonal and heptagonal ring defects (middle). The improvement in the order of the film can be initiated through annealing this film in a humid environment (right). (b) Pre-prepared COF-1 nanocrystals in solution were dropcasted onto HOPG surface (middle). Similar annealing can provide a monolayer with improved long-range order (right). Reproduced with the permission from the Nature Publishing Group.51 ... 16 Figure 1.9 (a) Schematic of conjugated oligothiophene macrocycle, which is intrinsically porous. (b) STM image of a monolayer of macrocycles on HOPG. The adsorption of C60 is indicated with white arrow. Image area: 11.6 nm× 8.7 nm;
Scanning conditions: V=-700 mV, I = 44 pA. (c) Calculated model of a closely packed monolayer of assembled template with intrinsic porous host molecules with a hexagonal arrangement. Inset picture exhibits side view of the calculated energy minimum conformation of a oligothiophene-C60 complex. Reproduced with the
XIII
extrinsically porous. TMA molecules are drawn with the vdW surfaces of the atoms. The extrinsic single cavity stabilized by hydrogen bonds is indicated in the right enlarged sketch. (e) STM constant current image of the TMA-C60 host-guest structures.
The diameter of the pores is 1.1 nm, and the unit cell of the hexagonal network is a=b=1.6±0.1 nm and γ=60±1° as depicted in the upper right corner. The adsorption of two C60 molecules inside the pores of the TMA host network appear as
bright protrusions. Image dimensions: 10 × 10 nm2. Reproduced with the permission from American Chemical Society. 55 ... 18 Figure 1.10 The chemical structures of the NN4A and guest molecules: (a) NN4A, (b) coronene, (c) C60. (d) The STM image of coronene/C60/NN4A ternary architecture at
alternate bias and current. Image dimensions: 41×41 nm2 The line at which the bias changed is marked by a green arrow. The scanning conditions of upper area and lower one are I=1055 pA, V=516 mV and I=128 pA, V=968 mV, respectively. (e) A molecular model of coronene and C60 molecules co-adsorbed on NN4A networks.
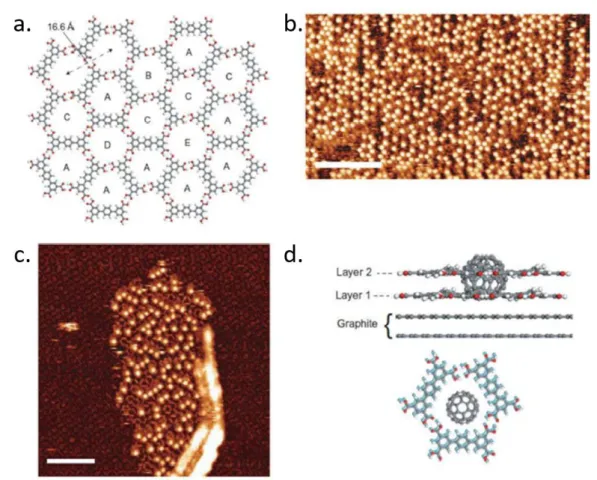
Reproduced with the permission from Wiley.63 ... 21 Figure 1.11 Graphic representation of a FET chemical sensor.71 ... 22 Figure 1.12 (a) Schematic illustration of the random rhombus tiling formed by the terphenyl-3,3'',5,5''-tetracarboxylic (TPTC) acid framework. Different hexagonally ordered network of pores is highlighted by A-E. (b) STM image of TPTC network after a deposition of C60. The locations of C60 are visible as bright spots in the image and
XIV
TPTC bilayer immediately collected after C60 deposition. The co-adsorption structure
of C60 and bilayer TPTC framework can be identified. The first layer of TPTC
framework is visible with an altered contrast and the second TPTC molecules appear with the long axis of the molecules as bright, rod-like features. Scale bar: 11 nm. (d) Schematic representation of the co-adsorption of C60–bilayer structure consisting of
two overlying pores of type A. Reproduced with the permission from the Nature Publishing Group. 79 ... 24
Figure 2.1 (a) The scheme of COF-1 and the chemical reaction for synthesizing template: self-condensation of BDBA monomers gives rise to 2D COF-1 template wherein defects are recovered through the reversible reaction that occurs in the presence of water. The scheme of the boroxine ring is enlarged in the inset circle.80 (b)
The schematic illustration of the setup of synthesizing COF-1 on HOPG substrate... 27 Figure 2.2 STM image of HOPG. Image dimensions: 4.2×4.2 nm2. Tunneling conditions: V=-19 mV, I= 1000 pA. The hexagonal lattice constant of HOPG is 0.246 nm. ... 29 Figure 2.3 Scheme of C60 guest molecule. ... 30
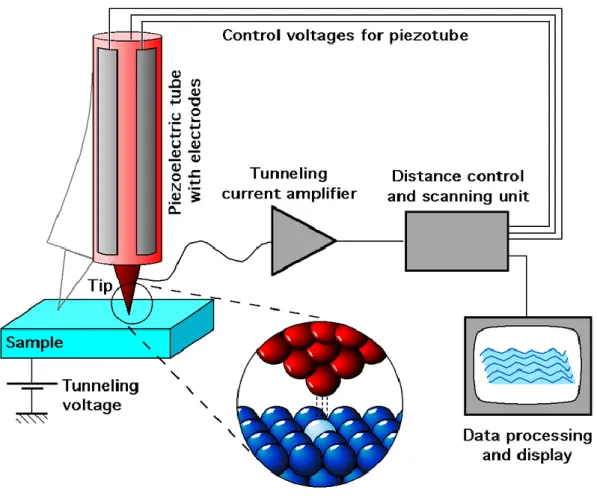
Figure 2.4 Schematic diagram of the scanning tunneling microscopy, produced by Michael Schmid and Grzegorz Pietrzak, and used under CC BY-SA 2.0 AT. ... 32 Figure 2.5 An illustration of STM mechanism: the one-dimensional metal-vacuum-metal tunneling junction. The sample (left) and the tip (right) are modeled as semi-infinite pieces of free-electron metal. The work function is
XV
represented as , defined as the minimum thermodynamic work required to remove an electron from the bulk to the vacuum level. Neglecting the thermal excitation, the Fermi level, EF, is the upper limit of the occupied states in a bulk metal. Here, the
work functions of tip and sample are assumed to be equal. The bias voltage leading to the realignment of Fermi levels of sample and tip is represent as eV. The spatial width of vacuum (energy barrier) is indicated as S.90 ... 33 Figure 2.6 The Bardeen approach of tunneling theory.90 ... 35
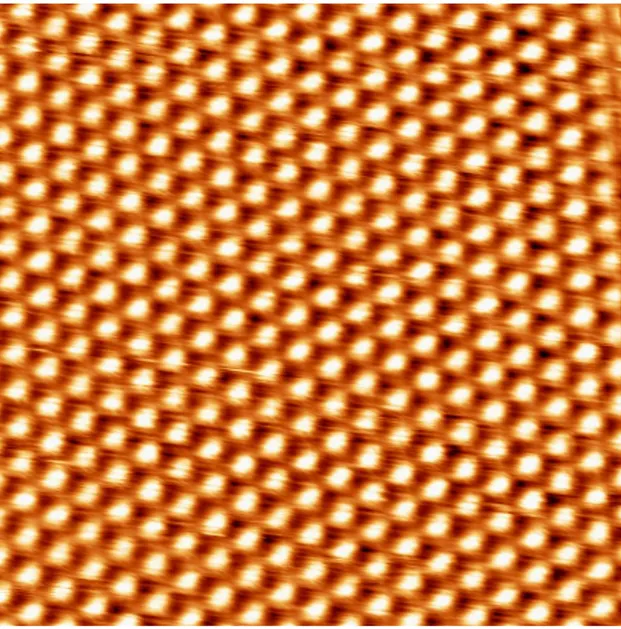
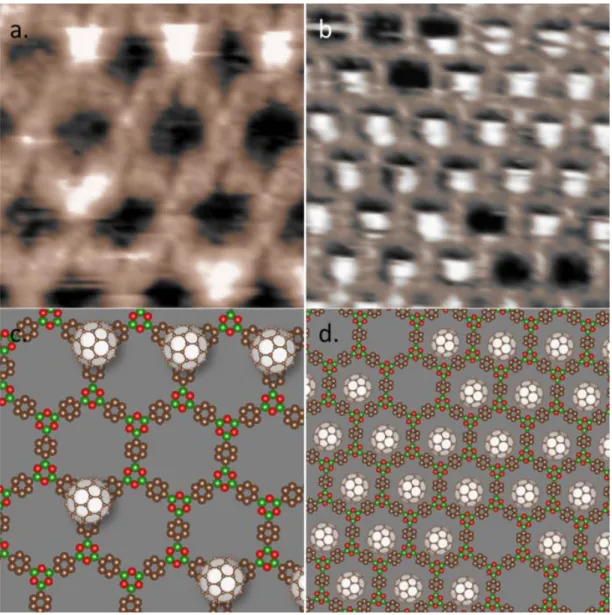
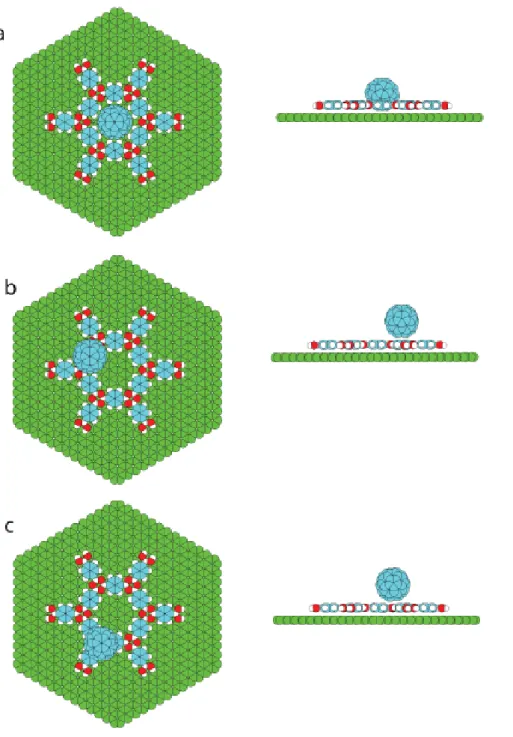
Figure 3.1 (a) Image revealing molecular resolution of the COF-1 structure (top) and atomic resolution of the underlying HOPG (bottom). Image conditions: bias voltage V=-800 mV, tunneling current I=100 pA (top); V=-19 mV, I=1000 pA (bottom). (b) Autocorrelation of the image shown in (a). The small lattice (HOPG) and the large lattice (COF-1) have a clear commensurate relationship. The COF-1 aligns with the HOPG along both lattice directions, with each unit vector having an identical length of six HOPG lattice constants. ... 40 Figure 3.2 H/G structures at the solution/solid interface. The images in (a) and (b) show the observed fullerene adsorption geometries, denoted as top site and pore site, respectively. The structures in (c) and (d) show proposed models for these adsorption sites. Scanning conditions: bias voltage V=-800 mV, tunneling current I=100 pA. Image widths (a) 5.3 nm and (b) 7.7 nm. ... 42 Figure 3.3 Consecutive STM images of H/G architecture: (a) the starting geometry with a small domain of C60 guest molecules inside the host template; (b) final
XVI
geometry in the same area with C60 molecules in a new distribution which
demonstrates a transfer of guest molecules induced by STM tip. Image width: 8.5 nm. Scanning conditions: bias voltage V=-800 mV, tunneling current I=100 pA. ... 44 Figure 3.4 H/G structures at the air/solid interface. The images in (a) and (b) show top site adsorption and image in (c) shows pore site adsorption, respectively. (a) shows an isolated fullerene molecule and (b) is a stable domain of top site adsorption of C60 molecules at air/solid interface. Imaging parameters: voltage
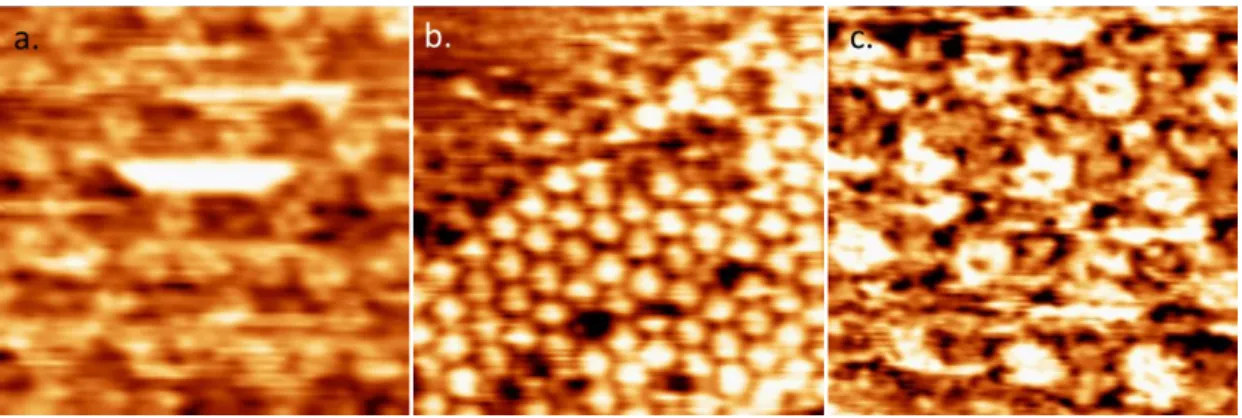
V=-800 mV, tunneling current I=100 pA. Image width: (a) 5.6 nm (b) 17.2 nm (c) 5.4 nm. ... 45 Figure 3.5 Schematic illustration of dipstick synthesis of COF-1/fullerene H/G structure. The image in (b) shows the as-synthesized COF-1 on HOPG. Following immersion into a solution of C60 in heptanoic acid (a) and subsequent drying, STM
images like that in (c) reveal COF-1 populated with C60 guest molecules. Imaging
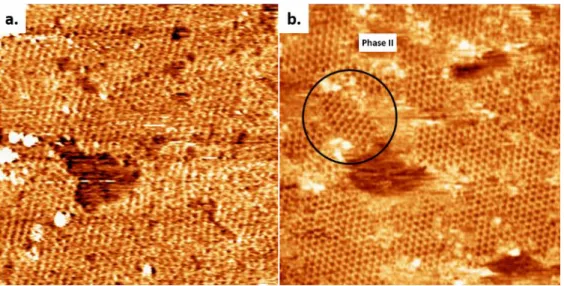
parameters: voltage V=-800 mV, tunneling current I=100 pA. ... 46 Figure 3.6 molecular mechanics calculated geometries for pore site adsorption (a), top site adsorption over a phenyl ring (b) and top site adsorption over a boroxine ring (c). Oxygen atoms are represented by red, carbon atoms (fullerene and COFs) are represented by blue and carbon atoms (graphite) are represented by green. ... 52 Figure 4.1 (a) STM image of COF-1 synthesized in TCB, collected at the air/solid interface. Image width: 60 nm. Scanning conditions: V= -1000 mV, I= 100 pA. (b) STM image of COF-1 synthesized in heptanoic acid, collected at the interface of
XVII
heptanoic acid and HOPG. A small domain of Phase II is marked by black circle. Image width: 60 nm. Scanning conditions: V= -800 mV, I=100 pA. ... 55 Figure 4.2 (a) COF-1 STM image showing the grain boundary consisting of pentagon and heptagon rings, connecting two domains rotated by 30±1º with respect to one another, as shown by the dashed and solid black lines. The image was collected at the interface of TCB and HOPG. Image width: 15 nm. Scanning conditions: V= -1000 mV, I= 100 pA. (b) The epitaxy of COF-1 and HOPG at grain boundary region. Phase I: a1= a2= 1.476 nm; Phase II: b1= b2=1.42 nm. Image width: 9.6 nm. (c) Schematic
structure of the rotational grain boundary identified in (b), i.e., a loop defect with C6
symmetry. Five- and sevenfold rings are shaded by blue and green, respectively. (d) Line profile of the measured height along the black solid line in (a). The positions of benzene rings in COF-1 are marked as × and the positions of adsorbed TCB molecules are marked as ○. ... 56 Figure 4.3 (a) The detailed STM image of one TCB molecule adsorbing into the hexagonal ring formed by COF-1. Image width: 2.1 nm. Scanning conditions: V= -1000 mV, I= 100 pA. (b) DFT-calculated structure of one TCB in hexagonal pore (M06-2X/LANL2DZ). Dashed blue and black lines represent the interactions of Cl…H and Cl…O, respectively. ... 58 Figure 4.4 (a-c) The sequential collection of STM images showing the evolution of adsorption of TCB in the grain boundary defects. Different geometries are marked by different dashed color circle: heptagonal ring (green circle); hexagonal ring (red
XVIII
circle); pentagonal ring (blue circle). Image width: 5.8 nm. Scanning conditions: V= -1000 mV, I= 100 pA. ... 60 Figure 4.5 (a) The top-site selective formation in C60/COF-1 system. Image width: 12
nm. Scanning conditions: V = -800 mV, I = 100 pA. (b) Schematic image of top-site selective formation in C60/COF-1 system. The shaded blue circles over benzene rings
represent the closed packed background in STM image. Top-site C60 molecules are
placed over boroxine rings, corresponding to the large bright spots in (a). ... 62 Figure 4.6 (a) Molecular electrostatic potential (ESP) map (M06-2X/LANL2DZ) for isolated TCB in the gas phase (3D view). (b) Molecular ESP map of optimized geometry (M06-2X/LANL2DZ) for TCB in COF-1 hexagonal pore. The ESP maps for a and b are expressed in atomic units (a.u., Rydberg/e) on 0.0004 e/Bohr3 and 0.004
e/Bohr3 isodensity surfaces, respectively. The color scale from blue (+ve) to red (−ve) spans the following ranges: ±0.01 a.u. for both a and b. (c) Optimized geometry of one TCB in hexagonal pore (M06-2X/LANL2DZ), with marking the distances of Cl…H (dashed blue line) interatomic contacts. (Only showing the distances less than the sum of the vdW radii for Cl…H contacts) ... 67 Figure 4.7 Indicative geometry for TCB in pentagonal pore. All H…H distances between hydrogens on the TCB molecule and hydrogens on the COF-1 pore are below 2 vdW radii for hydrogen (2rH=2.4 Å),140 suggesting that the TCB molecule cannot be
accommodated in a planar adsorption geometry in the pentagonal pore. ... 68 Figure 4.8 Optimized geometry for two TCB molecules in a heptagonal pore. This
XIX
geometry allows for Cl…H (dashed blue line) interactions between the TCB and the COF-1 pore as well as Cl…Cl (dashed green line) interactions between the two TCB molecules. However, bond distances for Cl…H interactions are shorter than expected (i.e., shorter than the optimized distances found for a single TCB in a hexagonal pore, see Table 4.1), and unfavourably short H…H (dashed brown line) interactions exist between hydrogen atoms on the TCB molecules and the COF-1 pore (i.e., distances shorter than 2rH=2.4 Å). These closer interactions suggest that perhaps the epitaxial
heptagonal pore is expanded somewhat from the gas-phase dimensions reflected in this geometry. The inter-atom distances for Cl…Cl, Cl…H and H…H are marked accordingly. (Only showing those less than the sum of the vdW radii) ... 69 Figure 5.1 (a) Sub-molecularly resolved COF-1 template STM image collected at air/solid interface. Tunnelling conditions: V=-800 mV, I=100 pA. Image dimensions: 7.1×7.1 nm2. (b) Schematic image of honeycomb COF-1 with unit cell shaded blue and a boroxine ring together with three neighbor benzenes specified with dashed black circle. DFT optimized top-site (c) and pore-site (d) positioning of a guest C60
molecule within the COF-1 host. The substrate graphene bilayer has been omitted for better visibility. Detailed simulation results are given in calculation section. ... 75 Figure 5.2 (a) STM image with P-T bilayer structure collected at the heptanoic acid/HOPG interface. Tunnelling conditions: V=-776 mV, I=42.25 pA. Image dimensions: 19×19 nm2. (b) STM image collected at the heptanoic acid/HOPG interface showing quasi-HCP triple layer structure and R1T layer shifts in A and B
XX
patterns. Tunnelling conditions: V=-800 mV, I=33 pA. Image dimensions: 15.4×15.4 nm2. (c) The schematic image corresponding to (b). Different architectures are marked by indicators. (d) Model of the P-T bilayer. (e) Model of the quasi-HCP triple layer structure. The two fullerene molecules marked with “1” are adsorbed in the quasi-same position. (f) Models of the shift of a single R1T layer molecule with respect
to the T layer in A and B patterns. (g) The DFT calculated structure of A-pattern shift, as shown in top view and side view. The relative positions of T-site and R1 C60 are
specified in side view. For a better visualization, the radius of C60 carbon atoms is
enhanced. ... 77 Figure 5.3 A comparision of quasi-HCP (left), HCP (middle) and standard-HCP (right). Similar arguments can also be assigned for the face-centred cubic (FCC) packing. The quasi-structure is associated with the shift behavior of R1 fullerenes (marked 1 in the orange circle) with respect to the given T-layer fullerene (marked 2). Note that, in the quasi-HCP and HCP here, the intralayer C60 molecules are spaced
with a distance of 1.476 nm. This is different from standard-HCP, where all the molecules are spaced in a distance of ~1 nm.165 The standard-FCC close packing C60
can be formed on bare HOPG, see Figure 5.10. ... 79 Figure 5.4 STM images of a single R1 fullerene shift collected at heptanoic acid/solid interface, where the COF-1 lattice is represented by the black honeycomb, and the yellow and orange circles indicate T layer and R1 layer fullerene molecules respectively. (a) A-pattern shift. (b) B-pattern shift. (c) Geometry of the shifts, where
XXI
the epitaxial COF-1 lattice constant is a=1.476 nm according to our previous work. (d) The collective assembly of R1 fullerenes, parallel-shift. Tunnelling conditions: V=-800 mV, I=33 pA. Image dimensions: 6.5×6.5 nm2. ... 80 Figure 5.5 (a) STM image collected at the heptanoic acid/HOPG interface. The black dashed line encloses a region of the crystal with one missing C60 molecule. The inset
image shows the plan view schematic of the black dashed box region, according to the parallel shift model. The white dashed line marks a rotated-shift region. Tunnelling conditions: V=-800 mV, I=100 pA. Image dimensions: 24.4×24.4 nm2. (b) Detailed STM image collected at heptanoic acid/HOPG interface showing a moiré pattern caused by rotation of the R1 layer relative to the underlying T layer. Tunnelling conditions: V=-800 mV, I=100 pA. Image dimensions: 11.8×11.8 nm2. (c) The
schematic image corresponding to (b). Orange circles represent the R1 layer molecules and yellow circles represent the T layer molecules. (d) The schematic image of geometrical considerations of the region (spin centre) enclosed by the dashed box in image (c), showing the geometry of the rotation of the R1 layer relative to the T layer. ... 81 Figure 5.6 Moiré pattern of R1 layer rotated by θ = 26.746° (indicated by lines at the bottom) with respect to the underlying T layer. The vectors of the Moiré pattern t1,
t2 are shown by arrows and labeled accordingly. The lattice vectors a1, a2 of the
underlying T monolayer are sketched at the lower right, where a magnification by a factor 3 is applied for better visibility. Specifically, the region of Figure 5.5b is
XXII
marked by colour of blue in a unit cell, where the centre of spin defined in Figure 5.5c is marked with orange triangle. The calculated model is available in experimental section. ... 84 Figure 5.7 (a) STM image collected at heptanoic acid/HOPG interface showing multiple crystallization geometries for three layer structures. Tunnelling conditions: V=-800 mV, I=200 pA. Image dimensions: 17.3×17.3 nm2. (b) The schematic of (a).
(c) The schematic showing position of the R2 layer relative to the R1 layer. (d) The DFT optimized geometries of A-FCC and A-HCP. Schematic showing the positions of C60 in the T layer (bottom), R1 layer (middle) and R2 layer (top) relative to each other
for an R1 layer with A-pattern shift (e) and B-pattern shift (f). ... 85 Figure 5.8 (a) STM image showing the co-adsorption of heptanoic acid and T-layer C60 collected at the heptanoic acid/HOPG interface. Tunnelling conditions: V=-1000
mV, I=50 pA. Image dimensions: 12×12 nm2. The hexagonal lattice represents the COF-1 template. A single missing C60 is marked by a large black open circle. The
features at the bottom of missing C60 site are assigned as COF-1 template. Three
small bright spots assigned as solvent molecules are marked by small black open circles; similar adsorption occurs throughout the lattice, but has not been indicated to allow clearer visualization of the contrast modulation associated with these features. One site without this small bright feature is marked by a black arrow. (b) Optimized structure of T-layer C60 with co-adsorption of heptanoic acid at both P-site and T-site
XXIII
boroxine rings in the COF-1 template. Only one P-site adsorbed heptanoic acid appears per pore, consistent with the slightly off-centre adsorption of the T-site C60
molecule. For a better illustration of the model matching with the experimental data, scheme (b) has been modified from the actual DFT data by taking off the features missing from the STM image (a). (c) STM image collected at the supernatant (TCB)/HOPG interface. Image dimensions: 9.6×5.4 nm2. Tunnelling conditions:
V=-1000 mV, I=50 pA. Here, R1 C60 adsorbs in a template-defined close-packed
geometry. (d) Schematic of (c) with TCB molecules in the pores of the COF-1 template. The STM images (e and f) showing the co-adsorption of heptanoic acid in T-layer C60
obtained in a same collection. (e) is the forward-scan image and (f) is the backward-scan image. Tunnelling conditions: V=-1000 mV, I=50 pA. Image dimensions: 11.72 ×11.72 nm2. (g, h) are magnified images corresponding to the regions marked by dashed black squares in (e) and (f) respectively. Image dimensions: 2.8 × 2.8 nm2. The black arrows in the images indicate the direction of scan. (f) is also shown in (a). ... 88 Figure 5.9 (a-c) Successive STM images of same region collected from the TCB supernatant/HOPG interface. Image dimensions: 80×80 nm2. Tunnelling conditions:
V=-1200 mV, I=50 pA. (d-f) Successive STM images of same region collected from the heptanoic acid supernatant/HOPG interface. Image dimensions: 60×60 nm2. Tunnelling conditions: V=-800 mV, I=100 pA. The domain morphology of the C60
XXIV
the latter (d-f), individual vacancies vary from image to image, but the overall domain structure and occupancy remains relatively constant. ... 91 Figure 5.10 (a) XRD spectra of bare HOPG (black) and C60 crystal on HOPG (red).
The peak at 2 = 10.8° (d ~ 0.82 nm) corresponds to the (111) face of standard-FCC fullerene (a = 1.42 nm). This is also consistent with (002) of standard-HCP fullerene with a = 1.00 nm and c = 1.64 nm, but in this case we should also observe the weaker (001) reflection at 10.2°. The asterisk indicates the peak from HOPG.174 (b) Scanning electron microscopy image of an asymmetric C60 hexagonal-shaped disk on bare
HOPG, prepared by drop-deposition method with a solution (1.942×10⁻³ M) of C60 in
heptanoic acid. ... 93 Figure 5.11 Schematically illustration of the control of fullerene crystallization from 2D to 3D through combined solvent and template effects. ... 96 Figure 5.12 STM images collected from supernatant solutions of C60. (a) STM image
at the heptanoic acid supernatant/HOPG interface. Tunnelling conditions: V=-1200 mV, I=50 pA. Image dimensions: 60×60 nm2. (b) STM image at the TCB supernatant/HOPG interface. Tunnelling conditions: I=100 pA, V=-800 mV. Image dimensions: 60×60 nm2. (c) Domain size distribution of (b). The coverage (P) of C
60
in STM image is 55.4%. ... 98 Figure 5.13 The optimized geometry of COF-1 on graphene bilayer. ... 104 Figure 5.14 The DFT-calculated geometry for C60 on COF-1/graphene bilayer. (a)
XXV
(d) P-T bilayer C60. ... 106
Figure 5.15 (a) Cartesian coordinate system for off-centred adsorption simulation, where origin is defined as the position of optimized pore-site. X and Y axes represent zigzag and armchair directions of COF-1 template. (b) The plot of energy change of different off-centred positions (along X and Y axes) with respect to optimized centred pore-site position (P-site Table 5.1, which gave -1.59 eV adsorption energy here under the accuracy described above). The distance of each step is 0.5 Å. ... 107 Figure 5.16 The DFT calculated geometry of R1 layer C60 on T
layer/COF-1/graphene bilayer. (a) A-pattern shift. (b) B-pattern shift. (c) A- close packing. (d) B- close packing. ... 108 Figure 5.17 The DFT calculated geometry of R1 and R2 layer C60 on T
layer/COF-1/graphene bilayer. (a) A-FCC architecture. (b) A-HCP architecture. (c) B-FCC architecture. (d) B-HCP architecture. ... 109 Figure 5.18 Optimized structures of adsorption of solvent molecules on COF-1/graphene bilayer. Heptanoic acid adsorbed at the pore-site (a), top phenyl-ring site (b) and top boroxine-ring site (c). ... 113 Figure 5.19 Comparing A-pattern shift (a, b) and A-close packing (c, d) optimized structures in the absence and presence of heptanoic acid molecules (P- and T- sites). The structures shown in (a) and (c) are the same structure as Figure 5.16a and Figure 5.16c, respectively. The height of R1 C60 in (b) is about 0.9 Å lower than (a), and that
XXVI
Figure 6.1 Scheme of (a) C60, (b) C70, (c) Coronene, and (d) Corannulene molecules.
... 119 Figure 6.2 Schematically illustration of binary guest molecule systems in COF-1. (a) The system includes fullerene and coronene guest molecules. (b) The system includes fullerene and corannulene. The planar and curved circulene guest molecules will interact with COF-1 template and fullerene differently. ... 121
1
Chapter 1. Introduction
1.1. Molecular self-assembly on 2D surfaces
Instigated by the famous “Plenty of Room at the Bottom” talk given by Feynman in 1959,1 tremendous work has been devoted over the past few decades to make things small. “Nanostructured materials” are those typically defined by size spanning from subnanometer to several hundred nanometers.2 In this size range, classical and quantum behaviors are mixed and materials can exhibit physical properties different from those of bulk materials; the study of these phenomena is collectively known as nanoscience.3 For example, at the nanometer scale, electronics band structures can be
tuned through quantum confinement effects achieved by varying the size and dimension of nanoparticles (Figure 1.1).4 Another important aspect is that making functional units small can result in a significant decrease in device energy consumption and more efficient production processes. However, even if nanomaterials can exhibit remarkable properties, they can be applied into practical use only if suitable economical nanotechnology is viable. Thus, the development of methods to realize mass-controlled fabrication and integration of functional nanodevices into usable macroscopic systems is essential.
2
Figure 1.1 (a) Schematic representation of change in the density of state in one band according to the size of material (metal and semiconductor). (b) The density of state in one band of a semiconductor as a function of dimension. Reproduced with permission from the Science.4
There are two common methods to generate nanostructured materials and fabricate nanoscale structures in a controlled and repeatable manner, top-down and bottom-up (Figure 1.2).5 Top-down methods impose a structure or pattern on the substrate through an external process. In contrast, bottom-up methods aim to guide the assembly of components into organized structures through processes inherent in the system. The top-down approach includes serial and parallel techniques to create features typically in 2D over a large scale. To date, several excellent top-down-type approaches including photolithography and scanning beam lithography have been used to produce nanostructures.6 However, these conventional techniques have the limitations which have restricted their applicability, such as the high capital and operating costs in accessing the facilities and a general paucity of applicable materials. Moreover, as device features advance through the sub-10-nm regime, these top-down
3
approaches have begun to approach their resolution limit.7 The physical limits of
defining nanoscale features is also problematic for future size reductions in nanostructures; for example a layer of silicon dioxide must be at least four to five atoms thick to function as an insulator.8 Because of these challenges to both traditional nanotechnology and nanoscience, interest has been growing in the alternative approach, i.e., bottom-up methods.9
Figure 1.2 Two methods (top-down vs bottom-up) to produce matter at the nanoscale. Top-down methods, such as lithography, writing or stamping, are used to define the desired features. The bottom-up techniques use self-processes to produce ordered
4
patterns of supramolecular or solid-state architectures from the atomic to the mesoscopic scale. Reproduced with permission from the Nature Publishing Group.5
Molecular self-assembly is a promising bottom-up methodology for large-scale fabrication of functional nanostructures, defined as a process in which molecules (or parts of molecules) spontaneously form ordered aggregates without human intervention.10 It is the pathway of lowest energy consumption and one of the few
practical strategies for making ensembles of nanostructures. In addition, the study of molecular self-assembly is appealing because self-assembly is one of the basic process employed by biological systems, meaning that an understanding of self-assembly can help to unveil the mystery of the origin of life. The investigation of the spontaneous formation of ordered patterns can also bridge the study of distinct individual constituents and the investigation of systems as a whole.11
Confinement of building block molecules onto a 2D surface is often necessary for the applications of many organic electronic and optoelectronic devices, where the substrate can play an important functional role such as the electrode for organic light-emitting diodes (OLEDs) or photovoltaic solar cells.12 The substrate properties
can also be tuned by deposition of molecules that self-assemble. For example, the assembly of organic acceptor tetracyano-p-quinodimethane has been demonstrated to p-dope graphene substrate through charge-transfer 13 and induce a structural rearrangement at copper surfaces.14
5
Figure 1.3 Schematic illustration of the possible 17 plane groups in 2D, describing the symmetry of monolayer molecular self-assembly. An arrow indicates each asymmetric unit, and unit cells are denoted with gray lines. Reproduced with the permission from American Chemical Society.15
Moreover, the reduced dimensionality of assembly on a surface can dramatically simplify the system with only 17 plane groups possible in 2D crystallization as compared to 230 space groups in 3D crystallization (Figure 1.3).15 The presence of the surface can also introduce extra effects impossible in 3D, such as the concentration-dependent polymorphism.16 Confining molecular self-assembly to a 2D surface offers the advantage of the application of some specialized characterization techniques. For example, using scanning tunneling microscopy (STM), the molecular arrangement on solid surfaces can be imaged in real space with submolecular
6
resolution, which provides a wealth of detailed information.17
2D molecular self-assembly under ultra-high vacuum (UHV) conditions depends critically on two types of interaction: molecule-substrate interactions stabilizing the molecules on the surface and molecule-molecule interactions that define the relationship between neighboring molecules.12 However, when it occurs at solution/solid interface, the solvate-solvent and substrate-solvent interactions can also play an important role in the determination of 2D ordered patterns.18
The interaction between adsorbates and solid substrate can determine molecular adsorption geometries, sites and orientations. The role of surface will become more and more dominant when interactions move from weakly physisorbed to chemisorbed organic molecules.19-20 For the surfaces with ordered arrays of dislocation networks,21
steps or patches with different chemical composition,22 the inhomogeneity of the molecule substrate-interaction can act as guidance for the growth of molecular nanostructures whose motif structure can be uniquely defined by adsorption-site selectivity. Thus, through the decoration or designation of the surface structure, it is possible to realize the precise control of the deposited molecular self-assembly.23 Intermolecular interactions are another important factor that can influence molecular self-assembly. The interactions and motif structures of self-assembly depend on the nature and spatial arrangement of functional groups in the periphery of the backbone of molecular building block. According to the strength, intermolecular interactions can be divided as two types, non-covalent interactions and covalent interactions.
7
Table 1.1 Intermolecular interactions of self-assembly24
Type of interaction Strength (kJ/mol) Character
Covalent bond 350 irreversible
Coordination binding 50-200 directional
Hydrogen bond 5-65 Selective, directional
van der Waals interaction <5* Non-selective, non-directional *strength scales with the number of atom involved in the interaction
Since non-covalent interactions are weak and have the advantage of the reversibility of bonding, organic molecules can interact with each other to form long range ordered structures. In this context, the chemical nature of the individual molecules is preserved in the assembly and non-bonding interactions, such as hydrogen bonds,25 van der Waals (vdW) interaction,26 halogen bonds27 and metal-organic coordination28
(Table 1.1), drive the self-assembly process. However, these weak intermolecular interactions are also a limitation in these fragile structures. Such supramolecular assemblies are difficult to modify without losing their structure:
(i) Modification of the functional groups typically will alter the interactions between the constituents and thus lead to different assemblies;
(ii) performing chemistry on these assemblies is difficult without destroying their structural integrity;
8 applications.29
By using covalent interactions to enhance the mechanical rigidity of structures, these disadvantages can be overcome (discussed in section 1.2). In addition, conjugated polymers can have semiconductive properties with a high efficiency of charge transport, which is desirable for electronic device applications.30
Molecular self-assembly at the liquid/solid interface are more convenient and straightforward experimental approaches compared with those that require UHV conditions.18 Besides molecule-substrate and molecule-molecule interactions, the arrangement and stability of self-assembled structures at the liquid/solid interface also depends critically on the solvent used. The delicate balance among interactions between solvent, solvate and substrate would give rise to the competitive or coadsorption deposition of solvent molecules with adsorbate.
Solvents can be physisorbed or even self-assemble on the surface to form 2D structures.31-32 This requires solvent molecules have a higher affinity for the substrate than the solvate. The solvents can also be coadsorbed at the liquid/solid interface via vdW interactions with the substrate, or hydrogen bond or vdW interactions with the adsorbate molecules. For example, the carboxyl functional groups of 5-octadecyloxyisophthalic acid (C18ISA) were observed to form hydrogen bonds with
1-octanol solvent molecules, leading to observed self-assembly with solvent co-adsorption. However, when 1-phenyloctane was used as the solvent, no coadsorption of solvent molecules could be observed. This variation implied that
9
hydrogen bond formation was the main reason for the solvent coadsorption (Figure 1.4). 33
Figure 1.4 (a) STM image of self-assembly of C18ISA molecules at 1-octanol/graphite
interface. The value of ∆L1 corresponds to interdigitated C18ISA, identical with the one
in (c).The value of ∆L2 corresponds to the width of the lamella formed by 1-octanol
molecules. Image size is 10 × 10 nm2. (b) Molecular model represents the area indicated in (a). The unit cell for 1-octanol molecules coadsorption in two-dimensional packing of C18ISA molecules was proposed. (c) STM image of self-assembly of C18ISA
10
molecules at 1-phenyloctane /graphite interface. Image size is 10.7 × 10.7 nm2. (d)
Molecular model represents the area indicated in (c), showing no solvent coadsorption. Reproduced with the permission from American Chemical Society. 33
Solvents can also provide different microenvironments for the solute to self-assemble at the interfaces. The properties of solvent (viscosity, polarity, etc.) and solubility of solvate are all important factors to control the polymorphism of self-assembly through thermodynamic or kinetic effects.34-35 For example, trimesic acid (TMA) is a building block which can construct “chickenwire” structure (dimer motif) and “flower” structure (mixed dimer/trimer motif), both stabilized by hydrogen bonds on HOPG surfaces (Figure 1.5a).36 The solvent induced polymorphism was studied by applying a series of alkyl acid solvents with different dielectric constants as solvent. “Chickenwire” structure is favored in less polar solvent (low solubility) and “flower” structure is favored in more polar solvent (high solubility). The possible explanation for this variation in monolayer identity is the stabilization of a TMA trimer solution phase nucleation species (precursor for “flower” structure) in the solvent with high solubility, but a TMA dimer (precursor for “chickenwire” structure) in the solvent with low solubility. In the same context, the self-assembly of 1,3,5-benzenetribenzoic acid (BTB), a bigger analogue of TMA, was also found to depend on the solvent in use. BTB can form two different structures, “chickenwire” structure and “oblique” structure (Figure 1.5b), which differ in their hydrogen bonding pattern but both have the dimer motif.37 Experiments conducted to compare between the solvent molecules
11
with and without hydrophilic functional groups suggest a different mechanism, depending on whether the solvent can or cannot exert strong hydrogen bonds, for the formation of the interfacial monolayer structures at the liquid/solid interface. If the structure exposes a lower number of polar groups during the growth, then it will be preferred in a solvent of low dielectric constant and vice versa. Since the “oblique” structure exposes more free hydrogen bonds during the growth process, thus it was observed in more polar solvents. Although the above mechanisms were proposed in the TMA and BTB studies, the possibility of solvent co-adsorption cannot be ruled out, because the porous self-assembled structures can enable the interactions between solvent and substrate.
Figure 1.5 (a) (Top) The STM image and models for chickenwire structure of TMA. STM image was collected at the heptanoic acid/HOPG interface. Image size: 15×15 nm2. (Bottom) The STM image and models for flower structure of TMA. STM image was
12
collected at the pentanoic acid/HOPG interface. Image size: 15×15 nm2.38 (b)
Schematic representation of the seeding process for the oblique pattern (left) and the chickenwire motif (right) with the BTB dimer as the repeating unit forming. The count represents the number of polar functional groups exposed to the solvent, and those in the brackets represent the number of BTB molecules involved in the assembly. (c) Schematic representation of the properties for the series of alkanoic acids from butanoic to nonanoic acid and the respective interfacial monolayer polymorphs. Reprodiced with the permission from American Chemical Society. 37
1.2. Covalent Organic Frameworks
Extended crystalline covalent organic frameworks (COFs) were first routinely synthesized from solution in a sealed reactor, where the reversible formation of covalent bonds provides the mechanism for error correction.39 Since producing 2D
COFs can potentially deliver single sheets of organic material, similar to highly popular graphene, but with a tunable structural motif, 2D COFs have been synthesized on surface using various approaches including Ullmann dehalogenation,40 carbon-carbon covalent bond formation and dehydration reactions41 with the method of on-surface synthesis. Topologically, a 2D COF monolayer is composed of nodes and spacers. The cross-linked 2D network can be obtained with different symmetric building block molecules through “node” condensation or “spacer” condensation, as schematically presented in Figure 1.6.42 The successful realization of COF materials
13
through molecular building blocks can provide porous covalent frameworks that could be functionalized into lightweight materials optimized for gas storage, photonic, and catalytic applications based on host/guest chemistry.29
Figure 1.6 (a) The “node” approach for synthesis of 2D COFs. Examples are given on the right: cyclocondensation of three boronic acids molecules and tetramerization of four 1,2,4,5-tetracyanobenzene (TCNB) molecules with one Fe atom. (b) The spacer approach for synthesis of 2D COFs according to the symmetries of builders.
14
Corresponding examples are given on the right for the construction of 2D COFs: the condensation reaction between boronic acids and diols, the Schiff-based reaction, polyamide formation, polyimide formation, polyester condensation, Ullmann coupling, and Glaser coupling. Reproduced with the permission from Wiley.42
Boronic acid-based building molecules were initially used to produce 2D COFs on Au(111) surface using the “node” construction mode in UHV conditions,43 following
on the first bulk COFs materials.39 Three 1,4-benzenediboronic acid (BDBA) monomers can form one boroxine (B3O3) ring through cyclocondensation (Figure
2.1a),44 whereas intact BDBA molecules can form a hydrogen-bond stabilized self-assembly on metal surface. Starting from this supramolecular self-assembly, the synthesis of COF-1 through tip- or electron beam -induced surface polymerization of BDBA molecules was also developed.45 However, since covalent bonds lack the degrees of reversibility under UHV conditions, several kinds of defects, such as pentagon and heptagon pores, were inherently formed, and the polymer structure always deviated from an ideal honeycomb two-dimensional network.46 Therefore, the synthesis of larger-scale high-quality COFs is desirable.
15
Figure 1.7 Enthalpic diagram showing the different transition states during polymerization reaction. The energies (in eV) are relative to the monomers. After each transition, a water molecule is released (arrows).Reproduced with the permission from Wiley.47
Based on the dehydration reaction of boronic acids and thermodynamic-equilibrium control strategy, Li’s and Lackinger’s groups have succeeded in constructing large-scale high-quality COFs by using excess water as the chemical-equilibrium-manipulating agent in the closed and open environment conditions respectively (Figure 1.8).48-50 The large 2D COFs arrangements observed experimentally are stabilized through the entropic contribution of the water molecules released during 2D polymerization process of BDBA molecules (Figure 1.7).47 Thus, the important effect of water in the formation process of an ordered 2D COF can be understood by Le Chatelier’s principle. The presence of excess H2O during the
16
poly-condensation changes the free energy of the reaction and favors a reverse reaction to a certain extent by pushing the equilibrium backward. The enhanced reversibility can improve the self-correcting abilities of the COFs and result in the formation of highly ordered honeycomb molecular nanostructures. Eventually, after excess water is removed, the ordered porous networks gain their robustness by ceasing bond reversibility.
Figure 1.8 Synthesis of high-quality 2D COF-1 monolayer polymers. (a) BDBA monomer self-condenses onto crystalline metal surfaces in UHV to form COF-1 monolayer which containing various pentagonal and heptagonal ring defects (middle). The improvement in the order of the film can be initiated through annealing this film in a humid environment (right). (b) Pre-prepared COF-1 nanocrystals in solution were dropcasted onto HOPG surface (middle). Similar annealing can provide a monolayer with improved long-range order (right). Reproduced with the permission from the Nature Publishing Group.51
17
drop-casting offer much convenience for further applications,49 but still bear many
disadvantages, for examples: inhomogeneous coverages, including unwanted bilayers; insufficient reproducibility; contaminations; solubility issues, which can limit the size of the domains. Recently, in order to further improve the quality of COF-1, a new synthesis procedure of using vapor deposition instead of solution-deposition was developed. The progressively smaller length characterization on samples manifested that the sample prepared by vapor deposition protocol similarly yields high quality COF-1 monolayers, but significantly reduces sample contamination.52
1.3. Host/Guest chemistry based on 2D templates
H/G chemistry is the important concept in supramolecular chemistry which describes the formation of unique structural complexes composed of two or more molecules or ions held together via non-covalent interactions. The mutually specific recognition between the host network and the guest molecules is the core idea of H/G chemistry. Although historically developed in organic and aqueous solutions, the principles of supramolecular H/G chemistry have been successfully implemented in self-assembled systems on solid surfaces.22 The reason why single layer molecular host/guest (H/G) architectures on surface have attracted a lot of attention is because they can provide a novel route towards porous materials that may find applications in molecular recognition, catalysis, gas storage and separation.51, 53
18
Figure 1.9 (a) Schematic of conjugated oligothiophene macrocycle, which is intrinsically porous. (b)STM image of a monolayer of macrocycles on HOPG. The adsorption of C60 is indicated with white arrow. Image area: 11.6 nm× 8.7 nm;
Scanning conditions: V=-700 mV, I = 44 pA. (c) Calculated model of a closely packed monolayer of assembled template with intrinsic porous host molecules with a hexagonal arrangement. Inset picture exhibits side view of the calculated energy minimum conformation of a oligothiophene-C60 complex. Reproduced with the
permission from Wiley.54 (d) Illustration of the TMA chickenwire host, which is extrinsically porous. TMA molecules are drawn with the vdW surfaces of the atoms. The extrinsic single cavity stabilized by hydrogen bonds is indicated in the right enlarged sketch. (e) STM constant current image of the TMA-C60 host-guest structures.
The diameter of the pores is 1.1 nm, and the unit cell of the hexagonal network is a=b=1.6±0.1 nm and γ=60±1° as depicted in the upper right corner. The adsorption of two C60 molecules inside the pores of the TMA host network appear as bright
19
protrusions. Image dimensions: 10 × 10 nm2. Reproduced with the permission from
American Chemical Society. 55
Surface-confined H/G structures rely on hierarchical interactions: the interactions binding the host monomer together are stronger than the interactions binding the guest to the host.56 The presence of a solid surface can also provide additional stability for the resultant H/G structures through the molecule-substrate interactions. The 2D porous host networks can be constructed in intrinsic or extrinsic ways. The intrinsic porosity is inherent to the chemical structure of the constituent molecules, whereas extrinsic porosity results from non-covalent (or covalent) assembly of the constituent molecules, which usually do not bear porosity in isolation (Figure 1.9). The intrinsic porous self-assembled host template is typically stabilized by vdW interactions,54, 57
while an extrinsic porous self-assembled host template can be stabilized through several different interactions (Table 1.1). Although based on hierarchical interactions of H/G, rigid host templates with fixed pore sizes, such as those sustained by hydrogen bonding or metal-ligand interactions, are favorable for guest selectivity, flexible host networks stabilized by vdW interactions also provide reasonably high selectivity. Because of the ability to design interactions in a host network via judiciously chosen molecular components, the majority of H/G studies carried on solid surfaces have focused on extrinsically porous systems. For example, isoreticular scalability of COF cavities can be achieved through simply increasing the size of the molecular building blocks.22
20
H/G structures can offer spatially controlled fixation, observation, and precise manipulation of matter down to the single molecule level, which is an essential requirement for nanotechnology applications.58 The manipulation of a single molecule
55, 59 can be carried out by STM at the liquid/solid interface without the need for
experimentally challenging UHV techniques. For example, the proof of principle work has been reported by Griessl, where the adsorption site of C60 molecule in a
TMA template can be manipulated by varying the tunneling current through an STM tip.55
H/G chemistry is also associated with the study of selective recognition of a molecule (guest) by another molecule (host) via the formation of non-covalent interactions. Several strategies for selectivity in guest bonding have been developed based on the geometry of host, such as pore size,60-61 shape62-63 and chirality64 or chemical environment of host65. For example, two different shape species can be trapped by a nanotemplate at the same time (Figure 1.10). A novel hydrogen bonding molecular network with two different cavities can be formed from tetra-acidic azobenzene (NN4A). The coronene (CORO) molecule is only entrapped in the hexagonal cavity due to the pore size and shape and C60 will be entrapped in exclusively in the
triangular cavities. The network can serve as a supramolecular nanoporous template to simultaneously accommodate C60 and coronene molecules, forming a
coronene/C60/NN4A ternary architecture. Based on similar selective recognition
21
either the host template or the guest species can comprise more than one type of molecular building blocks.66-68 For example, the complexity of H/G self-assembly was extended to a three component H/G architecture assembling at the solution-solid interface. Instead of using a single of type of guest, a heteromolecular guest cluster composed of coronene and isophthalic acid (ISA) could be immobilized in host network formed by dehydrobenzo annulene (DBA) derivative.69
Figure 1.10 The chemical structures of the NN4A and guest molecules: (a) NN4A, (b) coronene, (c) C60. (d) The STM image of coronene/C60/NN4A ternary architecture at
22
changed is marked by a green arrow. The scanning conditions of upper area and lower one are I=1055 pA, V=516 mV and I=128 pA, V=968 mV, respectively. (e) A molecular model of coronene and C60 molecules co-adsorbed on NN4A networks.
Reproduced with the permission from Wiley.63
Molecular recognition in H/G chemistry can constitute proof-of-concept for the design of sensors.70 For example, the modulation of the conductivity of the active
conducting materials upon the H/G binding event can be transduced into electric signals, as shown in Figure 1.11.71 Confining a guest in a 2D host structure represents the ultimate limit of design for an organic field effect transistor-based sensor, where devices with thin active layers are used for their high response speed and sensitivity to target molecules.72
Figure 1.11 Graphic representation of a FET chemical sensor.71
23
been an important methodology for controlling crystallization into the third dimension using molecular building blocks. For example, a bilayer H-bonded Kagomé structure73 and self-aggregation of -stacked heterocirculenes74 have been observed based on 2D H/G structure. Moreover, fullerenes and their derivatives with non-planar geometry, when stabilized by weak interaction on 2D templates, can promote configurations defined by the template that deviate from standard close-packing.23, 75-78 The cooperative interaction of H and G species was manifested through the
observation of the induced growth of a second layer of a supramolecular framework by the trapped fullerenes (Figure 1.12).79 Although H/G structures have so many potential applications, the COFs based H/G structure have not been investigated intensively.
24
Figure 1.12 (a) Schematic illustration of the random rhombus tiling formed by the terphenyl-3,3'',5,5''-tetracarboxylic (TPTC) acid framework. Different hexagonally ordered network of pores is highlighted by A-E. (b) STM image of TPTC network after a deposition of C60. The locations of C60 are visible as bright spots in the image and the
underlying TPTC network is not visible. Scale bar: 16 nm; (c) STM image of TPTC bilayer immediately collected after C60 deposition. The co-adsorption structure of C60
and bilayer TPTC framework can be identified. The first layer of TPTC framework is visible with an altered contrast and the second TPTC molecules appear with the long axis of the molecules as bright, rod-like features. Scale bar: 11 nm. (d) Schematic representation of the co-adsorption of C60–bilayer structure consisting of two overlying