HAL Id: insu-01878637
https://hal-insu.archives-ouvertes.fr/insu-01878637
Submitted on 22 Sep 2018HAL is a multi-disciplinary open access archive for the deposit and dissemination of sci-entific research documents, whether they are pub-lished or not. The documents may come from teaching and research institutions in France or abroad, or from public or private research centers.
L’archive ouverte pluridisciplinaire HAL, est destinée au dépôt et à la diffusion de documents scientifiques de niveau recherche, publiés ou non, émanant des établissements d’enseignement et de recherche français ou étrangers, des laboratoires publics ou privés.
Temperature trends observed in the middle atmosphere
and future directions
Philippe Keckhut, Chantal Claud, Beatriz M. Funatsu, Alain Hauchecorne,
Pauline Maury, Sergey Khaykin, Alexis Le Pichon, Wolfgang Steinbrecht
To cite this version:
Philippe Keckhut, Chantal Claud, Beatriz M. Funatsu, Alain Hauchecorne, Pauline Maury, et al.. Temperature trends observed in the middle atmosphere and future directions. Le Pichon, Alexis, Blanc, Elisabeth, Hauchecorne, Alain (Eds.). Infrasound Monitoring for Atmospheric Studies, Springer, pp.805, 2019, 978-3-319-75138-2. �10.1007/978-3-319-75140-5_26�. �insu-01878637�
Temperature trends observed in the middle
atmosphere and future directions
P. Keckhut1, C. Claud2, B. M. Funatsu3, A. Hauchecorne1, P. Maury1, S. Khaykin1, A.
Le Pichon4, and W. Steinbrecht5
1 Laboratoire Atmosphères Milieux et Observations Spatiales/IPSL; CNRS UMR 8190; UVSQ; UPMC, Guyancourt, France
2 Laboratoire de Météorologie Dynamique/IPSL; CNRS UMR 8539, Ecole Polytechnique; UPMC; ENS, Palaiseau, France
3 Université Rennes 2, Rennes, France 4 CEA, DAM, DIF, Arpajon, France
5 Meteorologisches Observatorium, Deutscher Wetterdienst, Hohenpeißenberg, Germany
1. Introduction
Associated with the global surface warming due to greenhouse gases, a long-term cooling of the middle atmosphere (around 10-90 km) is expected. Early numerical simulations have shown that this cooling is one order of magnitude larger than the warming at surface and could be detected. If so, this signal would be a fingerprint of the climate changes induced by greenhouse gases increase (Ramanathan et al., 1987). The main issue of assessing the temperature changes of the vertical profile on a decadal scale is the availability of long series of observations in the upper atmosphere. Those observations, not initiated to address climate change issues, are indeed highly inhomogeneous in time, in space and in quality. They exhibit drifts and abrupt changes that are not favorable for global trend detection and quantification. The second issue in the stratosphere (10-50 km) concerns other sources of inter-annual variability. These include solar variability, major volcanic eruptions (providing aerosols in the stratosphere for month/years) and stratospheric ozone changes that are also induced by increasing anthropic activities. However, the time evolution as well as the vertical behavior are key parameters to separate and quantify the different forcings, either natural or anthropic. Thus, information on the evolution of the 3D thermal structure of our atmosphere is required to understand climate changes (Santer et al., 1996), and is an essential input for conducting the analyses of the Inter-governmental panel on climate change (IPCC, 1996). However, the first significant investigations were only initiated in the frame of the ozone assessment conducted by the World Meteorological Organization (WMO, 1990). These assessments are also conducted within the World Climate Research Program and the SPARC (Stratospheric Processes And their Role in Climate) project. These have led to several temperature trend reviews (Ramaswamy et al., 2001; Randel et al., 2009), and the mesosphere has also been specifically studied and reviewed (Beig et al., 2003). With careful inspection of existing data sets, bias and drifts have been corrected and temperature trend estimates were retrieved. While the cooling was detected, the quantification and the vertical description for the whole middle atmosphere and all latitudes remains an issue. Important collective efforts in the future will be required to extend ad-hoc data sets and complementary information to better understand upper atmospheric changes under both natural and anthropic origins. Here, a review of analyses performed in the last decades is presented for the stratosphere (section 2) and for the mesosphere (section 3) that are covered by
different observational techniques. The contribution of numerical models and meteorological analyses and their comparisons with direct observations is then presented in section 4. Finally, future potential directions are proposed in section 5.
2. Data series available
The first studies were based on historic balloon and rocket sondes. Later investigations used satellite measurements performed by NOAA since 1979, and the lidar sounding conducted within the Network for the Detection of Stratospheric Changes (NDSC). This latter program was renamed NDACC (Network for the Detection of Atmospheric Composition Changes) when observations were extended to the upper troposphere.
2.1 Radiosondes
These data, developed for meteorological needs in the 1940’s and established as a growing global network during the geophysical year in 1956, were the first natural data source for climate research for the upper air domain. The basic concept is to measure the temperature with a thermistor coupled with a radio emitter onboard a balloon that ascends from the ground to an altitude of 10-40 km, according to the balloon type and meteorological conditions. While the first temperature trend estimates were performed with the data from this worldwide network and a strong international coordination ensured by WMO, the main limitations came from the time discontinuity at different sites due to sensor changes (Gaffen, 1994). Especially above 30 km, the accuracy of the temperature measurements is very limited, although the different national manufactures have improved their sensors significantly over the last decades. Considerable efforts, mainly by the NOAA, have been performed to document such inhomogeneities, and many attempts to correct or use a selection of specific stations have been performed. This has led to several subsets that complicate drawing firm conclusions as the spatial representativeness is different and reduced. Note that even with all available stations, the land/sea distribution of balloon sites induce a strong spatial bias. To avoid such effect, the Berlin group made global daily contour maps from individual radiosonde profiles to provide regular temperature grid on the Northern Hemisphere (Labitzke et van Loon, 1995).
2.2 Rocketsondes
In the frame of space conquest, an intensive program of systematic upper atmospheric sounding with rocket launches has been conducted by the US, Soviets and Japan from the 1960’s up to the mid 1990’s. However, the cost and alternative emerging techniques like lidars from the ground and satellite measurements have effectively stopped these long-term data series (Finger et al., 1993). Temperature measurements from meteorological rockets were performed from the rocket apogee (80-100 km). These measurements were performed using small rockets (around 2 meters’ length), either with a payload equipped with a thermistor falling from the rocket apogee under a parachute, or with a falling sphere whose trajectory was recorded by a ground-based radar that allowed density profiles to be deduced (Schmidlin, 1991). These datasets provided the first data series covering the altitude range from 25 to 75 km over 2 to 3 decades at around 13 sites. Large corrections (Lubken et al., 1994) needed to be applied (both aero-thermic and aerodynamic), achieving an accuracy of around 1 K. However,
changes of sensor and time of measurements need to be taken into account for accurate trend estimates.
2.3 Lidar
A more recent technique, based on launching a laser pulse vertically, allows light backscattered by molecules to be collected in order to deduce the air density from 30 to around 80 km height (Hauchecorne et Chanin, 1980). This technique allows temperature retrieval with an accuracy of less than 1 K below 70 km. Systematic measurements have been performed since 1979 at Observatory of Haute-Provence (OHP) and more recently from several other sites within the Network of the Detection of Atmospheric Composition Changes) since 1991 (Kurylo and Salomon, 1990). The largest source of uncertainties can be found around the top of the profile (around 80-100 km depending the conditions) due to counting uncertainties, noise extraction or initialization. There is also concern at the bottom part (around 30 km) due to the presence of potential aerosols, miss-alignment, or signal saturation. Only five sites provide regular data series over more than a decade. These series have revealed a cooling before 1995 that was similar to that seen by the rockets.
2.4 Satellite data
Although numerous techniques have been developed for temperature measurements of the middle atmosphere from space, only two space-borne time series have been developed through successive launches of the same instruments on different platforms. Others are research instruments that acquire measurements over several years, with a few exceptional cases reaching nearly a decade. The first one is based on thermal Infra-Red Radiance measurements (Nash et Forester, 1986) and the second one utilizes thermal emissions in the microwave bands (Spencer et Christy, 1993). Temperature monitoring was possible thanks to the succession of NOAA satellites, and nowadays continues through a coordination by all space agencies under the Sentinel strategy (Aschbacher, 2008).
From 1979 up to 2006, the Stratospheric Sounder Unit (SSU), with several radiometers measuring the CO2 radiance, retrieved the mean temperature of broad layers (10-15 km) up to the lower mesosphere. One specific problem with SSU was that CO2 levels changed over this period of time, and so the vertical weighting functions. Although this effect can be corrected, it is difficult to evaluate their exact impact on time continuity and remains a major uncertainty on trend estimates (Shine et al., 2008).
Since 1998, the AMSU (Advanced Microwave Sounding Unit) has progressively replaced SSU, and provides temperature measurements over thinner bands in the middle atmosphere, with 6 out of 12 radiometers in the oxygen band 50-58 GHz. AMSU instruments are on NOAA satellites 15, 16, 17, 18, and 19, respectively launched in 1998, 2000, 2002, 2005, and 2009, with different lifetimes. Note that temperature provided by AMSU on NOAA-16 provides the longest series (some channels of NOAA15 have experienced problems), and is in good agreement with OHP lidar lidar (Funatsu et al., 2008). AMSU instruments are also aboard AQUA and METOP platforms with a more stable orbit that avoids tidal interference.
One of the main difficulties with the SSU and AMSU series is their cross-compatibility and their ability to ensure a sufficient time continuity to derive accurate temperature trends. NOAA used the systematic temperature observations from US rocket sites to
inter-calibrate the different instruments (Finger et al., 1993). However, orbit drifts induced a large drift of the time of measurements, which, in turn, induced temperature drifts and discontinuities between instruments onboard different satellites (Keckhut et al., 2001). Adjustments using zonal mean temperatures (Nash and Forester, 1986) partially cancelled out such discontinuities, as shown when data were compared with the OHP lidar (Keckhut et al., 2011). Data corrections to provide a continuous time series were carried out by two independent groups from Reading (UK) and NOAA (US). Although the two corrections were initially in disagreement, leading to trend estimates that disagreed and exceeded those of numerical models, the corrections have been normalized, resulting in consistent trend estimates (Seidel et al, 2016). Recent platforms having stable orbits and
carrying AMSU do not face these problems associated with atmospheric tides.
Other space observations were available through research experiments even though they were shorter than a decade; the NASA/UARS mission (Upper Atmosphere Research Satellite) has provided the most complete data on middle atmosphere energy inputs, winds, and chemical composition ever gathered from 1991 to 2005. More recently, Envisat (ENVIronment SATellite), launched in 2002 by ESA with 10 instruments aboard dedicated to the middle atmosphere, some continuing to measure up to 2012, is the largest civilian Earth observation mission. The NASA/AURA mission launched in 2004 provides long series of temperature observations using the Microwave Limb Sounder, and finally, the SABER (Sounding of the Atmosphere using Broadband Emission Radiometry) launched in 2001 is one of the 4 instruments on NASA’s TIMED (Thermosphere Ionosphere Mesosphere Energetics Dynamics) satellite. The primary goal of the SABER experiment is to provide the data needed to advance our understanding of the fundamental processes governing the energetics, chemistry, dynamics, and transport in the mesosphere and lower thermosphere.
3. Temperature trends in the stratosphere
During the first temperature trend assessment (Ramaswamy et al., 2001), ground-based measurements were largely used. Balloon series since the Geophysical year (1956) exhibit regular measurements over large geographical coverage (except sea), but they suffer from discontinuities and manufacturer differences from one country to another. In addition, the individual quality at many sites was uncertain over the long-term. NOAA and many other group filter and correct these series. Then cooling amplitude retrieved from these different subsets differ slightly either due to geographical or quality check differences, but all show a cooling increase with altitude, with larger uncertainties over tropics and at high latitudes (Figure 1).
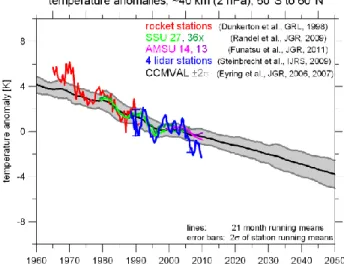
Rocketsondes and lidars, even if located at a limited number of sites, also clearly identify a cooling of 1 K/decade in the upper stratosphere when averaged (figure 2). The initial date set composed by the successive SSU missions present large discontinuities (Wild et al., 1995, Keckhut et al., 2001) while the zonal mean temperature derived by the so called “Nash method” reveal much better agreement with individual ground-based sites (Keckhut et al., 2011) as shown in figure 2. The Chemistry-Climate Model Validation project (CCMVal), which includes numerical models with a good representation of the stratosphere and an interactive chemistry scheme (Eyring et al., 2006, 2007), also reveal an overall good agreement with observations. However, the temperature plateau observed in 1995, simultaneous with the shift from SSU to AMSU instruments led to
questions by the community about trends over the last decade. The reinvestigation of the individual sites revealed some uncertainty in the observation series.
Fig. 1 Vertical profiles of temperature trends over the period 1979 to 2005, deduced from radiosondes and SSU channels (Randel et al., 2009).
The next temperature trend assessments had a strong focus on the SSU data series (Randell et al., 2009) and two groups ensured independent re-analyses of the SSU analyses, calibration and adjustments that first led to large differences on trends (larger than provided by models). After a fruitful collaboration between both teams, they converged to a similar combination of the successive SSU measurements (Wang and Zhou, 2013; Seidel et al., 2016) and trend estimates. The SSU series show that after 1995, the previously observed cooling stopped. It is not clear if this relative slowdown of the trends is due to real climate changes, or is related to the combination of other forcings like volcanoes, solar activity or internal dynamic fluctuations. This slowdown was also observed on global surface temperature (Trenberth and Fasullo, 2013) and was also clearly reported by all lidars (Steinbrecht et al., 2009; Keckhut et al., 2011). It is also noted on CCMVal models (figure 2).
Fig. 2 Temperature evolution in the mid-upper stratosphere deduced by US rockesondes (Dunkerton et al, 1998), SSU (Randel et al., 2009) and AMSU (Funatsu et al., 2011) channels,
lidar stations (Steinbrecht et al., 2009) and CCMVAL models (Eyring et al., 2006, 2007). (@ W Steinbrecht)
The AMSU series ensure the continuity of the SSU series with different vertical weighting functions. Similar to SSU, the NOAA satellites with the longest lifetime have drifting orbits, and so their time of measurements for a given location changes. The comparison of NOAA 15 and 16 confirms that the amplitude of the difference can be due to the combined effects of atmospheric tides and orbit drifts (Keckhut et al., 2015) and can be corrected. After tidal adjustment, a cooling can be derived from this decadal series. However, tide corrections are complex as tides exhibit seasonal changes and include non-migrating components that are difficult to quantify. Some platforms exhibit stable orbits and can be used to derive temperature trends (Funatsu et al., 2016). These confirm that the cooling continues after the slowdown with a reduced amplitude.
Comparisons of lidar series with corresponding SSU channels (figure 3) also show large differences (Keckhut et al., 2011) that were not due to any obvious instrumental origins. The analyses of AMSU observations shows that large uncertainties can be associated with time and space sampling of ground-based measurements (Funatsu et al., 2011). Analyses of AMSU series show that a factor of 2 can be found between the zonal mean decadal trends and regional estimates, and between daily measurements and less frequent time sampling. The differences between two lidar series obtained at two different alpine sites were investigated using AMSU series extracted above both sites (Funatsu et al., 2011). This study seems to indicate that disparities could be representative of atmospheric variability. For example, the stratospheric temperature at Hohenpeissenberg (Germany) is systematically colder in winter and warmer in summer than at Observatory of Haute Provence (France). Because temperature gradients are strong and highly variable, particularly in wintertime due to the wobbling of the polar vortex, even a distance of hundreds of km can induce systematic differences. Different sampling is a considerable issue during winter in the northern hemisphere due to the occurrence of sudden stratospheric warmings that can induce temperature changes of several tens of Kelvin during typically a week. The new trend analysis of OHP lidar data that is based on temperature distributions shows that the frequent occurrence of stratospheric warming events has a large impact on trend estimates (Maury et al., 2016). Taking such effects into account reveals larger radiative trends (Angot et al., 2012), indicating that there is a strong dynamical feedback.
Fig. 3 Vertical temperature trends deduced over the period 1988 to 2005 from lidar and SSU (Randel et al., 2009).
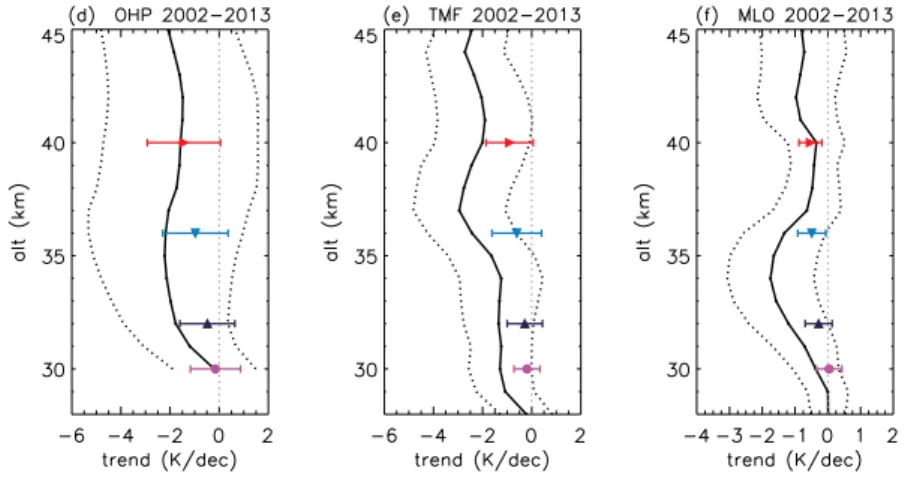
Recent lidar series also confirm that trends over the last decade are similar to the previous estimates derived from rocketsonde series (Figure 4) as well as the OHP lidar starting in 1979. However, temperature trends derived with AMSU during the same period are smaller at all sites around 32 and 36 km (Funatsu et al., 2016). When lidar and AMSU series are compared on a daily basis, smaller variability is observed from space, perhaps due to the smoothing effects of the larger vertical resolution (Funatsu et al., 2008).
The new NOAA STAR version of SSU series from 1979 to 2006 (Zou et al, 2014), were extended to 2015 using MLS (AURA), SABER (TIMED) and AMSU (NOAA) series using a set of empirical weighting functions derived from overlap periods of several years (McLandress et al., 2015; Randel et al., 2016) accounting for the fact that the recent temperature series exhibit much better vertical resolution. Linear trends calculated from the entire 1979-2015 period show good agreement among the different data sets. Although there is slightly larger cooling for the combination of SSU and AMSU, all data sets confirm the global cooling of the middle and upper stratosphere (-0.5 to -0.6 K/decade), with a slight increase in trends with altitude. As observed with lidar (Funatsu et al., 2016), trends for 1979-2015 are somewhat smaller than the trends over 1980-2012 reported in McLandress et al (2015), due to the temperature plateau between 1995 and 2005. The asymmetric cooling pattern in the middle-upper stratosphere observed between the two hemispheres with SSU-AMSU merged data set could confirm the role of stratospheric warmings as the cause (Randel et al., 2016).
Fig. 4 Temperature trends derived from 3 lidar sites and extrapolated AMSU series (NOAA 18) from Funatsu et al, 2016.
4. Temperature trends in the mesosphere and above
A large set of temperature data series in the mesosphere is provided by rocketsondes operated since the 1960’s up to the end of the 1980’s. The longest US data series were obtained mainly in tropical and subtropical zones, except for a few sites at mid-latitudes such as Wallops Island. The former - USSR provides a smaller network. Nevertheless, the long Russian data series can be found at high, mid- and low latitudes. A long dataset is
also available from a site operated by Japan, at Ryori (39°N). Trends have been derived by several groups (Beig et al., 2003), however, all these sites have known instrumental evolution and variations in time of measurements. All these discontinuities have been taken into account in a similar trend re-analyses (Keckhut et al., 1999, Keckhut and Kodera, 1999, Kubicki et al, 2006). For summer months, trends are quite similar (Figure 5) and compare well with OHP Rayleigh lidar (Keckhut et al., 1995) with a maximum around 65 km of 3-4 K/decade, decreasing toward the mesopause. However, even though the Volgograd trend estimates were reduced in such analyses they remained twice as large as the others. The HALOE experiment aboard UARS has provided atmospheric temperature profiles from about 35 to 86 km for a decade since October 1991 using the solar occultation technique. Despite these data series have covered only a decade, Remsberg et al. [2002], using a multi-regression analysis, found a significant long-term cooling trend of 1.0 to 1.6 K per decade at 1 hPa in the tropics.
Temperature can also be deduced from the hydroxyl airglow emissions at around 87 km with different sites coordinated within the Network for the Detection of Mesospheric Changes. Sigernes et al. [2002] concluded that there has been no significant trend during the past 20 years in the above time series, and many other studies reach similar conclusions (Beig et al., 2003; Offermann et al. 2010). Measurements at high and polar latitudes exhibit larger variability and therefore the detection of trends in this time series remains challenging. Such findings are in agreement with Na lidar series at Colorado [She et al., 1995] showing a temperature trend changing from 5 K /decade at 87 km to -5 K/decade at 101 km, with the trend changing sign at 92 km.
Temperature trends have also been reported above the mesosphere from temperature changes of thermospheric neutral density estimated from satellite drag data (Qian et al., 2011). These also observe a turnaround at the end of 1990’s.
Fig 5 Summer temperature trend profiles from 20 to 75km at Volgograd (solid line), Wallops Islands (dashed line), OHP (dash dotted line), Ryori (..) and US low latitude rocketsondes (oo) from Kubicki et al., 2006.
5. Temperature trends on models and meteorological re-analyses
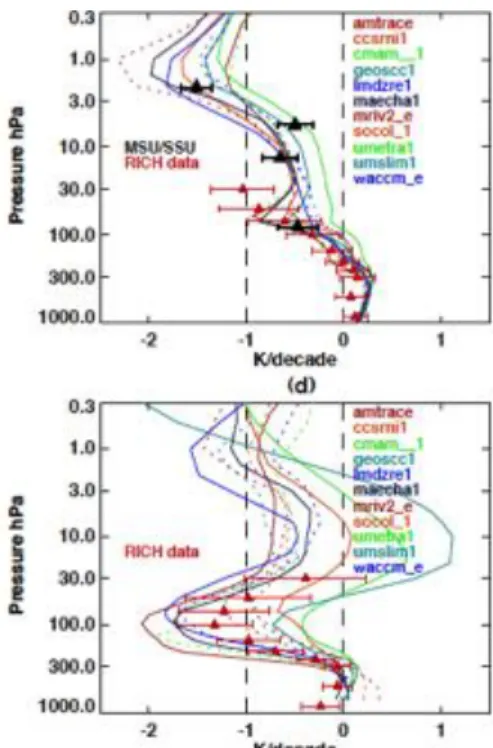
Middle atmosphere trends have been well established using numerical Chemistry Climate Models and reproduce the vertical shape of both the warming in the troposphere and the cooling above (Austin et al., 2009). On average, the value of themean trends of all models is in good agreement with observations (Figure 6), but with differences up to 50% among the models. However, they differ much more at high latitudes, where the dynamical feedback is more important, and there are also large differences between trend estimates at mid latitudes over the Northern hemisphere. Over polar regions, differences are larger with disagreements even about the sign of the trends. At mid and high latitudes, trends are highly dependent on the seasons, and annual mean trend estimates should be avoided for trend inter-comparisons and attribution. One main difference between the different models concerns the occurrence of sudden stratospheric warming [Charlton et al., 2007] that are represented differently from one model to another.
Meteorological analyses could be a good tool for inter-annual studies and trend estimates since they include different datasets linked with physical equations that should ensure spatial and long-term coherency. However, limitations come from the evolution of the observing system and of assimilation methods. Haimberger et al. (2012) compared time series and linear trends of ERA_I temperatures with both MSU records and the profile information provided by radiosondes, and found surprisingly a good agreement. However, differences appear in the vicinity of the tropical tropopause probably due to substantial amounts of assimilated warm-biased aircraft data. In the lower-stratosphere, all re-analyses, constrained by the assimilated infrared as well as microwave radiance data, exhibit similar cooling [Simmons et al., 2014].
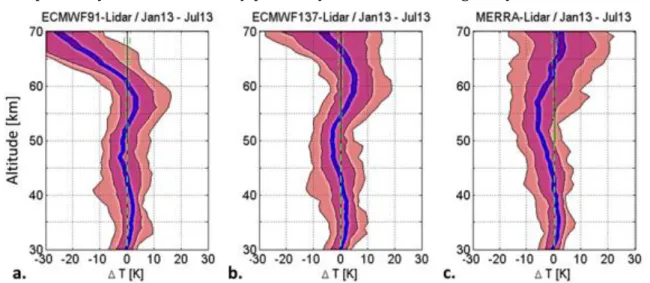
In the middle stratosphere, the different re-analyses show larger differences due to the different treatments of the change from SSU to AMSU-A. Some meteorological analyses reach the mesosphere. While these show large differences compared with the lidar series [Steinbrecht et al., 2009 ; Le Pichon et al., 2015], this is due to the lack of assimilated data in this altitude domain as well as to some deficiencies in gravity waves parametrizations and the impact of the top sponge layer. Meteorological temperatures analyses are very close to lidar measurements as well as anomaly correlation up to 35 km; however in the mesosphere, analyses do not track the observations at all.
Fig. 6 Annual trends (K/decade) on the band between 70°N and 70°S (top) and between 67°N and 90°N (bottom) from several Chemistry Climate Models compared together in the frame of
the CCMVal (Austin et al., 2009) and with the RICH radiosonde dataset. The covered period corresponds to the SSU operation from 1980 to1999.
While the numerical chemistry-transport models are excellent tools for understanding climate changes, the stratospheric dynamics leads to large variability when models and observations are compared on a monthly/yearly basis [Simmons et al., 2014]. In the upper atmosphere, it is always difficult to differentiate the contributions of changes in the dynamical forcing from the troposphere and surface relative to the specific mesospheric dynamics induced by planetary waves as well as gravity waves and tides.
Fig. 7 Difference between L91 (a), L137 (b) and MERRA (c) temperature products at 0h UTC and
nightly averaged lidar measurements at Observatory of Haute-Provence versus altitude. Blue lines: standard error of the mean. Green dashed lines: instrumental error bars. Purple and pink regions: 66% and 95% confidence intervals of the differences [Le Pichon et al., 2015]
An alternative modelling approach that takes into account more realistic lower atmospheric conditions is to force models by meteorological analyses in the troposphere and lower stratosphere where re-analyses are quite accurate. A good example is given by the LIMA model (Leibniz-Institute Middle Atmosphere). This model also includes forcing from greenhouse gases and solar activity, and has interactive ozone chemistry. In addition, it includes microphysics, gravity waves, and effects from non-local thermodynamic equilibrium. As reported on figure 8, the model reproduces the large cooling (3-4 K) observed by satellite and lidar series from 1980 to 1995 as well as the observed changes in radio wave reflection heights. The model also accounts for the trend reduction after 1997 (Berger and Lubken, 2011).
Fig. 8 Time series of summer temperature anomalies from the OHP lidar (green) and the LIMA model (blue line) extract above the OHP sites (44°N, 6°E) at 50 km compared with the zonal mean temperature from SSU 47x channel (from Berger and Lubken, 2011).
6. Conclusions and future directions
Temperature trend estimates all reveal a cooling in the middle atmosphere with inter-annual variability associated with solar and volcanic forcings. However, individual data series inter-comparisons reveal large differences that are too large to be used to validate numerical simulations. In the stratosphere, operational meteorological satellites present limitations due to orbit changes and sensor evolutions that complicate their harmonization into a single time series. Radiosonde networks exhibit some inhomogeneities (in time and space) and non-global coverage, and for cost reasons we can expect this situation will persist in the future. In the mesosphere the situation is worse. Satellite experiments are research oriented, typically with durations shorter than a decade, and utilize different methods and vertical resolutions. Yet long-term temperature monitoring in the middle atmosphere is required as complementary information for climate changes, for changes associated with ozone recovery, for transient volcanic and solar effects, or any other dynamical changes [Newman et al. 2016].
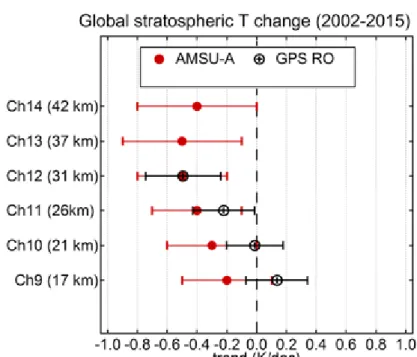
Fig. 9 Global temperature trends derived with AMSU series (Funatsu et al., 2016) and GPS cosmic data over the same period and with AMSU vertical weighting function (@S. Khaykin). In the future, longer, independent series will be required to cross-check temperature evolution and better evaluate bias. In the middle atmosphere, measurements should remain on a fixed orbit to avoid interferences with atmospheric tides that are difficult to
evaluate due to non-migrating components and non-stationary effects (Morel et al., 2004).
In the lower stratosphere, GPS will provide data that can ensure a good continuity a global coverage and could be assimilated as long as the satellite constellation is maintained. Figure 9 shows that the GPS series are now long enough to start such investigations and are comparable with operational microwave series. In the stratosphere, AMSU and SSU need to be merged (McLandress et al., 2015; Randel et al., 2016; Zou and Qian, 2016). However, ground-based lidar will be useful to validate the adjustment quality during the transition periods. Addition global observations such as the IASI series (Hoffman et al., 2014) will be an alternative source of temperature data covering at least 40 years that can offer independent trend estimates. In the mesosphere, temperature measurements can be deduced from the molecular scattering (Shepherd et al., 2002) from several instruments and hence provide a relative homogeneous long-term series that can be also merged and used for decadal monitoring.
Homogeneous long-term ground-based measurements, even if local, are a valuable complementary source of data that ensure the continuity of non-overlapping series from space. Despite the decrease in the number of radiosonde sites, the increase of their data quality produces a reduced series with a better accuracy that can serve as reference for climate issues. The international initiatives that are part of the GRUAN (Siedel et al., 2008) or SHADOZ (Thompson et al., 2003) networks need to be supported on a long-term basis. For the upper atmosphere, lidar temperature series extending into the mesosphere need to be continued as reference series [Keckhut et al. 2011, Kurylo and Solomon, 1990]. Finally, for the mesopause region, airglow temperature measurements can complement such reference series (Bittner et al. 2002, Offermann et al. 2010).
It is probable that models will be able to assimilate wind information from the existing operational infrasound stations that currently operate routinely [Blanc et al., 2016]. This, together with the global temperature datasets as described above, will greatly improve re-analyses in this domain and will allow accurate trends to be derived. Several ground-based wind series at key locations that use lidar (Chanin et al., 1989) or microwave spectrometers (Rüfenacht et al., 2014) will be useful for validating re-analysis outputs.
New meteorological analysis, like NAVGEM, produced by the Naval Research Lab that has assimilated both SABER and some military satellite data up to ~100 km, using meteor radars at several sites as ground-truthing, will probably provide better estimates in the mesosphere (McCormack, et al., 2017).
Temperature changes induce indirect changes through the dynamic processes at different spatial and temporal scales. Thus, trend investigations on zonal and annual estimates need to be avoided for attribution purposes. Trends analyses can also be performed on temperature distributions, allowing temperatures anomalies due to sudden stratospheric warmings to be separated in order to ascertain direct radiative effects (Angot et al., 2012). It is also important to understand the feedback of the dynamics induced by radiative forcing (Cnossen et al., 2011). Additionaly, major sudden stratospheric warming have an impact on trends not only by their occurrence, but also due to the fact that their occurrence may change in terms of frequency, timing, type or amplitude (Maury et al., 2016). Gravity-wave activity may also depart from mean conditions, and could be modified on regional scales as has already been suggested by data analyses using GPS (Khaykin et al., 2015), lidar (Mze et al., 2014), airglow
temperature observations (Offermann et al., 2010) or MF radar wind series (Hoffmann et al., 2011). Such results will need to be consolidated with longer series.
Acknowledgments
These studies were performed within the project FP7-ARISE, and H2020-ARISE 2. Trends assessment were performed within the group STTA/SPARC/WCRP. Temperature lidar profiles are obtained within the frame of the NDACC network and are
publically available on Aeris data portal:
www.pole-ether.fr/NDACC/?methodName=home&language=en. Dr Patrick Joseph Espy has
improved this manuscript by many valuable comments as reviewer.
References
Angot G., P. Keckhut et A. Hauchecorne, C. Claud, 2012 : Contribution of stratospheric warmings on temperature trends in the middle atmosphere as revealed by the lidar series obtained at observatory of Haute-Provence (44°N), J. Geophys. Res., 117, DOI: 10.1029/2012JD017631.
Aschbacher, J., 2008 : Les “Sentinelles” spatiales, de nouveaux outils au service d’une amélioration des politiques européennes en matière d’environnement et de sécurité, communiqué de presse de l’ESA du 28 février 2008 (http://www.esa.int).
Austin J., R. J. Wilson, H. Akiyoshi, S. Bekki, N. Butchart, C. Claud, V. I. Fomichev, P. Forster, R. R. Garcia, N. P. Gillett, P. Keckhut, U. Langematz, E. Manzini, T. Nagashima, W. J. Randel, E. Rozanov, K. Shibata, K. P. Shine, H. Struthers, D. W. J. Thompson, F. Wu and S. Yoden, 2009 : Coupled chemistry climate model simulations of stratospheric temperatures and their trends for the recent past, Geophys. Res. Lett., 36, L13809, doi:10.1029/2009GL038462.
Beig, G., and Coauthors, 2003: Review of mesospheric temperature trends. Rev. Geophys., 41, 1015, doi:10.1029/2002RG000121.
Blanc E., L. Ceranna, A. Hauchecorne, A. Charlton Perez, E. Marchetti, L. Evers, T. Kvaerna. J. Lastovicka, L. Eliasson, N. Crosby, P. Blanc Benon, A. Le Pichon, N. Brachet, C. Pilger, P. Keckhut. J. Assink, P. Smets, C. Lee, J. Kero, T. Sindelarova, N. Kämpfer, R. Rüfenacht, T. Farges, C. Millet, P. Näsholm, S. Gibbons, P. Espy, R. Hibbins, P. Heinrich, M. Ripepe, S. Khaykin, N. Mze, J. Chum, recent progress in understanding middle atmospheric dynamics as part of the arise project, Submitted in Survey in Geophysics, 2016
Bittner, M., D. Offermann, H.-H. Graef, M. Donner, and K. Hamilton, An 18-year time series of OH rotational temperatures and middle atmosphere decadal variations, J. Atmos. Sol. Terr. Phys., 64, 1147–1166, 2002.
Chanin ML, Garnier A, Hauchecorne A, Porteneuve J (1989) A Doppler Lidar for measuring winds in the middle atmosphere. Geophys Res Lett 16:1273-1276
Charlton, A. J., L. M. Polvani, J. Perlwitz, F. Sassi, E. Manzini, K. Shibata, S. Pawson, J. E. Nielsen, and D. Rind (2007), A new look at stratospheric sudden warmings. Part II: Evaluation of numerical model simulations, J. Clim., 20(3), 470–488, doi:10.1175/JCLI3994.1.
Cnossen, I., H. Lu, C. J. Bell, L. J. Gray, and M. M. Joshi (2011), Solar signal propagation: The role of gravity waves and stratospheric sudden warmings, J. Geophys. Res., 116, D02118, doi:10.1029/2010JD014535.
Dunkerton, T. J., D. P. Delisi, and M. P. Baldwin (1998), Middle atmosphere cooling trend in historical rocketsonde data, Geophys. Res. Lett., 25, 3371–3374.
Eyring, V., et al. (2006), Assessment of temperature, trace species and ozone in chemistry-climate simulations of the recent past, J. Geophys. Res., 111, D22308, doi:10.1029/2006JD007327.
Eyring, V., et al. (2007), Multimodel projections of stratospheric ozone in the 21st century, J. Geophys. Res., 112, D16303, doi:10.1029/
2006JD008332
Finger F.G., M.E. Gelman, J.D. Wild, M.L. Chanin, A. Hauchecorne and A.J. Miller, 1993 : Evaluation of NMC upper-stratospheric temperature analyses using rocket-sonde and lidar data, Bull. Am. Meteorol. Soc., 74, 789-799.
Free M., The seasonal structure of temperature trends in the tropical lower stratosphere, J. Climate, 24, 859-866, 2011, DOI:10.1175/2010JCLI3841.1
Funatsu, B.M., C. Claud, P. Keckhut, A. Hauchecorne, Cross-validation of AMSU and lidar for long-term upper-stratospheric temperature monitoring, J. Geophys. Research, J. Geophys. Res., 113, D23108, doi:10.1029/2008JD010743, 2008.
Funatsu, B. M., C. Claud, P. Keckhut, W. Steinbrecht, and A. Hauchecorne, (2011), Investigations of stratospheric temperature regional variability with lidar and advanced microwave sounding unit, J. Geophys. Res., 116, D08106, doi:10.1029/2010JD014974.
Funatsu, B.M., C. Claud, P. Keckhut, A. Hauchecorne, T. Leblanc, Regional and seasonal stratospheric temperature trends in the last decade (2002–2014) from AMSU observations, Geophys. Res. Lett., American Geophysical Union, 2016, 121 (14), pp.8172-8185. <10.1002/2015JD024305>
Gaffen D. J., 1994 : Temporal inhomogeinities in radiosonde temperature records, J.
Geophys. Res., 99, 3667– 3676, doi:10.1029/93JD03179.
Haimberger L, Tavolato C, Sperka S. 2012. Homogenization of the global radiosonde temperature dataset through combined comparison with reanalysis background series and neighboring stations. J. Clim. 25: 8108–8131, doi: 10.1175/JCLI-D-11-00668.1.
Hoffmann, P., M. Rapp, W. Singer, and D. Keuer (2011), Trends of mesospheric gravity waves at northern middle latitudes during summer, J. Geophys. Res., 116, D00P08, doi:10.1029/2011JD015717.
Hoffmann L., Alexander, M. J., Clerbaux, C., Grimsdell, A. W., Meyer, C. I., Rößler, T., andTournier, B.: Intercomparison of stratospheric gravity wave observations with AIRS and IASI, Atmos. Meas. Tech., 7, 4517-4537, doi:10.5194/amt-7-4517-2014, 2014.
Hauchecorne A. and M.-L. Chanin, 1980 : Density and temperature profiles obtained by lidar between 35 and 70 km, Geophys. Res. Lett., 7,565–568, doi:10.1029/GL007i008p00565. Intergovernmental Panel on Climate Change, 1995 : The Science of Climate Change, edited by Houghton et al., Cambridge Univ. Press, New York, 1996.
Keckhut P., A. Hauchecorne, and M.L. Chanin, mid-latitude long-term variability of the middle atmosphere trends, and cyclic and episodic changes, J. Geophys. Res., 100, 18.887-18.897, 1995.
Keckhut P., F.J. Schmidlin, A. Hauchecorne and M.L. Chanin, 1999 : Stratospheric and mesospheric cooling trend estimates from us rocketsondes at low latitude stations (8°S-34°N), taking into account instrumental changes and natural variability, J. Atmos. Sol. Terr.
Phys., 61, 447-459.
Keckhut P., and K. Kodera, Long-term changes of the upper stratosphere as seen by rocketsondes at Ryori, (39°N, 141°E), Annales Geophysicae,, 17,1210-1217, 1999.
Keckhut P., J. Wild, M. Gelman, A.J. Miller and A. Hauchecorne, 2001 : Investigations on long-term temperature changes in the upper stratosphere using lidar data and NCEP analyses, J.
Geophys. Res., 106, 7937-7944.
Keckhut P., W.J. Randel, C. Claud, T. Leblanc, W. Steinbrecht, B.M. Funatsu, H. Bencherif, I.S. McDermid, A. Hauchecorne, C. Long, R. Lin and G. Baumgarten, 2011 : An evaluation of uncertainties in monitoring middle atmosphere temperatures with the lidar network in support of space observations, J. Atmos. Solar-Terr. Phys., 73(5-6), 627-642, doi: 10.1016/j.jastp.2011.01.003
Keckhut, P., Funatsu, B. M., Claud, C. and Hauchecorne, A. Tidal effects on stratospheric temperature series derived from successive advanced microwave sounding units (2015),
Q.J.R. Meteorol. Soc., 141: 477–483. doi: 10.1002/qj.2368.
Khaykin, S., A. Hauchecorne, N. Mzé, P. Keckhut, Seasonal variation of gravity wave activity at mid-latitudes from 7 years of cosmic GPS and Rayleigh lidar temperature observations,
Geophys. Res. Lett., 2015, 42 (4), pp.1251-1258.<10.1002/2014GL062891>, <hal-01109116>
Kubicki, A., P. Keckhut, M-L. Chanin, A. Hauchecorne E. Lysenko, and G.-S..Golitsyn, Temperature trends in the middle atmosphere of the mid-latitude as seen by historical russian rocket launches part 1: Volgograd (48,68°N, 44,35°E), J. Atmos. Solar Terr. Physics, 68, 1075-1086, doi:10.1016/j.jastp.2006.02.001, 2006.
Kurylo M.J. and S. Solomon, 1990 : Network for the Detection of Stratospheric Change, NASA Rep., Code EEU.
Le Pichon A, Blanc E, Drob D (2005) Probing high-altitude winds using infrasound. J Geophys Res 110:D20104. doi:10.1029/2005JD006020
Le Pichon, J. D. Assink, P. Heinrich, E. Blanc, A. Charlton-Perez, C. F. Lee, P. Keckhut, A. Hauchecorne, R. Rüfenacht, N. Kämpfer, D. P. Drob, P. S. M. Smets, L. G. Evers, L. Ceranna, C. Pilger, O. Ross, C. Claud, Journal of Geophysical Research : Atmospheres, American Geophysical Union (AGU), 2015, 120 (16), Comparison of co-located independent ground-based middle-atmospheric wind and temperature measurements with numerical weather prediction models, pp.8318-8331, <10.1002/2015JD023273>
Li, T., T. Leblanc, I. S. McDermid, P. Keckhut, A. Hauchecorne, and X. Dou, Temperature trend and solar cycle revealed by long-term Rayleigh lidar observations, J. Geophys. Res., 2011. 116, D00P05, doi:10.1029/2010JD015275.
Lubken F.-J. and al., 1994 : Intercomparison of density and temperature profiles obtained by lidar ionization gauges, falling spheres, datasondes and radiosondes during the DYANA
campaign. J. Atmos. Terr. Phys., 56, 1969-1984.
Maury, P. C. Claud, E. Manzini, A. Hauchecorne and P. Keckhut, Characteristics of stratospheric warming events during northern winter, J. of Geophys. Res.: Atmospheres, 2016, <10.1002/2015JD024226>.
McCormack, J., K. Hoppel, D. Kuhl, R. de Wit, G. Stober, P. Espy, N. Baker, P. Brown, D. Fritts, C. Jacobi, D. Janches, N. Mitchell, B. Ruston, S. Swadley, K. Viner, T. Whitcomb, and R. Hibbins, Comparison of mesospheric winds from a high-altitude meteorological analysis system and meteor radar observations during the boreal winters of 2009-2010 and 2012-2013, J. Atmos. Solar Terr. Phys., J. Atmos. Solar Terr. Phys., 154, 132–166, doi: 10.1016/j.jastp.2016.12.007, [2017].
McLandress, C., T. G. Shepherd, A. I. Jonsson, T. von Clarmann, and B. Funke, 2015: A method for merging nadir-sounding climate records, with an application to the global-mean stratospheric temperature data sets from SSU and AMSU, Atmos. Chem. Phys. Disc., 15, 10085-10122, doi:10.5194/acpd-15-10085-626 2015.
Morel B., P. Keckhut, H. Bencherif, A. Hauchecorne, G. Megie and S. Baldy, Investigation of the tidal variations in a 3-d dynamics-chemistry-transport model of the middle atmosphere,
J. Atmos. Sol. Terr. Phys., 66, 251-265, 2004.
Mzé N, Hauchecorne A, Keckhut P, Thétis M (2014) Vertical distribution of gravity wave potential energy from long-term Rayleigh lidar data at a northern middle-latitude site, J. Geoph. Res.: Atmospheres, 119 (21) :12069-12083. doi:<10.1002/2014JD022035>
Nash J. and G.F. Forrester, 1986 : Long-term monitoring of stratospheric temperature trends using radiance measurements obtained by the TIROS-N series of NOAA spacecraft. Adv.
Space Res., 6, 37-44.
Newman P.A., et al. The anomalous change in the QBO in 2015-2016, Geophysical Research
Letters (2016). DOI: 10.1002/2016GL070373
Offermann, D., P. Hoffmann, P. Knieling, R. Koppmann, J. Oberheide, and W. Steinbrecht (2010), Long-term Trends and Solar Cycle Variations of Mesospheric Temperature and Dynamics, J. Geophys. Res., 115, D18127, doi:10.1029/2009JD013363.
Offermann, D., J. Wintel, C. Kalicinsky, P. Knieling, R. Koppmann, and W. Steinbrecht (2011), Long‐term development of short‐period gravity waves in middle Europe, J. Geophys. Res., 116, D00P07, doi:10.1029/2010JD015544.
Quian L., J. Lastovicka, R.G. Rble, and S.C. Solomon, Progress in observations and simulations of globl change in the upper atmosphere, J. Geophys. Ress., 116, 1-16, 2011, DOI:10.1029/2010JA016317.
Ramanathan, V., L. Callis, R. Cess, J . Hansen, I . Isaksen W, . Kuhn, A. Lacis, F. Luther, J. Mahlmanl, E. Reck, and M. Schlesinger, 1987 : Climate-Chemical Interactions and Effects of Changing Atmospheric Trace Gases, Reviews Of Geophysics, 7, 1441-1482.
Ramaswamy V., M.L. Chanin, J. Angell, J. Barnett, D. Gaffen, M. Gelman, P. Keckhut, Y. Kolshelkov, K. Labitzke, J-J. R. Lin, A. O’Neill, J. Nash, W. Randel, R. Rood, K. Shine, M. Shiotani and R. Swinbank, 2001 : Stratospheric temperature trends: observations and model simulations, Rev. Geophys., 39, 71-122.
Randel W.J., K. Shine, J. Austin, J. Barnett, C. Claud, N.P. Gillett, P. Keckhut, U. Langematz, R. Lin, G. Long, C. Mears, A. Miller, J. Nash, D.J. Seidel, D.W.J. Thompson, F. Wu and S. Yoden, 2009 : An updated of observed stratospheric temperature trends, J. Geophys. Res., 114, D02107, 2009, doi:10.1029/2008JD010421.
Randel, W., A. Smith, F. Wu, C. Zou, and H. Qian, 2016: Stratospheric temperature trends over 1979-2015 derived from combined SSU, MLS and SABER satellite observations. J. Climate. doi:10.1175/JCLI-D-15-0629.1, in press.
Rüfenacht R, Murk A, Kämpfer N, Eriksson P, Buehler SA (2014) Middle-atmospheric zonal and meridional wind profiles from polar, tropical and mid-latitudes with the ground-based microwave Doppler wind radiometer WIRA. Atmos. Meas. Tech., 7:4491-4505. doi:10.5194/amt-7-4491-2014.
Santer B.D. and al., 1996 : A search for human influences on the thermal structure of the atmosphere, Nature, 382, 39-46.
Shepherd M.G., P.J. Espy, C.Y. She, W. Hocking, P. Keckhut, G. Gavrilyeva, G.G. Shepherd, B. Naujokat, springtime transition in upper mesospheric temperature in the northern hemisphere, J. Atmos. Sol. Terr. Phys., 64, 1183-1199, 2002.
Schmidlin F.J., 1991 : Rocket techniques used to measure the middle atmosphere, In: Goldberg A. (ed.), Handbook of Map, 19, 1-28.
Seidel D.J. et al., 2008 : Reference upper-air observations for climate: Rationale, progress, and plans, Bull. Am. Meteorol. Soc., 1, doi:10.1175/2008BAMS2540.1.
Seidel D.J., J. Li, C. Mears, I. Moradi, J. Nash, W.J. Randel, R. Saunders, D.W.J. Thompson, C-Z. Zou, Stratospheric temperature changes during the satellite era, J. Geophys. Res., 121, 664-681, 2016.
She C.Y., J.R. Yu, D.A. Krueger, R. Roble, P. Keckhut, A. Hauchecorne, and M.L. Chanin, vertical structure of mid-latitude temperature from stratosphere to mesopause (30-105 km),
Geophys. Res. Let., 22, 377-380, 1995.
Shine K. P., J. J. Barnett and W. J. Randel, 2008 : Temperature trends derived from Stratospheric Sounding Unit radiances: The effect of increasing CO2 on the weighting function, Geophys. Res. Lett., 35, L02710, doi:10.1029/2007GL032218.
Simmons AJ, Poli P,Dee DP, Berrisford P, Hersbach H, Kobayashi S, Peubey C. 2014. Estimating low-frequency variability and trends in atmospheric temperature using ERA-Interim. Q. J. R. Meteorol. Soc. 140: 329–353, doi: 10.1002/qj.2317.
Spencer R.W. and J.R. Christy, 1993 : Precision lower stratospheric temperature monitoring with the MSU technique: Validation and results, 1979-1991. J. Climate, 6, 1191-1204.
Steinbrecht W., H. Claude, F. Schonenborn, I.S. McDermid, T. Leblanc, S. Godin-Beekmann, P. Keckhut, A. Hauchecorne, J.A.E. Van Gijsel, D.P.J. Swart, G. Bodeker, A. Parrish, I. Boyd, N. Kampfer, C. Hocke, R.S. Stolarski S.M. Frith, L.W. Thomason, E.E. Remsberg, C. Von Savigny, A. Rozanov and J.P. Burrows, 2009 : Ozone and temperature trends in the upper stratosphere at five stations of the network for the dectection of atmospheric composition change, Int. J. Remote Sensing, 30, 3875-3886.
Steinbrecht, W., T. J. McGee, L.W. Twigg, H. Claude, F. Schonenborn, G. K. Sumnicht, and D. Silbert, Intercomparison of stratospheric ozone and temperature profiles during the October
2005 Hohenpeißenberg Ozone Profiling Experiment (HOPE), Atmos. Meas. Tech., 2, 1–21, 2009, www.atmos-meas-tech.net/2/1/2009/
Trenberth K., J.T. Fasullo, An apparent hiatus in global warming?, Earth Future, 1, 19–32, 2013, 10.1002/2013EF000165
Thompson D. W. J., D. J. Seidel, W. J. Randel, C.-Z. Zou, A. H. Butler, R. Lin, C. Long, C. Mears and A. Osso, 2013 : The mystery of recent stratospheric temperature trends, Nature, 491, 692-697.
Thompson, A. M., et al. (2003), Southern Hemisphere Additional Ozonesondes (SHADOZ) 1998–2000 tropical ozone climatology: 1. Comparison with Total Ozone Mapping Spectrometer (TOMS) and ground-based measurements, J. Geophys. Res., 108(D2), 8238, doi:10.1029/2001JD000967.
WangL. and C-Z. Zou, 2013 : Inter-comparison of SSU Temperature Data Records with Lidar, GPS RO, and MLS Observations, DOI: 10.1002/jgrd.50162.
Wild J.D., M.E. Gelman, A.J. Miller, M.L. Chanin, A. Hauchecorne, P. Keckhut, R. Farley, P.D. Dao, G.P. Gobbi, A. Adriani, F. Coneduti, I.S. McDermid, T.J. McGee, and E.F. Fishbein, Comparison of stratospheric temperature from several lidars using NMC and MLS data as transfer reference, J. Geophys. Res., 100, 11.105-11.111, 1995.
World Meteorological Organisation, 1990 : Scientific assessment of stratospheric ozone: 1989, Global Ozone Res. Monit. Proj., Geneva.
Zou, C.-Z., H. Qian, W. Wang, L. Wang, and C. Long, 2014: Recalibration and merging of SSU observations for stratospheric temperature trend studies, J. Geophys. Res. Atmos., 119, 13,180-13,205, doi:10.1002/2014JD021603.
Zou, C.-Z. and H. Qian, 2016: Stratospheric temperature climate record from merged SSU and AMSU-A observations. J. Atmos. Ocean. Tech., submitted.