HAL Id: halshs-02412947
https://halshs.archives-ouvertes.fr/halshs-02412947
Submitted on 16 Dec 2019HAL is a multi-disciplinary open access archive for the deposit and dissemination of sci-entific research documents, whether they are pub-lished or not. The documents may come from teaching and research institutions in France or abroad, or from public or private research centers.
L’archive ouverte pluridisciplinaire HAL, est destinée au dépôt et à la diffusion de documents scientifiques de niveau recherche, publiés ou non, émanant des établissements d’enseignement et de recherche français ou étrangers, des laboratoires publics ou privés.
Deep learning and voice comparison:
phonetically-motivated vs. automatically-learned
features
Cédric Gendrot, Emmanuel Ferragne, Thomas Pellegrini
To cite this version:
Cédric Gendrot, Emmanuel Ferragne, Thomas Pellegrini. Deep learning and voice comparison: phonetically-motivated vs. automatically-learned features. ICPhS, Aug 2019, Melbourne, Australia. �halshs-02412947�
DEEP LEARNING AND VOICE COMPARISON :
PHONETICALLY-MOTIVATED VS. AUTOMATICALLY-LEARNED
FEATURES
Cédric Gendrot1, Emmanuel Ferragne1, Thomas Pellegrini2
1Laboratoire de Phonétique et Phonologie (UMR7018, CNRS - Sorbonne Nouvelle) 2Institut de Recherche en Informatique de Toulouse (UMR5505, CNRS - Université de Toulouse)
[email protected], [email protected], [email protected]
ABSTRACT
Broadband spectrograms of French vowels/˜A/, /a/, /E/, /e/, /i/, /@/, and /O/ extracted from ra-dio broadcast corpora were used to recognize 45 speakers with a deep convolutional neural network (CNN). The same network was also trained with 62 phonetic parameters to i) see if the resulting con-fusions were identical to those made by the CNN trained with spectrograms, and ii) understand which acoustic parameters were used by the network. The two networks had identical discrimination results 68% of the time. In 22% of the data, the network trained with spectrograms achieved successful dis-crimination while the network trained with phonetic parameters failed, and the reverse was found in 10% of the data. We display the relevant phonetic pa-rameters with raw values and values relative to the speakers’ means and show cases favouring bad dis-crimination results. When the network trained with spectrograms failed to discriminate between some tokens, parameters related to f0 proved significant. Keywords: deep learning, voice comparison, foren-sic phonetics, vowels, phonetic parameters.
1. INTRODUCTION
Traditional phonetic analyses tend to focus on pro-duction features – realizations of specific phonemes or prosodic units – that are relatively stable across speakers, and individual strategies are frequently overlooked. In contrast, speaker recognition and forensic voice comparison seek to select phonetic features that display maximal between-speaker vari-ation. In the present work we aim at identifying phonetic invariants that are helpful for speaker char-acterization, be it for phoneticians willing to bet-ter understand the articulatory habits that are rep-resentative of speakers, or for automatic speaker recognition systems in small datasets, for exam-ple [6]. This experiment is thus closer to a voice
comparison task rather than true speaker identifica-tion. Recently, deep neural networks (DNNs) have been highly successful in speaker classification tasks when used as feature extractors with so-called bot-tleneck features [10] and embeddings [15]. Lin-ear predictive cepstral coefficients or Mel frequency cepstral coefficients are usually well-suited for these systems. However, these parameters turn out to be quite frustrating for phoneticians since, contrary to e.g. formants, they are not interpretable in articula-tory terms [1, 11].
As a preliminary step towards interpreting what DNNs predict, we ran two experiments involving a deep convolutional neural network (CNN). Firstly, speaker classification was performed with speech excerpts comprised of productions of French vow-els /˜A/, /a/, /E/, /e/, /i/, /@/, and /O/ by 45 speakers. The CNN was provided with broad-band spectrograms (SPECTRmodel hereafter). Sec-ondly, the same model architecture was trained and tested on the same vowels, but this time providing the model with acoustic measurements traditionally used by phoneticians (PHONET model henceforth) rather than spectrograms.
TheSPECTRmodel was expected to achieve better scores thanPHONET because contrary to the latter, SPECTR had the opportunity to learn its own pho-netic representations, and also, it was trained with a higher-dimensional space. Our prediction was borne out, and it is precisely the comparison between the two models and how they allow us to infer relevant phonetic features for speaker classification that con-stitutes the aim of the current work.
2. SPEECH MATERIAL AND METHOD
2.1. Vowel extractions
The vowels were extracted from the ESTER Cor-pus [3], a radio broadcast corCor-pus characterized by prepared speech [4]. France Inter, France Info and
Radio France International were the three sources and some speakers had occurrences over different radio stations. We used the phonetic alignment provided with the corpus by the IRISA (Institut de Recherche en Informatique et Systèmes Aléatoires) through the AFCP (Association Francophone de la Communication Parlée) website (http://www.afcp-parole.org/camp_eval_systemes_transcription/). Automatic alignment was used to extract vowels with a rectangular window shape and without their phonetic context, the latter being neither controlled nor provided to the network. Vowels were extracted from 35 male speakers and 10 female speakers.
2.2. Spectrograms
Based on Praat default values, we chose to use 5.0625 ms frames and 0.5 ms hop size for spectro-grams with a 16 kHz sampling rate. The speech seg-ments were element-wise multiplied by a Hamming window and padded to obtain 512-sample segments on which FFT was applied. No pre-emphasis was performed and the dynamic amplitude range was normalized to 70 dB to make sure that dynamics did not bias discrimination. Vowels whose duration was greater than 250 ms were left out; the shortest vow-els were 30 ms long. Spectrograms of vowvow-els shorter than 250 ms were padded with zeros in order for all spectrograms to have equal width. They then were converted to 8-bit grayscale images and resized to 224 × 224 pixels, where a pixel was equal to 1.15 ms in the time dimension and 35.71 Hz in terms of frequency. The conversion to 8 bits was performed so that GPU memory would handle mini-batches of sufficient size.
2.3. Measurements of phonetic parameters
Phonetic parameters were collected with Praat [2] and VoiceSauce software [13]. VoiceSauce is a Mat-lab toolbox that provides automated voice measure-ments from audio recordings. Most parameters gath-ered within VoiceSauce are measured using several software programs, thus providing several values for the same phonetic parameter.
We used the full selection of measurements, that is f0, formants F1-F4 center frequencies and band-widths, energy, cepstral peak prominence (CPP), harmonic to noise ratios (HNR), subharmonic to har-monic ratio (SHR), strength of excitation (SOE) for the uncorrected parameters. All other parameters measured by VoiceSauce are H1 (amplitude of har-monic 1), H2, H4, A1 (amplitude of formant 1), A2, A3, 2K (amplitude of the harmonic at 2kHz), 5K, H1-H2, H2-H4, H1-A1, H1-A2, H1-A3,
H4-2K, 2K-5K. These are provided as corrected (c) rel-ative to the measured formants (except for 5K), but also uncorrected (u), see [13] and [8] for more infor-mation on the parameters. The 62 parameters were measured every millisecond.
These parameters are considered to be good de-scriptors of voice quality, which is an important as-pect in voice comparison [12], and they have been used in the relevant literature [8]. Measurements of spectral moments: center of gravity (COG), kurto-sis, skewness, and standard deviation (SD) were ex-tracted with Praat. All values were normalized per vowel for all speakers on a 0-255 scale, in order to match the quantization of our spectrograms, and re-sized to 224 × 224 to conform to the fixed input size of our model. For the descriptive phonetic analy-sis we carried out after running the DNNs, values were taken at 25, 50 and 75 % temporal points and were averaged here for the sake of legibility. The spectral variation within each vowel will have to be accounted for in a follow-up study.
2.4. Model training and testing
We usedVGG16 [14], which is a popularCNNin im-age recognition. In bith experiments the model was re-trained from scratch with randomly initialized weights. The models were trained using anNVIDIA GTX1080GPUwith the Adam optimizer [7], with a
gradient decay factor of 0.900, and a squared gradi-ent decay factor of 0.999. The initial learn rate was 0.0001 and the mini-batches contained 56 spectro-grams. For each vowel and each speaker, 140 to-kens were used for training (70 %), 20 for validation (10 %), and 40 for test (20 %). One SPECTRmodel and onePHONETmodel were trained for each of the
7 vowels in our dataset.
3. RESULTS
3.1. Classification rates
The results presented in Table 1 show that features learned from spectrograms (SPECTR) score on av-erage 10-15 points above the acoustic features. The highest scores, above 69% accuracy, are highlighted in bold. For our descriptive analysis the results were split into 5 categories:
• cat. 1: PHONET was successful. • cat. 2: SPECTR successful.
• cat. 3: PHONET successful; SPECTR failed. • cat. 4: PHONET failed; SPECTR successful. • cat. 5: PHONET and SPECTR failed.
The two networks showed identical classifica-tion results for 68.0 % of the test vowels, whether
Table 1: Classification rates (%) for each vowel according to the two methods (P for PHONET and S for SPECTR). cat. ˜A a E e i @ O cat. 1 71.2 69.3 63.6 64.8 53.1 57.9 63.2 cat. 2 86.7 77.1 75.4 76.0 69.8 71.5 74.5 cat. 3 5.8 10.5 10.3 9.7 10.5 10.1 11.6 cat. 4 21.3 18.3 22.1 20.9 27.3 21.4 25.2 cat. 5 7.4 12.4 14.3 14.3 19.7 25.2 16.9 correct: 53.5 % or incorrect: 14.5 %. 22.0 % of the vowels were correctly classified with SPECTR while PHONET misclassified them, and the reverse was found in 10.0 % of the vowels. For both meth-ods,/˜A/ had the best discrimination results. Table 1 also shows that with SPECTR, the difference is more important between/˜A/ and the other vowels.
Classification results according to speaker sex were better for male speakers (67.6 %) compared to female speakers (62.0 %) with PHONET, while they were very similar with SPECTR (74.5 % vs. 76.4 %). As could be expected due to f0 and spec-tral similarity, discrimination errors were more fre-quent within the same sex but more so for male speakers compared to female speakers: 92.0 % vs. 70.0 % on average for both models. While, as is well known, some PHONET parameters (e.g. for-mants) are sensitive to differences between men and women, CNNs trained with spectrograms may be more immune to such differences – and therefore constitute effective normalization tools – because they are translation invariant [5].
3.2. Relevance of phonetic features
A MANOVA for each vowel was conducted with all phonetic parameters as dependent variables and speaker identity as independent variable. In order to test the post-hoc relevance of phonetic parameters, we also calculated the eta-squared values for uni-variate ANOVAs with speaker as independent vari-able. Only eta-squared values higher than 10 for all vowels are considered here (see Table 2). Measure-ments containing more than 25 % of undefined val-ues were discarded: pB4, SOE, pF4, epoch, & SHR. We then calculated a linear discriminant analysis, so that we could infer the weight of each acoustic pa-rameter as well as their degree of collinearity since collinearity is expected considering some measure-ments are identical phonetic parameters provided by several software. Parameters that did not show any collinearity for more than one vowel were kept for the following sections, and among parameters that
Table 2: Eta squares for each vowel for main pho-netic parameters (values above 30 % in bold).
P ˜A a E e i @ O H1c 61 55 47 50 33 47 47 H2c 43 39 38 44 23 36 40 H4c 17 25 20 19 15 20 25 H1H2c 48 51 51 20 52 51 48 A1c 20 22 16 15 8 13 16 H1A1c 47 54 47 42 12 36 38 CPP 13 14 11 13 11 10 11 energy 54 58 52 50 45 53 50 sF1 9 7 17 17 8 10 7 sF2 18 18 29 37 25 9 11 sB1 12 11 13 11 7 7 9 sB2 14 9 10 9 6 11 8 COG 27 27 24 26 13 6 19 skewness 20 22 27 30 25 36 20 kurtosis 15 17 12 24 15 35 19 SD 14 24 28 21 17 11 25 HNR35 35 34 38 36 34 38 37 pF0 47 40 38 39 37 36 34 showed collinearity, the one with the highest weight was chosen, that is HNR35, energy, H1u, H1H2u, H1H2c, H1A1u, skewness, COG, pF0, H2KH5Kc, A2u, and A3u.
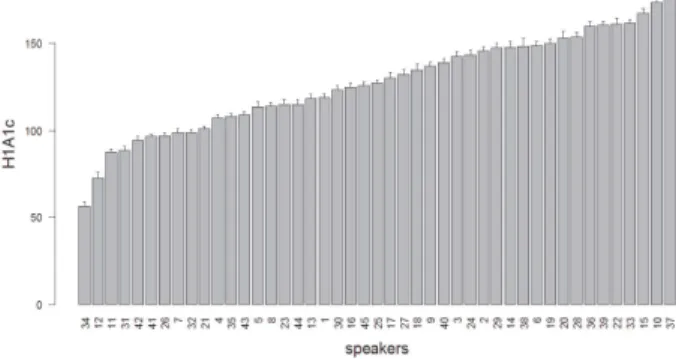
Figure 1: Mean values of H1A1c for /˜A/ re-ordered by speaker’s mean.
Fig. 1 illustrates that H1A1c values display con-sistent between-speaker variation. Phonetic param-eters with a higher eta-squared value thus imply a steeper slope between speakers.
3.3. Comparing correct and incorrect classification
By computing the mean per speaker for each pho-netic feature and for each vowel, as shown in Fig. 1 for H1A1c and /˜A/, we calculated the difference for each occurrence between its actual value and its mean for each speaker and analyzed its distance to
the mean. If the value was too far away from the mean value, then it was expected to be less typical of the speaker. Within-speaker variation therefore stands out as a plausible reason for incorrect classi-fication.
Figure 2: Mean values of H1c for all vowels ac-cording to classification results.
Fig. 2 shows occurrences where discrimination was successful (cat. 1 & 2) compared to occurrences where discrimination had failed for both PHONET and SPECTR (cat. 5), and for all vowels a signifi-cant difference was found:
• incorrect classification showed higher values than the speaker’s mean for pf0, HNR35, skew-ness, and H1A1u.
• correct classifications showed higher values for energy, H1u, H1H2u, H1H2c, H2KH5Kc, CPP, A2u, and A3u.
When comparing the complementarity of PHONET and SPECTR – that is when PHONET yielded correct classification while SPECTR had misclassifications (cat. 3 from Table 1), and vice-versa (cat. 4) – results were mostly inconsistent.
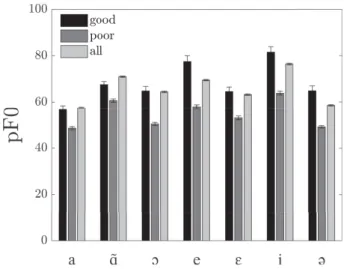
3.4. Comparing good speakers and poor speakers
In order to understand the differences between speakers who show the best results (good speakers) and those with the worst results (poor speakers), we analyzed the four male speakers with the best clas-sification results, together with the four male speak-ers with the worst results, and who were common to both methods. The four good speakers repre-sent 13.7 % (SPECTR) and 14.8 % (PHONET) of the successful predictions, while the four poor speakers represent 17.1 % (SPECTR) and 16.1 % (PHONET) of the mistakes. We used raw values this time as we only compared a few speakers with supposedly different characteristics. We considered a third cat-egory for better comparison, the mean of all the 45 speakers. We only mention here results that are sta-ble for all vowels. As can be seen in Fig. 3, the 4 speakers with the worst discrimination rates are
characterized by a lower f0 compared to the mean and compared to speakers with high discrimination rates. The same was found for H1H2u, H1H2c, and COG. They were however characterized by higher values of H1u, Energy, H1A1u, HNR35, and skew-ness.
Figure 3: F0 mean values for/˜A/ according to the classification result quality.
4. DISCUSSION AND CONCLUSION The vowel for which the best results were achieved was the nasal vowel /˜A/. It has been argued that it was better than other vowels for speaker discrim-ination [1] as the opening of the nasal cavity in these phonemes adds relevant acoustic information. Nasal vowels are also longer than oral vowels (100 ms vs 60 ms on average) and thus naturally bring more acoustic information. These results emphasize the difficulty phoneticians encounter in the acous-tic analysis of specific phonemes, like nasal vowels due to the presence of anti-formants in their spec-trum [9], or high vowel /i/, acoustic information about the first harmonics is often biased by the pres-ence of the first formant. Formants 1 to 2 and their bandwidths were poor indicators of speakers’ char-acteristics, which was expected as they are known to be good descriptors of vowel category, especially for oral vowels. We found that F4 was characterized by high eta-squared values but with many missing val-ues, this point will have to be further investigated.
Phonetic parameters like f0, energy, H1, HNR, and skweness were useful to recognize speakers, and theSPECTR model did not seem to fully take them into account. Future work will explore early/late fusion strategies to measure how phonetic features identified here as relevant might enhance perfor-mance when used in conjunction with spectrograms.
5. ACKNOWLEDGEMENTS
This work was supported by the Agence Na-tionale de la Recherche projects VOXCRIM (ANR-17-CE39-0016) & LUDAU (ANR-18-CE23-0005-01), and also partially supported by the French Investissements dâAvenir - Labex EFL program (ANR-10-LABX-0083).
6. REFERENCES
[1] Ajili, M., Bonastre, J.-F., Khedeandr, W. B., Rossato, S., Kahn, J. 2017. Phonological con-tent impact on wrongful convictions in forensic voice comparison context. Proc. IEEE Interna-tional Conference - ICASSP New Orleans. 142, p.2483.
[2] Boersma, P. 2001. Praat, a system for doing pho-netics by computer. Glot International 5:9/10, 341– 345.
[3] Galliano, S., Geoffrois, E., Mostefa, D., Bonastre, J.-F., Gravier, G. 2005. Ester phase ii evaluation campaign for the rich transcription of french broad-cast news. Proc. Interspeech Lisboa, Portugal. p. 1149–1152.
[4] Gendrot, C., Adda-Decker, M. 2005. Impact of du-ration on f1/f2 formant values of oral vowels: an automatic analysis of large broadcast news corpora in french and german. Proc. Interspeech Lisboa, Portugal. p. 2453–2456.
[5] Goodfellow, I., Bengio, Y., Courville, A. 2016. Deep Learning. Adaptive computation and ma-chine learning. Cambridge, Massachusetts: The MIT Press.
[6] Kahn, J., Audibert, N., Bonastre, J. F., Rossato, S. 2011. Inter and intraspeaker variability in french: an analysis of oral vowels and its implication for automatic speaker verification. Proc. ICPhS Hong-Kong, China.
[7] Kingma, D. P., Ba, L. J. 2015. Adam: A Method for Stochastic Optimization. International Conference on Learning Representations (ICLR). arXiv.org. [8] Kreiman, J., Keating, P., Vesselinova, N. 2017.
Acoustic similarities among voices. part 2: Male speakers. Proc. Acoustical Society of America New Orleans. 142, p.2483.
[9] Maeda, S. 1993. Acoustics of vowel nasalization and articulatory shifts in french nasal vowels. In: Huffman, M., Krakow, R., (eds), Nasals, Nasal-ization and the Velum. New York: Academic Press 147–170.
[10] Matˇejka, P., Glembek, O., Novotn`y, O., Plchot, O., Grézl, F., Burget, L., Cernock`y, J. H. 2016. Anal-ysis of dnn approaches to speaker identification. Proc. ICASSP. IEEE p. 5100–5104.
[11] Morrison, G. S., Thompson, W., C. 2017. Assess-ing the admissibility of a new generation of foren-sic voice comparison testimony. Columbia Science and Technology Law Review18, p. 326–434. [12] Nolan, F. 2007. Voice quality and forensic speaker
identification. GOVOR XXIV, 111–127.
[13] Shue, Y.-L., Keating, P., Vicenik, C., Yu, K. 2011. Voicesauce: A program for voice analysis. Proc. ICPhSHong-Kong, China. p. 1846–1849.
[14] Simonyan, K., Zisserman, A. 2015. Very Deep Convolutional Networks for Large-Scale Image Recognition. ICLR 2015 San Diego.
[15] Snyder, D., Garcia-Romero, D., Povey, D., Khu-danpur, S. 2017. Deep neural network embeddings for text-independent speaker verification. Proc. In-terspeechStockholm. p. 999–1003.