HAL Id: tel-00576728
https://tel.archives-ouvertes.fr/tel-00576728
Submitted on 15 Mar 2011
HAL is a multi-disciplinary open access
archive for the deposit and dissemination of
sci-entific research documents, whether they are
pub-lished or not. The documents may come from
teaching and research institutions in France or
abroad, or from public or private research centers.
L’archive ouverte pluridisciplinaire HAL, est
destinée au dépôt et à la diffusion de documents
scientifiques de niveau recherche, publiés ou non,
émanant des établissements d’enseignement et de
recherche français ou étrangers, des laboratoires
publics ou privés.
colorectal
Sandy Courapied
To cite this version:
Sandy Courapied. Implication de l’oncogène STAT3 dans la réponse aux traitements de
chimio-thérapies : Application au cancer colorectal. Biologie cellulaire. Université d’Angers, 2010. Français.
�tel-00576728�
R E S E A R C H
Open Access
Regulation of the Aurora-A gene following
topoisomerase I inhibition: implication of the Myc
transcription Factor
Sandy Courapied
1†, Julia Cherier
1†, Arnaud Vigneron
1, Marie-Bérangère Troadec
3, Sandrine Giraud
4, Isabelle Valo
2,
Claude Prigent
3, Erick Gamelin
1, Olivier Coqueret
1*†, Benjamin Barré
1*†Abstract
During the G2 phase of the cell cycle, the Aurora-A kinase plays an important role in centrosome maturation and progression to mitosis. In this study, we show in colorectal cell lines that Aurora-A expression is downregulated in response to topoisomerase I inhibition. Using chromatin immunoprecipitation assays, we have observed that the Myc transcription factor and its Max binding partner are associated with the Aurora-A promoter during the G2 phase of the cell cycle. RNA interference experiments indicated that Myc is involved in the regulation of the Aur-ora-A gene. Following topoisomerase I inhibition, the expression of Myc decreased whereas Mad was upregulated, and the association of Myc and Max with the promoter of the kinase was inhibited. In parallel, an increased asso-ciation of Mad and Miz-1 was detected on DNA, associated with an inhibition of the recruitment of transcriptional coactivators. Interestingly, a gain of H3K9 trimethylation and HP1g recruitment was observed on the Aurora-A pro-moter following sn38 treatment, suggesting that this propro-moter is located within SAHF foci following genotoxic treatment. Since Aurora-A is involved in centrosome maturation, we observed as expected that topoisomerase I inhibition prevented centrosome separation but did not affect their duplication. As a consequence, this led to G2 arrest and senescence induction.
These results suggest a model by which the Aurora-A gene is inactivated by the G2 checkpoint following topoi-somerase I inhibition. We therefore propose the hypothesis that the coordinated overexpression of Myc and Aur-ora-A, together with a downregulation of Mad and Miz-1 should be tested as a prognosis signature of poor responses to topoisomerase I inhibitors.
Background
The response to genotoxic treatments relies to a large extent on the activation of the ATM and ATR kinases and on the consequent upregulation of chk1 and chk2 signaling [1-3]. Among numerous substrates, this signal-ing network leads to the activation and stabilization of the p53 pathway which induces apoptosis or cell cycle arrest [4]. In addition to this protective pathway, others checkpoints are also involved in the control of the pro-gression towards mitosis. At the G1/S transition, chk1/2 activation promotes the degradation of cdc25A by the SCFbTCRP complex, leading to cdk2 inactivation and G1
phase arrest [5]. During G2 and mitosis, the inhibition of cdc25C by chk1/2 induces the inactivation of cyclin B-cdk1 complexes [6,7], whereas the BubR1, Mad1 or Mad2 proteins can prevent anaphase following spindle checkpoint activation [8].
In association with the cyclin B-cdk1 complexes and cdc25C, the Aurora-A serine/threonine kinase is also essential for progression to mitosis [9,10]. This protein localizes in early G2 to duplicated centrosomes where it plays an important role in their maturation, separation and in the consequent assembly of the spindle appara-tus. Illustrating its essential role in spindle organization, the inactivation of Aurora-A leads to the generation of spindle defects, mitotic catastrophe and aneuploidy [10,11]. Importantly, a high expression of the kinase, often due to gene amplification at 20q13, has been
* Correspondence: olivier.coqueret@univ-angers.fr; b.barre@unimedia.fr † Contributed equally
1Cancer Center Paul Papin; INSERM U892; Angers, France Full list of author information is available at the end of the article
© 2010 Courapied et al; licensee BioMed Central Ltd. This is an Open Access article distributed under the terms of the Creative Commons Attribution License (http://creativecommons.org/licenses/by/2.0), which permits unrestricted use, distribution, and reproduction in any medium, provided the original work is properly cited.
detected in several epithelial tumors such as breast, ovarian, gastric, pancreatic and colorectal cancers [9]. In addition, the overexpression of Aurora-A transforms NIH3T3 fibroblasts, probably as a consequence of abnormal mitosis and inactivation of the p53 tumor suppressor gene [12]. An abnormal expression of this kinase is therefore believed to play an important role in cell transformation and genetic instability.
Despite recent studies [13], the regulation of Aurora-A during DNA damage remains most of the time to be characterized. In this study, we show that topoisomerase I inhibitors, one the main drug used in the treatment of colorectal cancers [14,15], induced a downregulation of Aurora-A expression and prevented centrosome separa-tion. In normal conditions, we found that the Myc tran-scription factor binds to the promoter of this gene in association with Max. Following topoisomerase I inhibi-tion, Myc/Max binding is inhibited, Mad and Miz-1 associate with this promoter and this is associated with transcriptional downregulation.
Altogether, these results indicate that Aurora-A is downregulated in response to topoisomerase I inhibi-tion. We propose that this inhibition plays an important role during the G2 checkpoint in parallel to p53 induc-tion and cdc25C inactivainduc-tion.
Methods Reagents
Polyclonal anti-phospho p53 (SC-11764-R), anti-c-myc (SC-764), anti-p21waf1 (SC-397), monoclonal anti-p53 98), anti-max (C17) 197), anti-mad1 (C19) (SC-222), anti-CBP (A22) (SC369), anti-RNA polymerase II (N20) (SC899), anti-HP1 (S-19) and anti-miz1 (H190) (SC-22837) were obtained from Santa Cruz Biotechnol-ogy (Santa Cruz). Monoclonal anti-a and g-tubulin were obtained from Sigma, H3K9me3 (07-442) and anti-H3-Ac (06-599) were from Upstate. All statistical analy-sis have been performed with the Graphpad software.
Primers
Total RNA was isolated from cell lines with TRIzol reagent (Invitrogen) and expression was measured by real time PCR analysis using GADPH or RPLPO as a normalization standards. The following primers were used:
Aurora A: For 5′-GATCAGCTGGAGAGCTTAAA-3′, Rev 5′-GAGGCTTCCCAACTAAAAAT-3′; c-Myc: For 5′-ATTCTCTGCTCTCCTCGAC-3′, Rev 5′-GTAGTTG TGCTGATGTGTGG-3′; Max: For 5′-ACGAAAACG TGGGACCACATC-3′, Rev 5′-GTGTGTGGTTTTT CCCGCATAT-3′; Mad: For 5′-GGTTCGGATGAA-CATCCAG-3′, Rev 5′-GGCATCTCTGTCCTTGTTA TTGT-3′; Miz-1: For 5′-GGCAAACTGTCAG AAAA-GAGTAGC-3′, Rev 5′-CGCTGCTGGTTCAGC
TGTT-3′; p21WAF1: For 5′-GCTCCTTCCCATCGCTGTCA-3′ Rev 5′-TCACCCTGCCCAACCTTAGA-3′; GAPDH: For 5′-GAAGGTGAAGGTCGGAGTC-3′, Rev 5′-GAA-GATGGTGATGGGATTTC-3; 3′ RPLPO: For 5′-AACC CAGCTCTGGAGAAACT-3′ and Rev 5′-CCCCTGGA-GATTTTAGTGGT-3′
Cell lines and treatment
The human colorectal cell lines HT29 (HTB-38) and HCT116 (CCL-247) (ATCC, Manassas, VA20108, USA) were cultured in RPMI 1640 medium (Lonza Walkers-ville, USA). Cell lines were supplemented with 10% fetal bovine serum (PAA laboratories GmbH, Austria). Cells grown in 3% FBS medium were immediately treated with sn38 (5 ng/ml, 12.5 nM) for 48 h. Note that this treatment should be done before complete cell adhesion so that every cell can incorporate the drug before enter-ing the next S phase. To choose this concentration, clo-nogenic assays were performed to determine the concentration that kill all cells after 10 days. For HCT116 cells, 5 ng/ml induced 100% mortality.
Chromatin Immunoprecipitation Assay (ChIP)
Cells, grown to 60% confluence, were treated or not as indicated and then washed and cross-linked with 1% formaldehyde at room temperature for 8 min essentially as previously described [16,17]. Reaction was stopped with 10 ml of 125 mM glycin solution. Cells were washed with cold PBS and lysed in 500μl of lysis buffer (1% SDS, 10 mM EDTA, 50 mM Tris-HCl pH 8.1, 1 mM PMSF, 5 mM NaF, 5 mM Na3VO4, 2 μg/ml leu-peptin, 5 μg/ml aprotinin, 1 μg/ml pestatin), and soni-cated five times for 20 secondes each. Supernatants were then recovered by centrifugation at 12 000 rpm for 10 min at 4°C, diluted once in dilution buffer (1% Triton X-100, 2 mM EDTA, 150 mM NaCl, 20 mM Tris-HCl pH 8.1) and subjected to one round of immunoclearing for 2 h at 4°C with 2 μg of sheared salmon-sperm DNA, and 20 μl of proteinG-agarose coated with salmon sperm DNA (Millipore) (of 50% slurry). Immunoprecipi-tation was performed overnight with specific antibodies and IgG control, and then 2 μg of sheared salmon-sperm DNA and 20 μl of proteinG-agarose coated with salmon sperm DNA (Millipore) (of 50% slurry) were further added for 1 h at 4°C. Note that immunoprecipi-tations were performed in the presence of 0,1% Igepal CA-630. Immunoprecipitates were washed sequentially for 10 min each in TSE I (0.1% SDS, 1% Triton X-100, 2 mM EDTA, 20 mM Tris-HCl pH 8.1, 150 mM NaCl), TSE II (0.1% SDS, 1% Triton X-100, 2 mM EDTA, 20 mM Tris-HCl pH 8.1, 500 mM NaCl), and Buffer 3 (250 mM LiCl, 1% NP-40, 1% deoxycholate, 1 mM EDTA, 10 mM Tris-HCl pH 8.1). Beads precipitates were then washed once with TE buffer and eluted once with 1%
SDS, 100 mM NaHCO3. For Re-ChIP experiments 25μl of ReChIP buffer (Dilution Buffer, 10 mM DTT) was added to beads following washes and incubated at 37°C for 30 minutes. The sample was then diluted 40 times in dilution buffer and immunoprecipitations, washes and elution were performed as before ([18]). Eluates were heated at 65°C for 6 hours to reverse the formaldehyde cross-linking. DNA was precipitated using classical pro-cedures. Real-time PCR was used for ChIP analysis and quantification. The ChIP have been calculated as bind-ing to region of interest/IgG control, divided by bindbind-ing to negative control region/IgG control. The following primers were used:
region -668/-400 of the Aurora A promoter: For 5′-GAT GCCCCCTCACTATATGC-3′, Rev 5′-AGGAGA GAGCGGGATACCAA-3′; region -114/+161 of the Aur-ora A promoter: For 5′-AGGTCTGGCTGGCCGTTG-3′, Rev 5′-CCTCGTCCGCCACTGAGATAT-3′ Control region -1701/-1399 of the Aurora A promoter For 5′-ACTCCAGATCCCTCAGCTTAACCA-3′ Rev 5′-CAAG TTATGGGACGGTGAACG-3′
Other assays
Transient transfections, siRNA knockdown, RNA extrac-tion, semi-quantitative and quantitative reverse tran-scription-polymerase chain reaction, protein extracts and western blots were all performed as described pre-viously [17,19]. All experiments were performed a mini-mum of three times before calculating means and standard deviations as shown in figures.
Results
Topoisomerase I inhibition induced a downregulation of Aurora-A expression
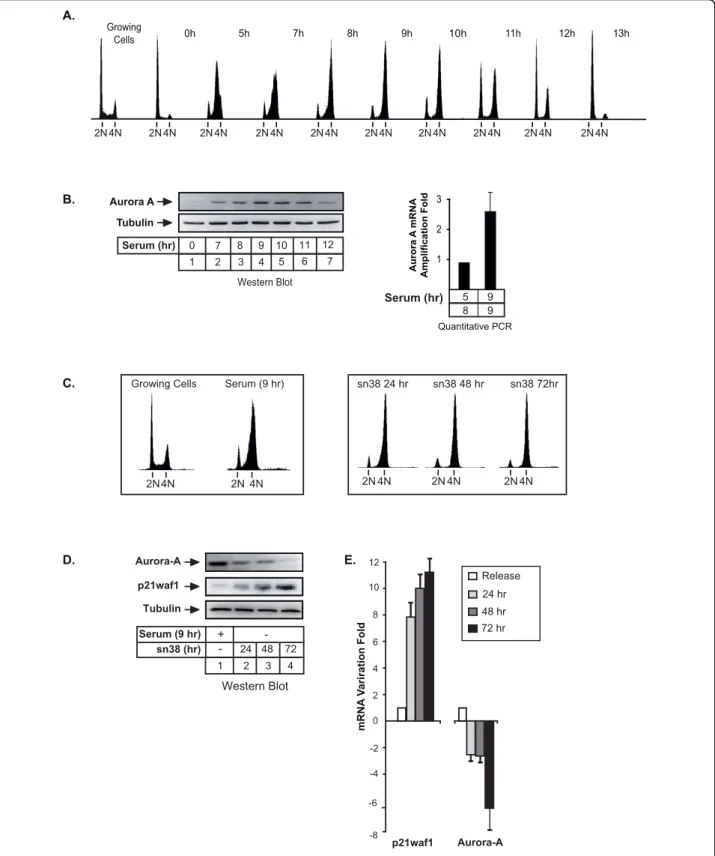
We first wanted to confirm in colorectal cell lines that Aurora-A was mainly expressed during the G2 phase of the cell cycle. To this end, HCT116 cells were synchro-nized in G1/S with hydroxyurea, washed and then grown again in serum for 5 to 13 hr. Under these condi-tions, FACS analysis showed that cells were synchro-nized after 8-9 hr in the G2 phase of the cell cycle and that they enter the next G1 phase after 12-13 hr of serum release (Figure 1A). As expected, we observed that Aurora-A was expressed in G2, both at the protein (Figure 1B, lanes 1-7) and mRNA levels (Figure 1B, lanes 8-9). The same results were obtained in a second colorectal cell line, the HT29 cells and with different kinds of synchronization such as double thymidine block and serum starvation (data not shown).
To determine whether topoisomerase I inhibition has any influence on Aurora-A expression, HCT116 cells were treated with sn38, the active metabolite of irinote-can [15]. Under these conditions, control cells were syn-chronized in the G2 phase of the cell cycle after 48-72
hr (Figure 1C, note that serum 9hr means G1/S syn-chronization followed by serum stimulation for 9 hr). Although this was the cell cycle stage when Aurora-A expression was supposed to be maximal, results indi-cated that the expression of the kinase was downregu-lated in response to sn38, both at the protein (Figure 1D, compare lane 1 with lanes 2-4) and mRNA levels (Figure 1E, normal mRNAs expression in G2 was nor-malized to 1). As a control, the p21waf1 mRNA increased as expected following genotoxic treatment. Finally, these experiments have also been repeated in a different colorectal cell line and sn38 also downregu-lated Aurora-A in HT29 cells (data not shown and see below Figure 2B).
Altogether, these results indicate that topoisomerase I inhibitors such as sn38 induced a downregulation of Aurora-A expression.
Myc binds to the promoter of the Aurora gene and is involved in its regulation
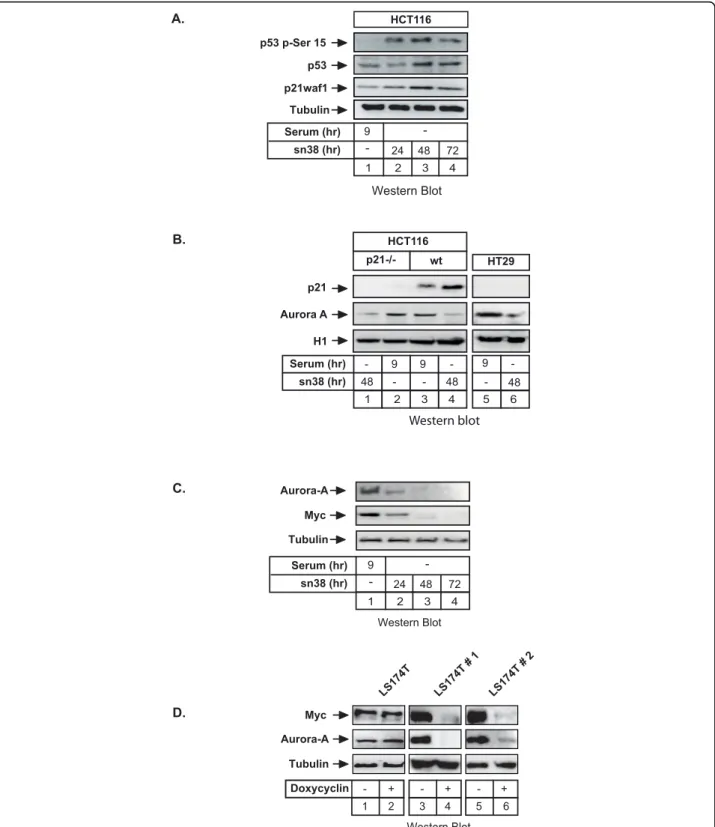
Following sn38 treatment, we observed as expected in HCT116 cells that p53 was stabilized and phosphory-lated on its serine 15 residue. Consequently, p21waf1 level was also enhanced in response to drug treatment (Figure 2A, lanes 1-4). To check whether Aurora-A downregulation was dependent on the p53-p21 pathway [20,21], we used the HCT116 p21-/- derivative cell line in which both p21waf1 alleles have been deleted by homologous recombination [22]. Results showed that sn38 reduced Aurora-A expression in HCT116 p21-/-cells (Figure 2B, lanes 1-4). The same effect was observed in the HT29 cell line that contains a mutated form of p53 (Figure 2B, lanes 5-6). These results indi-cate that Aurora-A downregulation is not cell-type spe-cific and is independent of the p53-p21 pathway.
During the course of this study, we noticed that the expression of the c-Myc transcription factor was signifi-cantly reduced following topoisomerase I inhibition (Fig-ure 2C, lanes 1-4). This suggested that c-Myc was involved in the regulation of the Aurora-A gene. To ver-ify this hypothesis, we used doxycyclin-inducible expres-sion vectors that stably drives the expresexpres-sion of two different Myc siRNAs in two different clones of the LS174T colorectal cell line. As previously shown [17], western blot analysis showed that doxycyclin induced a significant downregulation of c-Myc levels in the two clones (Figure 2D, lanes 4 and 6, top panel). Interest-ingly, we observed under these conditions that Aurora-A expression was inhibited upon c-Myc knockdown (Figure 2D, compare lanes 4 and 6 with lanes 3 and 5, middle panel). Note that c-Myc downregulation did not modify cell cycle distribution in the G2 phase of the cell cycle (data not shown) so that Aurora-A inhibition can not be explained by G0/G1 arrest.
A. 2N 4N 2N 4N 2N 4N 2N 4N 2N 4N 2N 4N 2N 4N 2N 4N 2N 4N 2N 4N B. Aurora A Tubulin Western Blot Serum (hr) 0 8 9 10 4 11 5 12 6 7 7 2 3 1 Quantitative PCR Serum (hr) 5 9 8 9 Aurora A mRNA Amplification Fold 1 2 3 C. D. Western Blot p21waf1 sn38 (hr) + - 24 48 -72 Aurora-A Tubulin Serum (9 hr) 4 2 3 1 -6 24 hr 72 hr 48 hr -8 -4 -2 6 4 2 0 p21waf1 Aurora-A mRNA V a riration Fold 8 10 12 E. Release 2N 4N sn38 24 hr sn38 48 hr sn38 72hr 2N 4N 2N 4N
Growing Cells Serum (9 hr)
2N 4N 2N 4N
Growing
Cells 0h 5h 7h 8h 9h 10h 11h 12h 13h
Figure 1 Topoisomerase I inhibition induced a downregulation of Aurora-A expression. A. HCT116 were synchronized in G1/S with hydroxyurea and released for the indicated times in growth medium complemented with 3% serum. DNA content was analyzed by flow cytometry analysis. B. Aurora-A expression was analyzed in these conditions by western blot (lanes 1-7), or quantitative RT-PCR (B, lanes 8-9) (n = 3 +/- sd). C. HCT116 cells were synchronized in the G2 phase of the cell cycle following treatment with hydroxyurea and serum stimulation for 9hr in growth medium (serum 9 hr) or treated with sn38 (5 ng/ml, 12.5 nM). DNA content was then analyzed by flow cytometry and propidium iodide staining. D-E. Aurora-A expression was measured by western blot analysis (D, lanes 1-4) or quantitative RT-PCR (E) following treatment or cell synchronisation. p21waf1 and tubulin expressions were used as controls (n = 3).
A. HCT116 Western Blot sn38 (hr) Serum (hr) -24 9 48 72 p53 p-Ser 15 p53 p21waf1 Tubulin 4 2 3 1 C. Aurora-A Tubulin Myc Western Blot sn38 (hr) Serum (hr) -24 9 48 72 D. LS174T LS174T # 1 LS174T # 2 Myc Aurora-A Tubulin Western Blot Doxycyclin - + 2 1 + -4 3 + -6 5 4 2 3 1 B. 9 9 48 48 - -- -9 48 -p21 HCT116 p21-/- wt HT29 Aurora A H1 Western blot sn38 (hr) Serum (hr) 4 2 3 5 6 1
Figure 2 Myc regulates the Aurora-A promoter. A. HCT116 cells were synchronized as above, total cell extracts were prepared and analyzed using antibodies directed against p21waf1, p53 or its serine 15 phosphorylated form (n = 3). B. HCT116 p21-/- or HT29 cells (presenting a mutated form of p53) were treated as described above and Aurora-A and p21waf1 expressions were measured by western blot using tubulin as a control (n = 3). C. HCT116 cells were synchronized in the G2 phase of the cell cycle (serum 9hr) or treated with sn38 for the indicated times. The expression of Myc and Aurora-A was analyzed by western blot on total cell extracts (n = 3). D. LS174T cells were grown in the absence or presence of doxycyclin as indicated. Myc and Aurora expressions were then analyzed by western blot analysis (n = 3). Two different clones of the LS174T colorectal cell line (named LS174T#1 and LS174T#2) were used, each expressing a doxycyclin-inducible expression vector that drives the expression of different siRNAs.
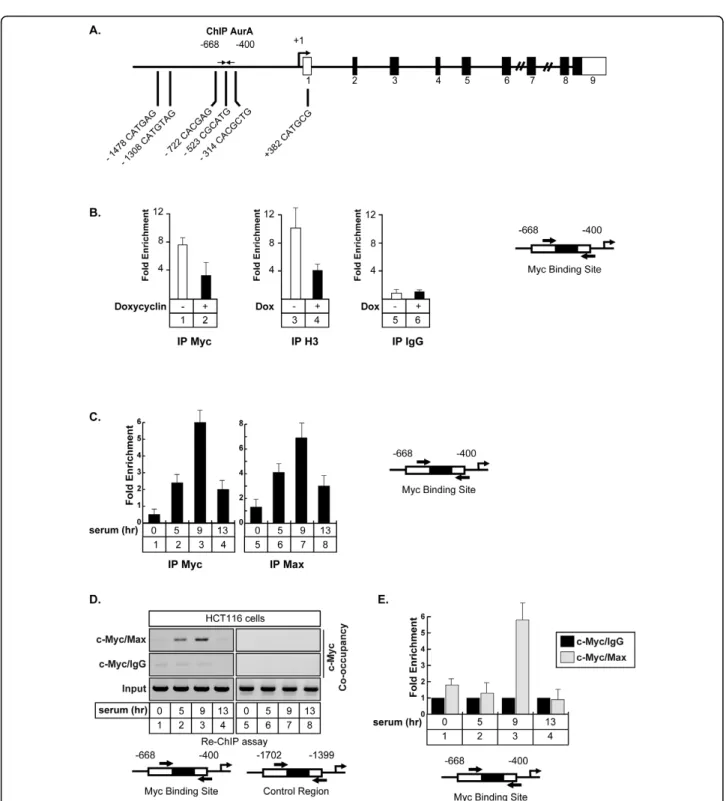
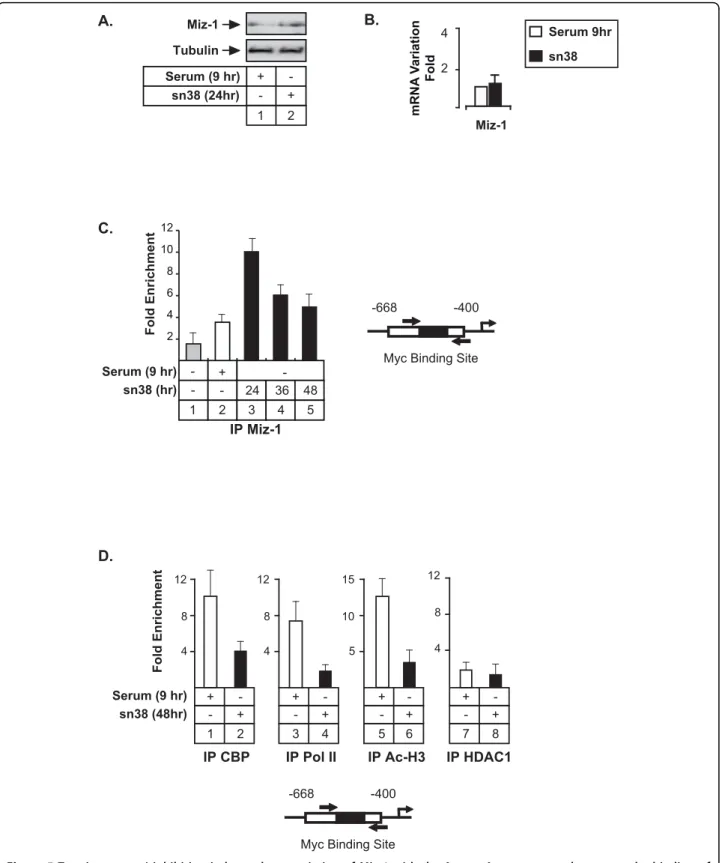
Using the UCSC genome browser http://genome.ucsc. edu, we noticed that ChIP-ChIP experiments have already suggested that Myc can potentially bind to the Aurora-A promoter in Hela cells. Moreover, Ouyang and collaborators have shown by ChIP-seq that both c-Myc and N-c-Myc can be found associated with this gene in embryonic stem cells [23]. Effectively, transcription factor recognition site analysis of the Aurora-A promo-ter revealed the presence of non canonical E-boxes that could represent potential Myc binding sites (Figure 3A). To determine if Myc binds to the Aurora A promoter, its recruitment was analyzed by chromatin immunopre-cipitation experiments (ChIP) in the LS174T cell line described above. Results presented Figure 3B, lanes 1-4, showed that Myc was effectively recruited to the -668/-400 region of the Aurora-A promoter and that this was associated with histone 3 acetylation (K9), which is indi-cative of gene transcription. Following siRNA induction and Myc downregulation, the binding of the transcrip-tion factor was downregulated and this inhibitranscrip-tion was associated with histone H3 deacetylation (Figure 3B, lanes 2 and 4). As a control, no binding of a control IgG (Figure 3B, lanes 5-6), and Myc did not bind to the 5′ part of the Aurora-A promoter (data not shown).
Myc is a basic helix-loop-helix zipper transcription factor that heterodimerizes with Max to activate gene transcription. Its activity is inhibited by Mad which associates with Max to recruit repressor complexes to promoters [24]. To determine if Myc and Max are asso-ciated with the Aurora-A promoter and if this associa-tion is cell cycle dependent, HCT116 cells were synchronized in G1/S with hydroxyurea, washed and then grown again in serum for 5 hr (S/early G2), 9 hr (G2) and 13 hr (next G1). ChIP experiments were then performed as described above. Results presented Figure 3C, lanes 3 and 7, indicate that the two proteins are effectively recruited to this promoter in the G2 phase of the cell cycle. To determine if the two proteins are asso-ciated on DNA, a serial ChIP experiment (Re-ChIP) was then performed. For this, the soluble chromatin was immunoprecipitated with Myc antibodies, the immune complexes were released with DTT and the chromatin was further divided into two aliquots and reimmunopre-cipitated with IgG or Max antibodies. Under these con-ditions, subsequent Re-IPs with Max antibodies were able to immunoprecipitate the Aurora-A promoter whereas this was not the case with the control antibody (Figure 3D). Importantly, the association of the two pro-teins was only detected during the G2 phase of the cell cycle. ChIP result have been obtained by semi-quantita-tive PCR (Figure 3D, lanes 1-4) and quantified by quan-titative-PCR (Figure 3E). As a control, the PCR analysis did not detect any occupancy of a control DNA region (Figure 3D, lanes 5-8) or of the proxymal promoter
during the G1 phase of the cell cycle and at the G1/S transition (Figure 3D, lane 4 and 1).
We concluded from these results that the Myc/Max complex binds to the promoter of the Aurora A gene during the G2 phase of the cell cycle and that Myc is involved in the regulation of this gene.
Topoisomerase I inhibition prevents the association of the Myc-Max complex with the Aurora-A promoter
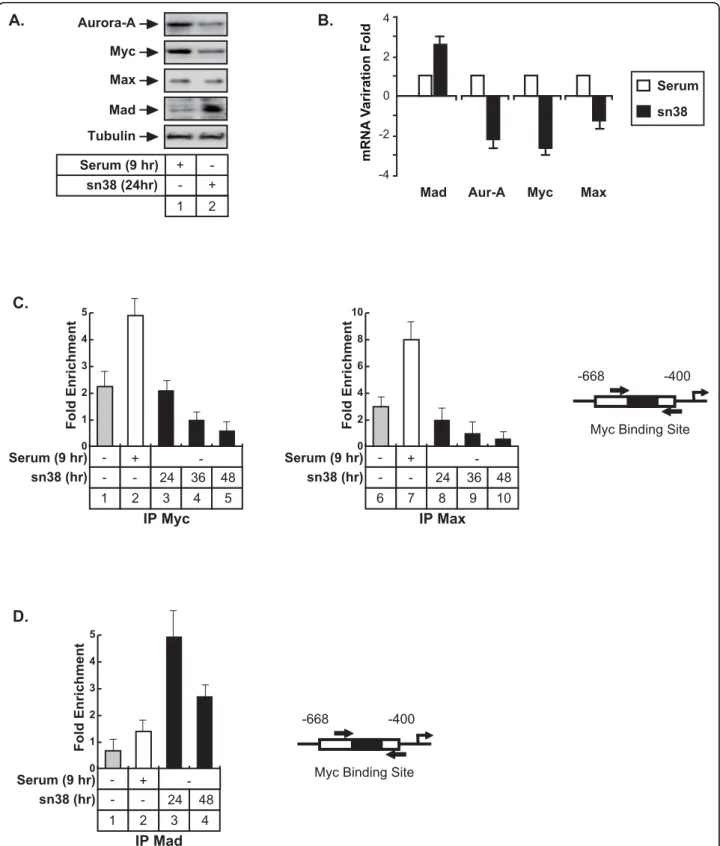
To determine the links between the Myc/Max/Mad pathway and the regulation of the Aurora-A gene fol-lowing topoisomerase I inhibition, Max/Mad expression was first evaluated following sn38 treatment. Whereas no significant effect was observed on Max expression, Mad levels increased at the protein and mRNA levels (Figure 4A, lanes 1-2 and Figure 4B). As a control, Myc and Aurora-A expressions were downregulated as expected. To determine if the binding of these proteins to the Aurora-A gene was affected by sn38, their recruitment was analyzed by ChIP following treatment. Results showed that the recruitment of Myc and Max was inhibited following topoisomerase I inhibition (Figure 4C, compare lanes 2 and 5, 7 and 9). Note that a weak association of Myc and Max was detected in growing conditions, probably due to the percentage of cells, which are in the G2 phase of the cell cycle (Figure 4C, lanes 1 and 6). Interestingly, these proteins were also found associated with the initiation site, sug-gesting that the upstream and initiation regions might associate in a transcriptional loop (data not shown). Myc and Max bindings were also inhibited on this initiation site following sn38 treatment. To extend these observations, ChIP experiments were then performed to analyze the recruitment of the Mad protein. In growing conditions or during the G2 phase of the cell cycle, Mad was not found associated with the Aurora-A promoter. Interestingly, when cells were treated with sn38, this protein was significantly recruited to this gene (Figure 4D, lanes 3-4).
Altogether, we concluded from these results that the Myc/Max complex binds to the promoter of the Aurora-A gene in the G2 phase of the cell cycle and that this binding is inhibited upon topoisomerase I inhibition.
Topoisomerase I inhibition promotes Miz-1 recruitment to the Aurora-A promoter
The Miz-1 transcription factor is a POZ-domain-con-taining zinc-finger protein that can form a transcrip-tional repressor complex with Myc to inhibit gene transcription [24]. In addition, it has also been proposed that Miz-1 functions as a transcriptional repressor in a Myc-independent manner through its association with cofactors such as BCL6 or Gfi-1 [25,26]. To determine if
Figure 3 Myc and Max are associated with the Aurora-A promoter. A. Schematic representation of the potential Myc binding sites of the Aurora-A promoter. B. LS174T cells were treated or not with doxycyclin, soluble chromatin was immunoprecipitated with Myc or anti-acetylated-H3 polyclonal antibodies and DNA samples were then amplified using primers that cover the -668/-400 region of the Aurora-A promoter. IgG immunoprecipitations were used as controls (n = 3 +/- sd). C. HCT116 were synchronized in G1/S with hydroxyurea and released for the indicated times in growth medium complemented with 3% serum. Soluble chromatin was immunoprecipitated with Myc or anti-Max antibodies and DNA samples were then amplified using primers that cover the -668/-400 region of the Aurora-A promoter and quantified as compared to IgG immunoprecipitations (n = 3 +/- sd). D, E. The association of Myc and Max on the Aurora-A promoter was analyzed by a serial ChIP experiment. HCT116 were synchronized as described above, the soluble chromatin was immunoprecipitated with Myc antibodies, immune complexes were released and reimmunoprecipitated with IgG or Max antibodies. DNA samples were then amplified using primers that cover the -668/-400 region of the Aurora-A promoter and analyzed by semi-quantitative PCR (D) or quantitative PCR (E, n = 3 +/- sd).
A.
B.
-4 -2 4 2 0 Mad mRNA V a riration FoldAur-A Myc Max
Serum sn38 Max Tubulin Mad Aurora-A Myc sn38 (24hr) Serum (9 hr) + - + -2 1
C.
Myc Binding Site
-668 -400
Myc Binding Site
-668 -400
D.
0 1 2 3 4 5 IP Myc 5 3 4 2 1 + -- - 24 36 48 sn38 (hr) Serum (9 hr) Fold Enrichment 0 2 4 6 8 10 IP Max 10 8 9 7 6 + -- - 24 36 48 sn38 (hr) Serum (9 hr) Fold Enrichment 0 1 2 3 4 5 IP Mad 3 4 2 1 + -- - 24 48 sn38 (hr) Serum (9 hr) Fold EnrichmentFigure 4 Topoisomerase I inhibition prevents the association of Myc and Max with the Aurora-A promoter. A. HCT116 were synchronized as described above and analyzed by western blot using antibodies directed against the indicated proteins (n = 3). B. Cells were treated as described above and the mRNAs expressions of Aurora-A, Myc, Max and Mad were evaluated by quantitative RT-PCR (n = 3 +/- sd). C-D. The association of Myc, Max and Mad with the Aurora-A promoter was analyzed in HCT116 by chromatin immunoprecipitation as described above (n = 3 +/- sd). ChIPs were performed using extracts isolated from growing cells (C, lanes 1 and 5, D lane 1), from cells synchronized in the G2 phase of the cell cycle (C, lanes 2 and 7, D lanes 2) or from cells treated by sn38 as indicated.
A. B. 4 2 Miz-1 mRNA V ariation Fold Serum 9hr sn38 Tubulin Miz-1 sn38 (24hr) Serum (9 hr) + - + -2 1
Myc Binding Site
-668 -400
Myc Binding Site
-668 -400 D. sn38 (48hr) Serum (9 hr) Fold Enrichment 4 8 12 IP HDAC1 + -- + 8 7 IP CBP + -- + 4 8 12 2 1 4 8 12 IP Pol II + -- + 4 3 5 10 15 IP Ac-H3 + -- + 6 5 C. 2 4 6 8 10 12 Fold Enrichment IP Miz-1 5 3 4 2 1 + -- - 24 36 48 sn38 (hr) Serum (9 hr)
Figure 5 Topoisomerase I inhibition induces the association of Miz-1 with the Aurora-A promoter and prevents the binding of transcriptional coactivators. A-B. HCT116 were treated as described above and Miz-1 expression was analyzed by western blot (n = 3) or quantitative RT-PCR (B., n = 3 +/- sd). C. ChIP analysis of Miz-1 binding to the Aurora-A promoter in growing cells (lane 1), cells synchronized in G2 (lane 2) or following sn38 treatment. D. The recruitment on the Aurora-A promoter of CBP, RNA Pol II, HDAC1 and the acetylation of histone H3 were analyzed by ChIP using soluble chromatin prepared from cells synchronized in the G2 phase of the cell cycle (serum 9hr, lanes 1, 3, 5 and 7) or treated with sn38 (lanes 2, 4, 6 and 8, n = 3 +/- sd).
this protein was involved in Aurora-A inhibition, its expression was evaluated in HCT116 cells treated or not with sn38 (Figure 5A and 5B). Under these conditions, a weak increase in Miz-1 protein level was observed whereas no significant effect was detected on its mRNA expression. ChIP experiments performed in the G2 phase of the cell cycle showed that Miz-1 was associated with the -668/-400 region (Figure 5C, lane 2). By con-trast, this protein was not significantly recruited to this gene in growing cells. Interestingly, Miz-1 recruitment was significantly increased following sn38 treatment (Figure 5C, lanes 3-5 and data not shown). Importantly, this binding was associated with a decreased recruitment of the CBP transcriptional coactivator, of the RNA type II polymerase and with a downregulation of histone H3 acetylation (Figure 5D, lanes 2, 4 and 6). We did not observe any recruitment of the HDAC1 histone deacety-lase to this promoter.
Altogether, we concluded from these results that topoisomerase I inhibition induces a recruitment of Miz-1 to the Aurora-A promoter and decreases the binding of transcriptional coactivators.
The Aurora-A promoter is located within SAHF foci following topoisomerase I inhibition
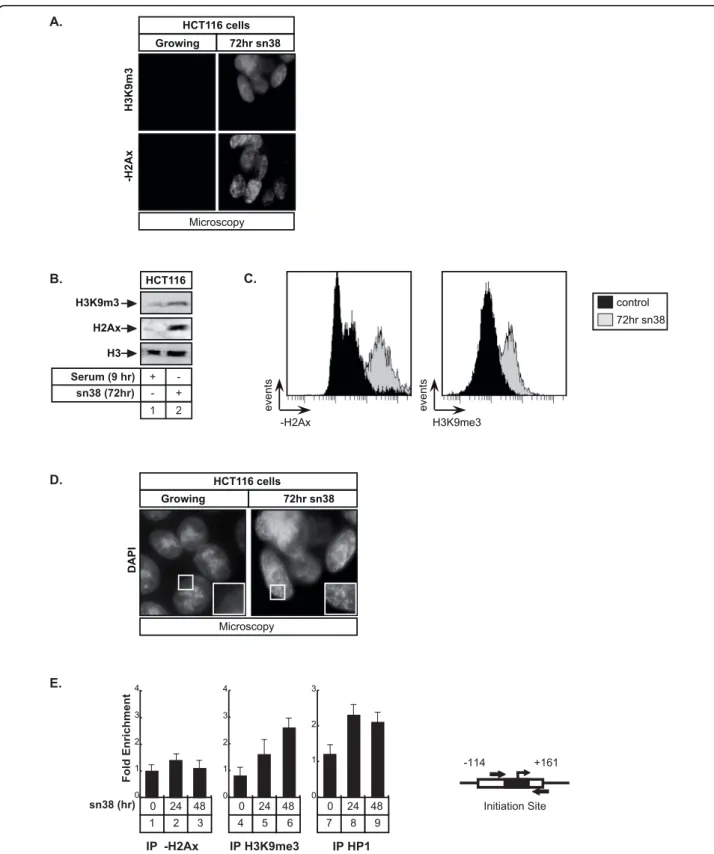
We have recently shown that sn38 treatment induced senescence in colorectal cell lines (see [19,27] and text below). Senescence is an irreversible proliferation-arrest that is characterized by the formation of isolated hetero-chromatin foci called Senescence Associated Hetero-chromatin Foci (SAHF, [28]). SAHF foci contain marks of transcriptional silencing such as heterochromatin protein 1 (HP1) and tri-methylation of the lysine 9 of histone H3 (H3K9Me3). During senescence, proliferative genes such as E2F targets are compacted within these heterochromatin foci to prevent cell cycle progression, generally as a consequence of Rb-mediated silencing. To extend our results, we then determined if the Aurora-A promoter was included within these SAHFs foci. As a first approach, we used immunofluorescence and wes-tern blot experiments to shown that sn38 induced a glo-bal increase in H3K9 trimethylation in HCT116 cells. As expected, a significant phosphorylation of histone H2Ax was also detected, reflecting the induction of DNA double strand breaks following topoisomerase I inhibition (Figure 6A and 6B). Results were quantified by Facs analysis to show a significant increase of the two signals (Figure 6C). DAPI staining also showed an increase in the presence of punctuate heterochromatin foci in the nucleus of sn38-treated cells which were not detected in control conditions (Figure 6D). ChIP experi-ments were then used to determine if proteins involved in transcriptional silencing could be found associated with the proxymal promoter of the Aurora-A gene
following treatment. Interestingly, results presented Figure 6E, lanes 4-9, showed that HP1g was recruited to this gene in sn38-treated cells. In addition, we also noticed a significant increase in the amount of tri-methylated H3K9 on the proxymal Aurora-A promoter. By contrast, when ChIP experiments were repeated with an antibody directed against the phosphorylated form of histone H2AX, no signs of DNA double strand breaks were detected within this gene.
In light of these results, we concluded that the Aur-ora-A proxymal promoter is located within SAHF foci following genotoxic treatment and that its inhibition is probably related to the recruitment of cofactors involved in transcriptional silencing such as HP1g and to the tri-methylation of H3K9.
Topoisomerase I inhibition prevents centrosome separation
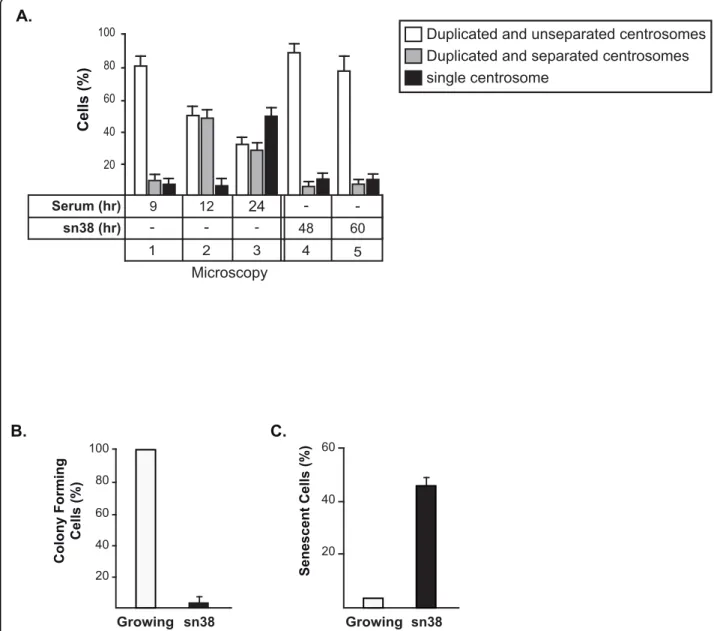
It has been shown that Aurora-A is involved in the maturation and separation of centrosome during progres-sion from S phase towards mitosis [29]. To determine if topoisomerase I inhibition prevents this maturation, cen-trosome formation was analyzed by immunofluorescence and g-tubulin staining. When cells were synchronized in the G2/M phase of the cell cycle, the centrosomes were effectively stained as a doublet and Aurora-A was essen-tially localized on the centrosomes. As expected, when cells were treated with sn38, Aurora-A became undetect-able by immunofluorescence (data not shown). Interest-ingly, genotoxic treatment dit not prevent centrosome duplication, however, no separation was observed under these conditions (Figure 7A). Probably as a consequence of the absence of centrosomal separation and of progres-sion towards mitosis, we observed using clonogenic assays that sn38 induced a complete inhibition of cell proliferation (Figure 7B). Using beta-galactosidase stain-ing, we also noticed an induction of senescence following genotoxic treatment (Figure 7C).
Thus, we concluded from these results that topoi-somerase I inhibition prevents centrosome separation, probably as a consequence of Aurora-A inhibition, and that this leads to G2 arrest and senescence induction.
Discussion
In this study, we have shown that the Aurora-A gene is inhibited upon topoisomerase I inhibition. In normal conditions, the Myc transcription factor is recruited to the promoter of the Aurora-A gene in association with its binding partner Max. Following topoisomerase I inhi-bition, Mad proteins increase, the association of Myc and Max with the Aurora-A promoter is inhibited, the Mad and Miz-1 proteins are recruited to DNA and this is fol-lowed by transcriptional downregulation. Probably as a consequence of the downregulation of the Myc-Aurora A
Initiation Site -114 +161 IP -H2Ax IP H3K9me3 IP HP1 Fold Enrichment sn38 (hr) E. 2 3 1 0 24 48 0 1 2 3 4 5 6 4 0 24 48 0 1 2 3 4 8 9 7 0 24 48 0 1 2 3 C. control 72hr sn38 events H3K9me3 events -H2Ax D. HCT116 cells Growing 72hr sn38 Microscopy DAPI Microscopy HCT116 cells Growing 72hr sn38 H3K9m3 -H2Ax A. HCT116 H3K9m3 H2Ax H3 sn38 (72hr) Serum (9 hr) + - + -2 1 B.
Figure 6 The Aurora-A promoter is located within SAHF foci following sn38 treatment. A, B and C. HCT116 cells were treated with sn38 as described above and H2Ax phosphorylation and H3K9 trimethylation were analyzed by immunofluorescence (A), western blot (B) or FACS (C, n = 3). D. SAHF formation was analyzed in growing cells or following treatment by immunofluorescence using DAPI staining (one experiment representative of three). E. HCT116 were treated as described above and the recruitment on the Aurora-A promoter of HP1g, the trimethylation of histone H3K9 and the phosphorylation of histone H2Ax were analyzed by ChIP using soluble chromatin prepared from cells treated or with sn38 (n = 3 +/- sd)
pathway, genotoxic treatment also prevented centrosome separation. In light of these results, we propose that the downregulation of the Aurora-A gene is one of the essen-tial events of G2 arrest occurring in response to topoi-somerase I inhibition.
Gene transcription is regulated at multiple steps including DNA binding of transcription factors, recruit-ment of the basal transcriptional apparatus and elonga-tion of mRNA synthesis. Activaelonga-tion is also affected by several complexes that affect nucleosomal structure [30] such as histone acetyltransferase (HATs) proteins and
chromatin remodeling complexes. In light of our results, we speculate that Myc is associated with Max on the Aurora-A promoter to allow the recruitment of tran-scriptional coactivators previously shown to be associated with Myc, such as TRAPP, a subunit of the TIP60 histone acetylase complex, or TIP48 and TIP49, two ATPases involved in chromatin remodeling [31]. In addition, Myc can also regulate the elongation program through its association with the P-TEFb complex and cdk9 [32,33]. It will be interesting to determine if Myc regulates the elon-gation process on the Aurora-A gene as previously
B.
C.
Growing 20 40 60 sn38 Senescent Cells (%) Growing sn38 Colony Forming Cells (%) 20 40 60 80 100A.
Cells (%) 20 40 60 80100 Duplicated and unseparated centrosomes
single centrosome
Duplicated and separated centrosomes
Microscopy sn38 (hr) Serum (hr) - -24 -9 12 - 48 4 -60 5 2 3 1
Figure 7 Topoisomerase I inhibition prevents centrosome separation. A. HCT116 cells synchronized or treated with sn38 as described above were subjected to immunofluorescence analysis. Centrosomes were detected by staining with monoclonal antibody tog-tubulin. ~ 100 cells were analyzed for each experiment, (n = 3 +/- sd). B. HCT116 cells were treated with sn38 (5 ng/ml, 12.5 nM) and further grown for 7-9 days. Colony formation was then counted using an inverted microscope, and for each cell line, growth of non treated cells was set up at 100%. Clonogenic survival was then plotted as a fraction relative to these untreated cells (n = 5 +/- sd). C. In parallel, the percentage of senescent cells was evaluated as the number of cells expressing SA-b-gal activity (n = 3).
reported on the cad promoter [32,33], or if its effects rely on the recruitment of histone acetylases and chromatin remodeling complexes. We have previously shown that topoisomerase I inhibition induced senescence in color-ectal cancers [19]. It has been proposed that this program is associated with chromatin reorganization of prolifera-tion genes into senescence-associated heterochromatin foci (SAHFs) [28]. Silencing depends on the retinoblas-toma pathway and is associated with enhanced histone H3 tri-methylation and recruitment of the HP1 protein on proliferative genes. Interestingly, we have effectively observed that SAHFs are present in colorectal cancer cells treated with sn38 and that topoisomerase I inhibi-tion is associated with the recruitment of HP1g and tri-methylation of H3K9me3 on the Aurora-A promoter.
Since Miz-1 interacts with transcriptional repressors such as Gfi-1, Dnmt3a or BCL6 to downregulate gene transcription [25,26,34,35], a Miz repressor complex could inactivate the Aurora-A promoter by initiating SAHFs formation on this gene. Since SAHFs formation has been initially described to be associated with tran-scriptional silencing induced by the Rb protein, our results also suggest that this gene might be a target of this suppressor pathway. Note however that we have not been able to detect the expression of the p16INK4 pro-tein in our conditions. Thus, if the Aurora-A promoter is regulated by the Rb protein following sn38 treatment, this does probably not rely on p16INK4.
Accumulating evidences indicate that Myc or Aurora A overexpression is associated with chromosomal
sn38
Top I
Cleavage Complex
DNA Damage
Normal Conditions Myc Overexpressing Cells
+ + + -Aurora-A Gene Myc RNA Pol II Aurora-A Gene
Cell Cycle Arrest
Aurora-A Gene RNA Pol II Aurora-A Gene Genomic Instability Drug Resistance RNA Pol II Max Mad Mad Miz-1 Max Myc Max Myc Myc Myc Max Miz-1 Myc
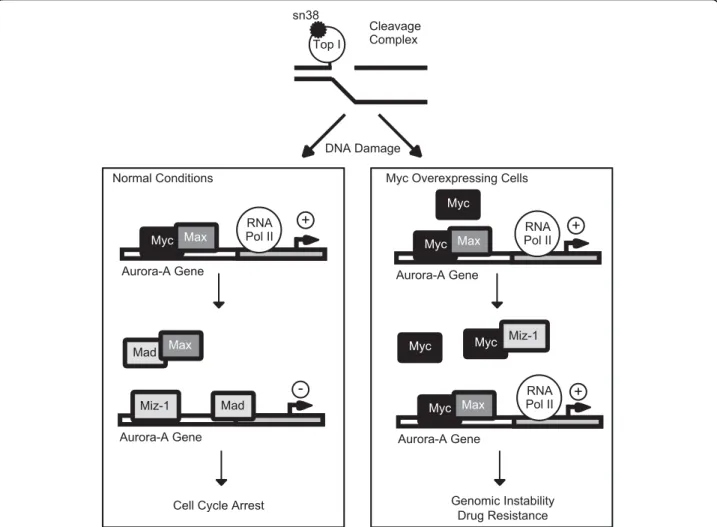
Figure 8 Proposed hypothesis for the role of the Myc-Aurora-A pathway in response to topoisomerase I inhibition. In normal conditions, the Aurora-A gene is activated and Myc binds to its promoter in association with Max. Upon treatment, sn38 binds to the
topoisomerase I and induces the formation of cleavage complexes. This induces a dowregulation of Myc and an increase in the expression of Mad. Myc/Max binding is inhibited and Mad and/or Miz-1 binds to the Aurora-A promoter. Although this remains to be shown, we speculate that these proteins associates with transcriptional inhibitors such as Gfi-1 or Dnmt3a to induce SAHF foci and Aurora-A downregulation. In colorectal tumors overexpressing Myc, the Myc/Max complex remains associated with the Aurora-A promoter due to a high level of expression and to a downregulation of Mad and Miz-1 expression. As a consequence, Aurora is overexpressed, this protein is not inhibited by
instability [10,12,36]. Since both oncogenes play an important role in colorectal cancers, we have started to determine if this oncogenic pathway is associated with genomic instability in colorectal cancers. Preliminary data indicate that the vast majority of colorectal tumors showed a high degree of aneuploidy correlated with an enhanced expression level of Myc and Aurora A. A downregulation of Miz-1 and of the p21waf1 cell cycle inhibitor was also observed. In light of these results, we propose the hypothesis that the dysregulation the Myc-Aurora A pathway is an important event leading to genomic instability through the bypass of the G2/M checkpoints. We speculate that tumors expressing abnormal levels of Myc together with a high expression of Aurora-A might be resistant to DNA-topoisomerase I inhibitors such as irinotecan. The downregulation of the p21waf1 protein is also probably an essential event to allow the inactivation of the senescence program. For this reason, we propose the hypothesis that the coordi-nated overexpression of Myc and Aurora-A, together with a downregulation of Miz-1 should be tested as a prognosis signature of poor responses to topoisomerase I inhibitors (Figure 8). This signature should help to define in advance the subsets of tumors that will fail to respond to chemotherapy.
Conclusions
Following DNA damage, the ATM/ATR/chk pathway is activated to induce the upregulation of the p53 tumor suppressor and the consequent activation of the p21waf1 gene. In parallel, the cdc25 phosphatases are inactivated, leading to cdk inhibition and cell cycle arrest. Using colorectal cancer cell lines, we show that the Aurora-A gene is also downregulated following topoisomerase I inhibition and that this effect is prob-ably related to a decreased recruitment of the Myc tran-scription factor to its promoter. We propose the hypothesis that tumors expressing high levels of the Myc-Aurora-A pathway might be resistant to topoi-somerase I inhibitors.
Acknowledgements
This work was supported by a fellowship (to A.V and S.C) and a grant from Institut National du Cancer and from the Ligue contre le Cancer (Equipes labélisées 2007 to O.C, C.P and E.G), a grant from Canceropole Grand Ouest (O.C, C.P and E.G.) and a fellowship from INSERM-Region and Rotary (to J.C). Author details
1
Cancer Center Paul Papin; INSERM U892; Angers, France.2Cancer Center Paul Papin; Biopathology Department, France.3CNRS UMR 6061, Université de Rennes I, IFR140, France.4EA 3142, Université d’Angers, France. Authors′ contributions
JC, SC performed most experiments, including mRNA, protein, ChIPs and cell cycle analysis and SC also helped editing the manuscript. AV made senescence and proliferation assays whereas MBT did cloning experiments.
SG and IV analyzed the data. EG, CP, BB and OC provided the suggests and wrote the paper. All authors read and approved the final manuscript. Competing interests
The authors declare that they have no competing interests. Received: 16 March 2010 Accepted: 3 August 2010 Published: 3 August 2010
References
1. Bartek J, Lukas J: Chk1 and Chk2 kinases in checkpoint control and cancer. Cancer Cell 2003, 3:421-429.
2. Su TT: Cellular responses to DNA damage: one signal, multiple choices. Annu Rev Genet 2006, 40:187-208.
3. Rajagopalan H, Lengauer C: Aneuploidy and cancer. Nature 2004, 432:338-341.
4. Vousden KH, Lu X: Live or let die: the cell′s response to p53. Nat Rev Cancer 2002, 2:594-604.
5. Mailand N, Falck J, Lukas C, Syljuasen RG, Welcker M, Bartek J, Lukas J: Rapid destruction of human Cdc25A in response to DNA damage. Science 2000, 288:1425-1429.
6. Peng CY, Graves PR, Thoma RS, Wu Z, Shaw AS, Piwnica-Worms H: Mitotic and G2 checkpoint control: regulation of 14-3-3 protein binding by phosphorylation of Cdc25C on serine-216. Science 1997, 277:1501-1505. 7. Sanchez Y, Wong C, Thoma RS, Richman R, Wu Z, Piwnica-Worms H,
Elledge SJ: Conservation of the Chk1 checkpoint pathway in mammals: linkage of DNA damage to Cdk regulation through Cdc25. Science 1997, 277:1497-1501.
8. Fang G, Yu H, Kirschner MW: The checkpoint protein MAD2 and the mitotic regulator CDC20 form a ternary complex with the anaphase-promoting complex to control anaphase initiation. Genes Dev 1998, 12:1871-1883.
9. Zhou H, Kuang J, Zhong L, Kuo WL, Gray JW, Sahin A, Brinkley BR, Sen S: Tumour amplified kinase STK15/BTAK induces centrosome amplification, aneuploidy and transformation. Nat Genet 1998, 20:189-193.
10. Giet R, Petretti C, Prigent C: Aurora kinases, aneuploidy and cancer, a coincidence or a real link? Trends Cell Biol 2005, 15:241-250. 11. Meraldi P, Honda R, Nigg EA: Aurora kinases link chromosome
segregation and cell division to cancer susceptibility. Curr Opin Genet Dev 2004, 14:29-36.
12. Meraldi P, Honda R, Nigg EA: Aurora-A overexpression reveals
tetraploidization as a major route to centrosome amplification in p53-/-cells. Embo J 2002, 21:483-492.
13. Krystyniak A, Garcia-Echeverria C, Prigent C, Ferrari S: Inhibition of Aurora A in response to DNA damage. Oncogene 2006, 25:338-348.
14. Pommier Y, Redon C, Rao VA, Seiler JA, Sordet O, Takemura H, Antony S, Meng L, Liao Z, Kohlhagen G, et al: Repair of and checkpoint response to topoisomerase I-mediated DNA damage. Mutat Res 2003, 532:173-203. 15. Pommier Y: Topoisomerase I inhibitors: camptothecins and beyond. Nat
Rev Cancer 2006, 6:789-802.
16. Bienvenu F, Barre B, Giraud S, Avril S, Coqueret O: Transcriptional Regulation by a DNA-associated Form of Cyclin D1. Mol Biol Cell 2005, 16:1850-1858, Epub 2005 Jan 1819.
17. Barré B, Vigneron A, Coqueret O: The STAT3 transcription factor is a target for the Myc and retinoblastoma proteins on the Cdc25A promoter. J Biol Chem 2005, 280:15673-15681.
18. Barre B, Perkins ND: The Skp2 promoter integrates signaling through the NF-kappaB, p53, and Akt/GSK3beta pathways to regulate autophagy and apoptosis. Mol Cell 2010, 38:524-538.
19. Vigneron A, Gamelin E, Coqueret O: The EGFR-STAT3 oncogenic pathway up-regulates the Eme1 endonuclease to reduce DNA damage after topoisomerase I inhibition. Cancer Res 2008, 68:815-825.
20. Vigneron A, Cherier J, Barre B, Gamelin E, Coqueret O: The cell cycle inhibitor p21waf1 binds to the myc and cdc25A promoters upon DNA damage and induces transcriptional repression. J Biol Chem 2006, 281:34742-34750.
21. Vigneron A, Roninson IB, Gamelin E, Coqueret O: Src inhibits adriamycin-induced senescence and G2 checkpoint arrest by blocking the induction of p21waf1. Cancer Res 2005, 65:8927-8935.
22. Waldman T, Lengauer C, Kinzler KW, Vogelstein B: Uncoupling of S phase and mitosis induced by anticancer agents in cells lacking p21. Nature 1996, 381:713-716.
23. Ouyang Z, Zhou Q, Wong WH: ChIP-Seq of transcription factors predicts absolute and differential gene expression in embryonic stem cells. Proc Natl Acad Sci USA 2009, 106:21521-21526.
24. Wanzel M, Herold S, Eilers M: Transcriptional repression by Myc. Trends Cell Biol 2003, 13:146-150.
25. Phan RT, Saito M, Basso K, Niu H, Dalla-Favera R: BCL6 interacts with the transcription factor Miz-1 to suppress the cyclin-dependent kinase inhibitor p21 and cell cycle arrest in germinal center B cells. Nat Immunol 2005, 6:1054-1060.
26. Basu S, Liu Q, Qiu Y, Dong F: Gfi-1 represses CDKN2B encoding p15INK4B through interaction with Miz-1. Proc Natl Acad Sci USA 2009,
106:1433-1438.
27. Courapied S, Sellier H, De Carne Trecesson S, Vigneron A, Bernard AC, Gamelin E, Barre B, Coqueret O: The cdk5 kinase regulates the STAT3 transcription factor to prevent DNA damage Upon topoisomerase I inhibition. J Biol Chem 2010, PMID: 20516069.
28. Narita M, Nunez S, Heard E, Narita M, Lin AW, Hearn SA, Spector DL, Hannon GJ, Lowe SW: Rb-mediated heterochromatin formation and silencing of E2F target genes during cellular senescence. Cell 2003, 113:703-716.
29. Kramer A, Lukas J, Bartek J: Checking out the centrosome. Cell Cycle 2004, 3:1390-1393.
30. Kingston RE, Narlikar GJ: ATP-dependent remodeling and acetylation as regulators of chromatin fluidity. Genes Dev 1999, 13:2339-2352. 31. Adhikary S, Eilers M: Transcriptional regulation and transformation by
Myc proteins. Nat Rev Mol Cell Biol 2005, 6:635-645.
32. Eberhardy SR, Farnham PJ: c-Myc mediates activation of the cad promoter via a post-RNA polymerase II recruitment mechanism. J Biol Chem 2001, 276:48562-48571.
33. Eberhardy SR, Farnham PJ: Myc recruits P-TEFb to mediate the final step in the transcriptional activation of the cad promoter. J Biol Chem 2002, 277:40156-40162.
34. Herold S, Wanzel M, Beuger V, Frohme C, Beul D, Hillukkala T, Syvaoja J, Saluz HP, Haenel F, Eilers M: Negative regulation of the mammalian UV response by Myc through association with Miz-1. Mol Cell 2002, 10:509-521.
35. Wanzel M, Kleine-Kohlbrecher D, Herold S, Hock A, Berns K, Park J, Hemmings B, Eilers M: Akt and 14-3-3eta regulate Miz1 to control cell-cycle arrest after DNA damage. Nat Cell Biol 2005, 7:30-41.
36. Vafa O, Wade M, Kern S, Beeche M, Pandita TK, Hampton GM, Wahl GM: c-Myc can induce DNA damage, increase reactive oxygen species, and mitigate p53 function: a mechanism for oncogene-induced genetic instability. Mol Cell 2002, 9:1031-1044.
doi:10.1186/1476-4598-9-205
Cite this article as: Courapied et al.: Regulation of the Aurora-A gene following topoisomerase I inhibition: implication of the Myc transcription Factor. Molecular Cancer 2010 9:205.
Submit your next manuscript to BioMed Central and take full advantage of:
• Convenient online submission • Thorough peer review
• No space constraints or color figure charges • Immediate publication on acceptance
• Inclusion in PubMed, CAS, Scopus and Google Scholar • Research which is freely available for redistribution
Submit your manuscript at www.biomedcentral.com/submit
The cdk5 Kinase Regulates the STAT3 Transcription Factor to
Prevent DNA Damage upon Topoisomerase I Inhibition
*
Received for publication, December 7, 2009, and in revised form, May 10, 2010 Published, JBC Papers in Press, June 1, 2010, DOI 10.1074/jbc.M109.092304 Sandy Courapied1, He´le`ne Sellier1, Sophie de Carne´ Tre´cesson, Arnaud Vigneron, Anne-Charlotte Bernard, Erick Gamelin, Benjamin Barre´, and Olivier Coqueret2
From the Paul Papin Cancer Center, INSERM U892, 2 rue Moll, 49933 Angers, France
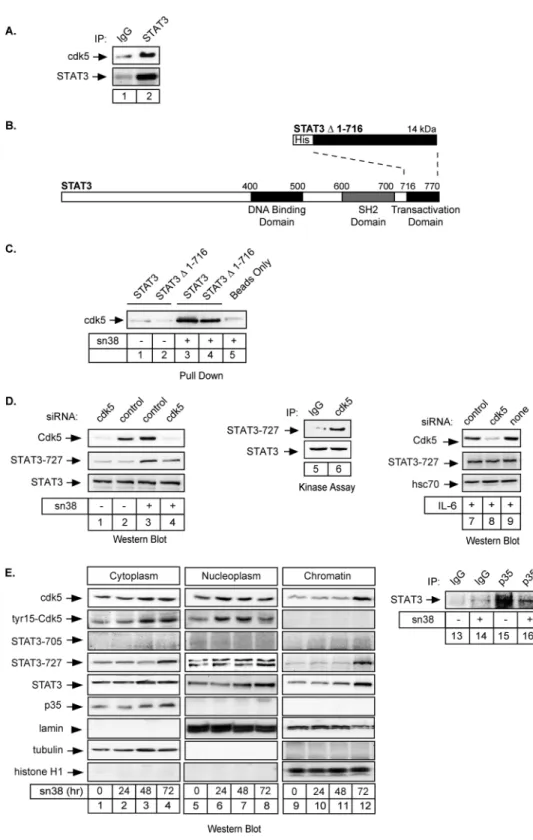
The STAT3 transcription factors are cytoplasmic proteins that induce gene activation in response to growth factor stimu-lation. Following tyrosine phosphorylation, STAT3 proteins dimerize, translocate to the nucleus, and activate specific target genes involved in cell-cycle progression. Despite its importance in cancer cells, the molecular mechanisms by which this protein is regulated in response to DNA damage remain to be character-ized. In this study, we show that STAT3 is activated in response to topoisomerase I inhibition. Following treatment, STAT3 is phosphorylated on its C-terminal serine 727 residue but not on its tyrosine 705 site. We also show that topoisomerase I inhibition induced the up-regulation of the cdk5 kinase, a pro-tein initially described in neuronal stress responses. In co-im-munoprecipitations, cdk5 was found to associate with STAT3, and pulldown experiments indicated that it associates with the C-terminal activation domain of STAT3 upon DNA damage. Importantly, the cdk5-STAT3 pathway reduced DNA damage in response to topoisomerase I inhibition through the up-regula-tion of Eme1, an endonuclease involved in DNA repair. ChIP experiments indicated that STAT3 can be found associated with the Eme1 promoter when phosphorylated only on its serine 727 residue and not on tyrosine 705. We therefore propose that the cdk5-STAT3 oncogenic pathway plays an important role in the expression of DNA repair genes and that these proteins could be used as predictive markers of tumors that will fail to respond to chemotherapy.
Signal transducer and activator of transcription 3 (STAT3)3
proteins are cytoplasmic transcription factors that translocate into the nucleus following growth factor stimulation. In con-trast to normal cells where its phosphorylation is only transient, constitutive activation of STAT3 has been reported in several primary cancers and tumor cell lines (1–3). This abnormal acti-vation is due to oncogenic kinases such as epidermal growth
factor receptor, Her2/Neu, src, or bcr-abl, which induce STAT3 activation through phosphorylation of its tyrosine 705 residue (4). This phosphorylation allows the nuclear transloca-tion and DNA binding of the STAT3 dimer and the up-regula-tion of several genes involved in cell-cycle and cell survival such as cyclin D1, Myc, or bclxl. The up-regulation of these cancer genes mediates the oncogenic activity of STAT3 and its ability to transform cells (5).
A second phosphorylation occurs on the serine 727 residue of the C-terminal activation domain. It has been proposed that this phosphorylation is necessary for maximal gene activation, because its mutation prevents STAT3 transcriptional function (6). It is believed that this modification favors the recruitment of transcriptional cofactors such as CBP, NcoA, or P-Tefb that binds to the C-terminal domain of the transcription factor (7–10). However, it remains to be determined if the association of STAT3 with its coactivators is a direct consequence of Ser-727 phosphorylation.
Although it was initially believed that the tyrosine phosphor-ylation is essential for STAT3 activity, several groups have recently reported that specific forms of the transcription factor, which are only phosphorylated on its Ser-727 residue, can induce gene activation. In prostate cancer, Ser-727 phosphory-lation is sufficient to activate STAT3 and drive tumorigenesis in the absence of tyrosine 705 activation (11). Elegant results have shown that tyrosine 705 mutants can associate with NF-B and induce the expression of genes such as mras or met, which are likely to play an important role in cell transformation by STAT3 (12–14). These results lead to the important conclusion that the influence of STAT3 on cell transformation can be independent of the tyrosine 705 phosphorylation and that this site should not be considered as a unique marker of STAT3 oncogenic activity.
This conclusion also leads to the hypothesis that STAT3 can induce different transcriptional programs, depending on which sites are phosphorylated and certainly on the type of stimula-tion. Although STAT3 activation is well characterized in response to growth factor stimulation, little is known about its regulation in response to other stimulation such as DNA dam-age and chemotherapy treatment. Interestingly, several studies have suggested that an abnormal activation of this transcription factor is associated with intrinsic drug resistance (15). STAT3 expression has been associated with resistance to radiation-induced apoptosis (16 –18), and it can also confer resistance to Fas or paclitaxel-mediated apoptosis in multiple myeloma and ovarian cancer (19, 20). Most of the time, escape to drug treat-ment is related to the STAT3-mediated expression of survival
*This work was supported by fellowships (to S. C. and A. V.), by a grant (Equipe Labelise´e) from the Ligue Contre le Cancer and Institut du Cancer, and a fellowship from Inserm-Pays de Loire (to S. C. T.), and by the Minis-te`re de la Recherche (to H. S.).
1Both authors contributed equally to this work.
2To whom correspondence should be addressed: Centre Re´gional de Lutte Contre le Cancer Paul Papin, INSERM U892 2 rue Moll, 49033 Angers, France. Tel.: 33-2-41-35-29-14; E-mail: olivier.coqueret@univ-angers.fr. 3The abbreviations used are: STAT3, signal transducers and activators of
tran-scription 3; ChIP, chromatin immunoprecipitation; CBP, CREB-binding pro-tein; cdk, cyclin-dependent kinase; siRNA, small interference RNA; PBS, phosphate-buffered saline; RT, reverse transcription; IL-6, interleukin-6; FACS, fluorescent-activated cell sorting.
AUGUST 27, 2010 • VOLUME 285 • NUMBER 35 JOURNAL OF BIOLOGICAL CHEMISTRY
26765
at INSERM, on September 3, 2010
www.jbc.org
STAT3 pathway can prevent senescence induction (23) and activate DNA repair genes (24) to confer resistance to chemo-therapy treatments.
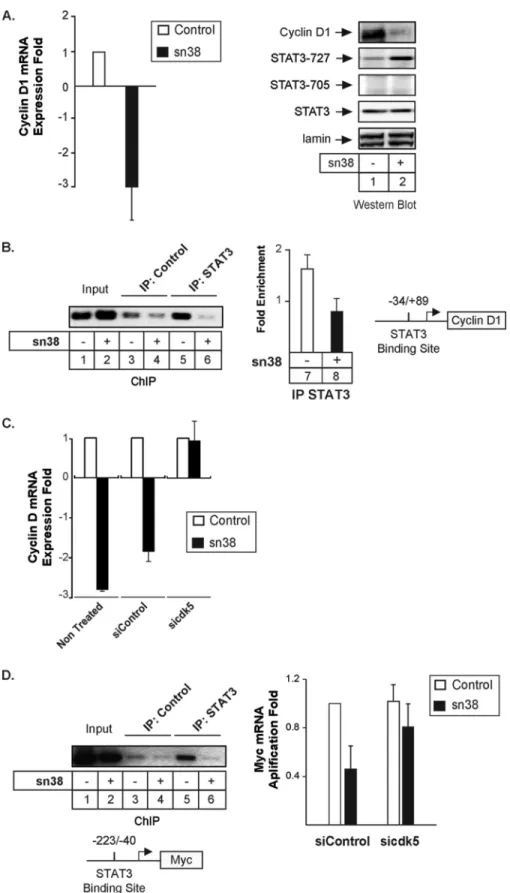
In this study, we have further characterized the regulation of STAT3 during DNA damage. In colorectal cell lines, we have found that the transcription factor is phosphorylated on its ser-ine 727 residue following topoisomerase I inhibition and that tyrosine 705 phosphorylation is not modified. In addition, we have also observed that this phosphorylation is due to the bind-ing of the cdk5 kinase to the transcription factor. cdk5 is a serine/threonine kinase, which was initially characterized in postmitotic neurons. Once associated with its specific activa-tors p35/p25, this protein plays an important role in neuronal survival, neurite outgrowth, and cytoskeletal functions (25–27). In response to topoisomerase I inhibition, we have observed that cdk5 is activated and that it interacts with STAT3 to induce its serine phosphorylation. Cdk5 appeared to be involved in the STAT3-mediated regulation of the cyclin D1, myc, and Eme1 genes. Importantly, ChIP analysis showed that the transcrip-tion factor can be found associated with the Eme1 promoter when phosphorylated only on serine 727. We therefore propose that cdk5 regulates the STAT3-Eme1 pathway and that this is an important step in the response of colorectal tumors to topo-isomerase I inhibition.
MATERIALS AND METHODS
Cell Lines—The human colorectal cell lines HT29 (HTB-38) and HCT116 (CCL-247) (ATCC, Manassas, VA) were cultured in RPMI 1640 medium (Lonza, Walkersville, MD). Cell lines were supplemented with 10% fetal bovine serum (PAA Labora-tories GmbH, Austria).
Materials—sn38 came from Pfizer (New York, NY). Poly-clonal anti-STAT3 (C20), anti-phospho-STAT3-Ser-727 (ser727-R), anti-cdk5 (C8), anti-cdk5 Y15, anti-Erk2 (C14), phos-pho-Erk1/2 (E4), p35 (C19), lamin A/C (346), anti--tubulin (H-235), and hsc70 (B-6) were obtained from Santa Cruz Biotechnology (Santa Cruz, CA). The anti-H2Ax Alexa fluor was obtained from BD Biosciences, and the anti-phospho-STAT3-Tyr 705 was from Cell Signaling. The cdk5 and STAT3 siRNAs have been obtained from Dharmacon Inc. (Lafayette, CO) and transfected using the Dharmafect 4 (Dharmacon) method. Three different siRNAs were used for each transfection.
Cell Treatment—Cells grown in 3% FBS medium were imme-diately treated with sn38 (5 ng/ml) for 48 h. Note that this treat-ment should be done before complete cell adhesion so that every cell can incorporate the drug before entering the next S phase. For siRNA experiment, cells were transfected with the appropriate siRNA using the Dharmafect 4 method and grown up for 48 h in 6-well plates. In 3% FBS medium, cells were then divided into two wells and again immediately treated with sn38 (5 ng/ml) for 48 h.
Immunoprecipitation and Western Blot Analysis—After two washings with cold PBS, cells were lysed in 100l (Western blot) or 1 ml (immunoprecipitation) using ice-cold lysis buffer (25 mMHEPES, pH 7.9, 300 mMKCl, 0.2 mMEDTA, 10%
glyc-Na3VO4). After a 30-min incubation at 4 °C, total extracts were clarified by centrifugation at 12,000 rpm for 10 min.
Immunoprecipitations were performed overnight at 4 °C with whole cell extracts (2– 4 mg) in the presence of 0.1 or 1% Nonidet P-40 (CA-630, Sigma). Cell extracts were precleared with 75l of protein G-agarose (Sigma-Aldrich, 50% slurry in phosphate-buffered saline) for 2 h at 4 °C, and cleared extracts were immunoprecipitated with 4g of the indicated antibodies overnight at 4 °C followed by the addition of 50l of protein G-agarose for 1 h at 4 °C. Immunoprecipitated proteins were washed two times in lysis buffer and one time with 10 mMTris, pH 8, 100 mMEDTA, prior to the addition of sample buffer. Following electrotransfer, membranes (Millipore Corp., Bil-lerica, MA) were blocked for 45 min at room temperature in Tris-buffered saline buffer, 5% bovine serum albumin, 0.05% Tween. Membranes were then incubated overnight with the indicated antibodies diluted in Tris-buffered saline buffer, 1% bovine serum albumin, 0.05% Tween at 4 °C. After three wash-ings, blots were incubated with the appropriate horseradish peroxidase-conjugated secondary antibody for 45 min. Proteins were detected using an enhanced chemiluminescence system (ECL, Bio-Rad).
Quantitative PCR—RNA was extracted using the TRIzol method (Invitrogen), and complementary DNA was synthe-sized from 2g of RNA by random hexamer priming using Moloney murine leukemia virus reverse transcriptase (Pro-mega, Madison, WI). For cDNA quantification, PCR was performed with 4l of 20⫻ diluted cDNA, 5 l of Qiamix (Qiagen), and 1l of 5 Mprimers. Accumulation of fluo-rescent products was monitored on the ABI PRISM 7300 real-time PCR system (Applied Biosystems, Foster City, CA). The relative quantification of gene expression was performed using the comparative CTmethod, with normalization of the target gene to the endogenous housekeeping gene RPLPO. RT-PCR primers were as follows: RPLPO (5
⬘-AACCCAGC-TCTGGAGAAACT-3⬘ and
5⬘-CCCCTGGAGATTTTAGT-GGT-3⬘), CD1 (5⬘-CAGTAACGTCACACGGACTAC-3⬘ and
5⬘-ACAGGAGCTGGTGTTCCAT-3⬘), cdk5
(5⬘-AGCGACA-AGAAGCTGACTTT-3⬘ and
5⬘-AGAATCCCAGCCCTTTT-AGT-3⬘), and Eme1 (5⬘-AACGCTTCAGGGCTTTGTAA-3⬘
and 5⬘-GCTCCCTGTTTCCCTCTTCT-3⬘).
ChIP—Attached cells were washed twice with cold PBS, cross-linked with 1% formaldehyde at room temperature for 10 min, and then washed twice with 10 ml of cold PBS. Cells were lysed with 500l of lysis buffer (1% SDS, 10 mMEDTA, 150 mM NaCl, 20 mM Tris-HCl, pH 8.1, 1 mM phenylmethylsulfonyl fluoride, 2g/ml leupeptin, 5 g/ml aprotinin, 1 g/ml pepsta-tin A, 0.5MNaF, 100 mMNa3VO4), and extracts were sonicated
six times for 15 s each. Supernatants were recovered by centri-fugation at 12,000 rpm for 10 min at 4 °C, diluted one time in dilution buffer (1% Triton X-100, 20 mMTris-HCl, pH 8.1, 2 mMEDTA, 150 mMNaCl, 1 mMphenylmethylsulfonyl fluoride, 2g/ml leupeptin, 5 g/ml aprotinin, 1 g/ml pepstatin A, 0.5 MNaF, 100 mMNa3VO4), and subjected to one round of immu-noclearing for 2 h at 4 °C using protein-G-agarose coated with salmon sperm DNA (Millipore). Immunoprecipitations were
26766
JOURNAL OF BIOLOGICAL CHEMISTRY VOLUME 285 • NUMBER 35 • AUGUST 27, 2010at INSERM, on September 3, 2010
www.jbc.org
was added for 1 h at 4 °C. Beads were then washed for 10 min in TSE1 (0.1% SDS, 1% Triton X-100, 2mMEDTA, 20 mM Tris-HCl, pH 8.1, and 150 mmol/NaCl), TSE2 (0.1% SDS, 1% Triton X-100, 2 mMEDTA, 20 mMTris-HCl, pH 8.1, and 500 mmol/ NaCl), and TSE3 (0.25MLiCl, 1% Nonidet P-40, 1% deoxy-cholate, 1 mMEDTA, and 10 mMTris-HCl, pH 8.1). Beads were washed once with TE buffer (10 mMTris, pH 8, 100 mMEDTA) and eluted with 500l of elution buffer (1% SDS and 0.1M NaHCO3) for 1 h. Eluates were heated at 65 °C overnight, and DNA was precipitated using classic procedures. For PCR, 5l from a 100-l DNA preparation was used for 25–30 amplifica-tion cycles. The following primers were used: region⫺34/⫹89,
5⬘-CCGGGCTTTGATCTTTGCT-3⬘ and
5⬘-GACTCTGCT-GCTCGCTGCTA-3⬘ of the cyclin D1 promoter; region ⫺2760/ ⫺2486, 5⬘-TTGTGCCACTGCTGACTTTGTC-3⬘ and
5⬘-AGC-CTGAAGAAGGAGGATGTGAGG-3⬘ of the p21 promoter.
Myc and Eme1 primers have been described before (24, 28). Flow Cytometry—For DNA content analysis, 1.5⫻ 106cells
were washed twice with PBS and fixed in 70% ethanol. Cells were treated with 100 units/ml RNase A for 20 min at 37 °C, then diluted in PBS/propidium iodide (50g/ml), and immedi-ately analyzed by flow cytometry (BD Biosciences). For phos-pho-H2Ax analysis, 1⫻ 106cells were recovered by
centrifuga-tion with their supernatant at 1500 rpm for 5 min at room temperature. Cells were fixed with 2% paraformaldehyde at room temperature for 10 min. Cells were then washed twice with PBS and centrifuged at 1500 rpm for 5 min at 4 °C. Cells were incubated with a PBS-2% bovine serum albumin-0.2% Tri-ton solution for 2 min. The primary antibody was diluted at 1/50, and 4⬘,6-diamidino-2-phenylindole (5g/ml) was diluted 500 times. Cells were incubated for 1 h a room temperature and then analyzed by flow cytometry.
Colony Formation Assay—For colony formation assays, 1000 cells were plated per well in 6-well plates, treated with sn38 the next day and allowed to form colonies. After 10 –14 days cells were washed twice with PBS and treated with crystal violet for 10 min at room temperature, and then washed five times with water. The percentage of colony-forming cells was calculated as compared with non-treated cells.
Pulldown Assay—Bacteria were grown up in 5 ml of LB medium overnight. 200 ml of ampicillin-LB was inoculated with 2 ml of the overnight culture and grown up until optical density reached 0.6 – 0.8. Isopropyl 1-thio--D -galactopyrano-side was then added at 1 mMfor 2 h, bacteria were recovered by centrifugation at 4000 rpm for 20 min at 4 °C, resuspended in 8 ml of lysis buffer (50 mMNa2HPO4, pH 8, 300 mMNaCl, 10 mMimidazole, 1 mMphenylmethylsulfonyl fluoride, 1 mg/ml lysozyme), incubated on ice for 30 min and sonicated 6 – 8 times for 20 s. Triton X-100 was added to the final concentration of 1% and incubated on ice for 15 min. Extracts were recovered by centrifugation at 4000 rpm for 15 min at 4 °C, and supernatants were transferred to a 15-ml conical tube. 250l of beads (nick-el-nitrilotriacetic acid-agarose, Qiagen) was added for every 200 ml of initial culture, and extracts were incubated for 1 h at 4 °C. Beads were then washed three times with washing buffer (50 mMNa2HPO4, pH 8, 300 mMNaCl, 20 mMimidazole, 1 mM
(300 g) and washed three times with lysis buffer (25 mM HEPES, pH 7.9, 300 mMKCl, 0.2 mMEDTA, 10% glycerol, 1 mM phenylmethylsulfonyl fluoride, 2 g/ml leupeptin, 5 g/ml aprotinin, 1g/ml pepstatin A, 0.5MNaF, 100 mMNa3VO4)
prior to the addition of sample buffer and Western blot analysis. Kinase Assay—His-⌬1–716 STAT3 proteins were produced as described above and eluted from the beads. In parallel, cdk5 was immunoprecipitated from sn38-treated cells (total ex-tracts, 100g), and 15 l of beads was incubated with 1 g of His-⌬1–716 STAT3 at room temperature for 10 min with 10 Mcold ATP. The reaction was stopped by the addition of 50l of sample buffer. Samples were analyzed by Western blot as described above using a polyclonal antibody directed against the serine-phosphorylated form of STAT3.
RESULTS
STAT3 Is Phosphorylated on Its Serine 727 Residue following Topoisomerase I Inhibition—To determine if the STAT3 tran-scription factor is involved in the response to DNA damage, growing HT29 colorectal cells were treated with sn38, the active metabolite of irinotecan. Using Western blot analysis, we observed that topoisomerase I inhibition induced the phos-phorylation of STAT3 on its serine 727 C-terminal residue (Fig. 1A, lanes 3 and 4). As a control, topoisomerase I inhi-bition did not affect the expression or phosphorylation of the Erk1/2 kinases (Fig. 1B, lanes 1 and 2). Because p53 is mutated in the HT29 cell line, this effect does not appear to rely on the tumor suppressor gene. Under these conditions, we were not able to detect a significant activation of the tyrosine 705 phos-phorylation site, whereas this site was normally phosphorylated upon IL-6 stimulation. When HT29 cells were serum-starved for 2 days and then stimulated with this cytokine for 30 min, a significant activation of the two phosphorylation sites was detected as expected (Fig. 1C, lanes 1 and 2). In addition, when the transcription factor was immunoprecipitated using anti-bodies directed against its tyrosine 705-phosphorylated form, we observed that STAT3 was phosphorylated on its two sites following IL-6 stimulation. However, we were not able to detect any tyrosine phosphorylation following topoisomerase I inhibi-tion (Fig. 1C, compare lanes 4 and 5). Using Western blot anal-ysis, we observed that this phosphorylation remained non-de-tectable during the 3 days of treatment, whereas the serine 727 phosphorylation was easily detected and declined at 96 h (Fig. 1D, lanes 1– 4 and data not shown). Note, however, that we were able to detect a weak constitutive phosphorylation of the tyrosine 705 site when 600g of total extract was used. By contrast, 50- 60g of proteins were used in this study to detect all protein expression and STAT3 serine 727 phosphorylation. Therefore, in our experimental model, the tyrosine-phosphor-ylated forms of STAT3 are not highly expressed as compared with the ones presenting a phosphorylation on the serine 727 residue.
The activation of STAT3 was surprising, because its phos-phorylation theoretically occurs in the G1phase of the cell cycle and in response to growth factor stimulation. Under the condi-tions used in this study, clonogenic assays indicated that sn38
AUGUST 27, 2010 • VOLUME 285 • NUMBER 35 JOURNAL OF BIOLOGICAL CHEMISTRY
26767
at INSERM, on September 3, 2010
www.jbc.org