XV. COGNITIVE INFORMATION PROCESSING :
Prof. S. J. Mason J. K. Clemens M. B. Lazarus Prof. M. Eden R. W. Donaldson F. F. Lee Prof. T. S. Huang J. K. Dupress R. M. Mason
Prof. O. J. Tretiak C. L. Fontaine Kathryn F. Rosenthal Prof. D. E. Troxel K. R. Ingham T. L. Saxton
Dr. P. A. Kolers E. E. Landsman F. W. Scoville
A. L. Citron A. Spiridan
A. COGNITIVE PROCESSES
1. VARIATIONS OF PERCEIVED DISTANCE WITH APPARENT MOTION
Apparent visual movement occurs when two visual targets are flashed briefly in sequence. If the space separating the two flashes and the time relations between them are set properly, one sees a single target appear briefly in the region of the first flash and then move smoothly and continuously across the intervening space to the region of the second one, where it disappears. Apparent visual movement under optimal conditions is indistinguishable from "real", or veridical, movement, and this similarity in appear-ance of the two perceptions has been taken as evidence that the two have an identical physiological basis. This argument of identity has recently been shown to be wrong, however, and several criteria distinguishing the two perceptions have been discovered.1
Our finding of a basic difference in the coding of the two perceptions with respect to their rates, formation times, and masking effects prompted us to examine other prop-erties attributed to the illusion, particularly the variations in distance that are often reported.
If one observes two lights flashing at a rate that produces apparent movement, the distance seemingly travelled by the illusory object varies; however, the published accounts are ambiguous about the nature of this variation. Some writers report that the apparent distance is less than the physical distance; others report that it is greater. Irrespective of whether the apparent distance is less or greater than the physical dis-tance, the fact that there is a difference, and one which has been related more or less systematically to the stimulus conditions producing the basic phenomenon, creates a condition requiring further investigation. The question under study has to do with the formation of the visual space in which we ambulate, and the conditions affecting its psychological representation.
We have studied the variations in apparent distance of the apparently moving object in three ways. In one experiment two fiducial marks, dim points of light (M1 and M2), were set some distance apart, just below two lines of light (A and B) whose flashing gives the appearance of motion (see Fig. XV-1). The distance separating the two fiducial
This work was supported through the Joint Services Electronics Program by the U. S. Army Research Office, Durham, under Contract DA36-039-AMC-03200(E); and in part by the National Science Foundation (Grant GP-2495), the National Institutes of Health (Grant MH-04737-05), and the National Aeronautics and Space Administration (Grant NsG-496).
marks was varied and made either greater or less than the physical distance separating the flashing lines. The subject's task was to say, after each flash of the lines, whether
the distance traveled by the object in apparent motion appeared greater or less than the dis-0.160-- I1.60 - 3.60
tance separating the fiducial marks. The flashes were varied in duration, but were typically 40 msec each; the interval between
A the offset of the first and the onset of the
sec-1.20 ond (the interstimulus interval (ISI)) was
I
varied 10-250 msec; and the interval betweenM1 M2 the offset of the second and the recurrence
Fig. XV-1. of the first, the intercycle interval, was Physical arrangement of flashing 3250 msec. The experiment was performed lights (A, B), marker lights (M1, with 3 subjects who made between 20 and 30 M2), and point of fixation (FP). observations each at each temporal separation
of the interstimulus interval.
When the flashing lights were 12. 5 cm apart at a viewing distance of 282 cm ("2. 40) separations of the marker lights greater than 14 cm and less than 12 cm were almost always perceived correctly; that is to say, the subjects reported that the distance trav-eled by the apparently moving object was either less or greater than the distance set by the fiducial marks, which is in conformity with physical reality. When the fiducial marks were 13 cm apart, the subjects tended to report the apparent distance as greater, the
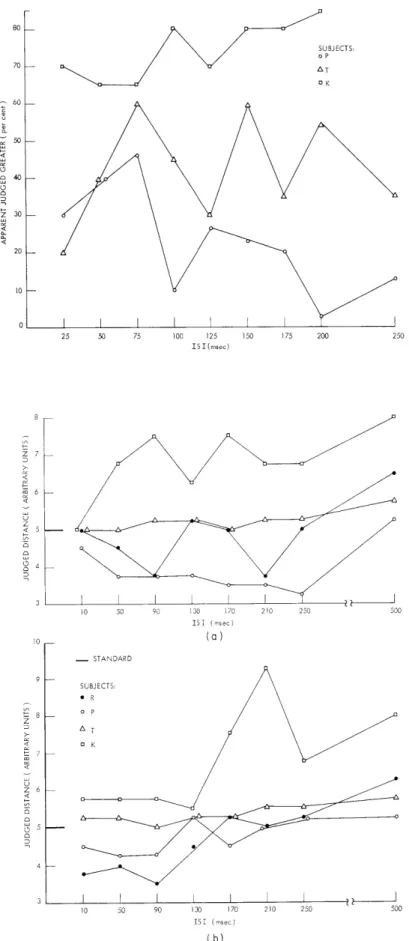
probability of these reports increasing slightly with increases in ISI. Thus there was an apparent overshoot of perceived distance, a physical separation of 12. 5 cm being per-ceived as greater than 13 cm, but not as great as 14 cm. This, at most, is an overshoot of 4-87%, far less than the 25-40% reported by others.2 Furthermore, we find the over-shoot is not a U-shaped function of that temporal interval (see Fig. XV-2.)
In an effort to reproduce the phenomena reported by others, another effort was made to measure the overshoot in apparent distance. In this case the two lights were flashed repeatedly with the dark intervals equal, so that the subject saw a line of light in a con-tinuous oscillation whose period was varied between trials. During each trial, which lasted 3-5 sec, the fiducial lights were moved physically until they appeared to match the distance traveled by the oscillating object. In this case again, there was no system-atic deviation from physical reality as a function of the temporal interval separating the two lights: the subjects' judgments describing a match between the marker lights and the apparently moving line were in good agreement with the physical conditions.
Despite these two negative results we persisted with a third experiment, for it will be recalled that the apparent distance does appear to vary with stimulus conditions. The results of this third experiment provide a clue to the basis of the phenomenon.
Fig. XV-2.
The percentage of judgments
showing apparent distance
per-ceived as greater than physical
distance,
as a function of the
interval between the flashes.
25 50 75 100 125 150 175 200 ISI(msec)
10
Z7 z <Z6 (D 4 3 9 8 7 4 3 Fig. XV-3.Judged distance travelled by illusory line. (a) Two lines flashed at 90 msec each;
(b) Two lines flashed at 310
msec each. The ordinate value 5 indicates the iden-tity of illusory and physical distance. Values less than 5 indicate that the apparent distance is perceived to be less than the physical dis-tance. 70 60 A u 50 w c c40 u o - 30 Al a 10 50 90 130 170 210 250 500 ISr (msec) (a) - STANDARD SUBJECTS: SR op OK I I I t I 0 10 50 90 130 170 210 250 500 ISI (msec) (b)
First, subjects estimated numerically the magnitude of the spatial separation of the two fiducial lights alone, using a subjective scale of distance. Four subjects tested individually generated essentially linear relations between judged distance and physical distance. The subjects were then shown the line in apparent motion, with the fiducial lights no longer present, and again used a subjective scale to estimate the distance traveled by the illusory object. The duration of each flash was 90 msec in one set of trials and 310 msec in another. The judgments were made with an intercycle interval (ICI) of 3250 msec, one judgment per presentation; and with an ICI of 2000 msec, a judg-ment made on the basis of three flashes. The results in both cases were similar but highly variable. Moreover, the subjects found it difficult to make a single estimation based on three flashes because, as they reported it, the apparent distance varied from flash to flash. Figure XV-3 shows the results for the last estimation; it can be seen that two subjects characteristically produce an undershoot for the shorter ISI values, two
characteristically produce an overshoot, and all subjects produce an overshoot at the longest ISI values. Notice also that the variations in apparent distance are not correlated with the ISI values that produce good apparent motion. If they were so correlated, the
curves would begin at 5 (the value for the two lamps that are on continuously), depart smoothly from that value to some peak, and then return to 5.
In these experiments, the subject always looked with one eye only through a 4-mm artificial pupil at a small dot of red light (the fixation point) placed just to the left of the first of the flashing lines. It is known, however, that a fixated eye is not entirely immo-bile; small involuntary motions characterize even the best fixated eye.3 These involun-tary motions, we now believe, are the basis of the variations in apparent distance of an object in illusory motion. The effects do not seem to be due to any particular excitation pattern established by the temporal relations between the flashes per se, nor to the occurrence of the illusion of motion, as others have claimed. They appear to be due to involuntary motions of the eye that occur between the offset of the first flash and the onset of the second. We have not, of course, proved this assertion; our apparatus does not lend itself to such exactitude. Significant proof would come from studies of apparent motion with the lines of light established as stabilized retinal images, either optically or by means of a suitably programmed computer that moved a stimulus display to com-pensate for movements of the eye. Our data, however, are consistent with this belief.
That it is involuntary eye movements that seem to play the predominant role is sug-gested also by the fact that voluntary movements of the eye undertaken during a stimulus sequence do not affect the apparent distance between the lights when the ISI is short. Thus, if ISI and ICI are both approximately 25 msec with the on-times of the lamps approximately 40 msec, sweeping the eyes across the display does not change the appar-ent distance between the lights. Involuntary eye movements on the other hand, can directly affect the spatial representation of an object, as demonstrated by Matin.4
(XV. COGNITIVE INFORMATION PROCESSING)
variations in perceived distance in apparent movement seem to be due to just such move-ments and not to any figural or temporal interaction. What is more intriguing now is the manner in which such eye movements contribute to the representation of visual space. The implication of these results is that the coding of space occurs in terms of some form of monitored retinal local sign.
P. A. Kolers, G. E. Touchstone
References
1. P. A. Kolers, "The Illusion of Movement," Sci. American, Vol. 211, No. 4, pp. 98-108, 1964.
2. W. Scholz, "Experimentelle Untersuchungen iiber die phinomenale Gr6sse von Raumstrecken, die durch Sukzessiv-Darbietung zweier Reize begrenzt werden,"
Psychol. Forsch. 5, 219-272 (1925); W. Neuhaus, "Experimentelle Untersuchung der Scheinbewegung," Arch gesam. Psychol. 75, 315-458 (1930).
3. T. N. Cornsweet, "Determination of the Stimuli for Involuntary Drifts and Saccadic Eye Movements," J. Opt. Soc. Am. 46, 987-993 (1956); R. M. Steinman, "Effect of Target Size, Luminance, and Color on Monocular Fixation," J. Opt. Soc. Am. 55, 1158-1165 (1965).
4. L. Matin and G. E. MacKinnon, "Autokinetic Movement; Selective Manipulation of Directional Components by Image Stabilization," Science 143, 147-148 (1964).
B. PICTURE PROCESSING
1. EFFICIENT FACSIMILE TRANSMISSION BY SUPERPOSITION OF PSEUDORANDOMLY SCANNED PICTURES
Introduction
Pseudorandom scanning has been used by Deutsch1 to reduce television frame rate and hence bandwidth. In pseudorandom scanning, the scanning beam does not travel sequentially as in ordinary television, but hops from point to point in a seemingly ran-dom fashion. In order to recover the picture, the scanner at the receiving end has to be completely synchronous with the transmitter scanner. If the receiver scanner is out of step, or if it is controlled by a different pseudorandom sequence than that of the trans-mitter scanner, the reconstructed picture will appear as random noise. In this report, we describe an efficient facsimile transmission system utilizing the property of pseudo-random scanning which has just been mentioned.
The System
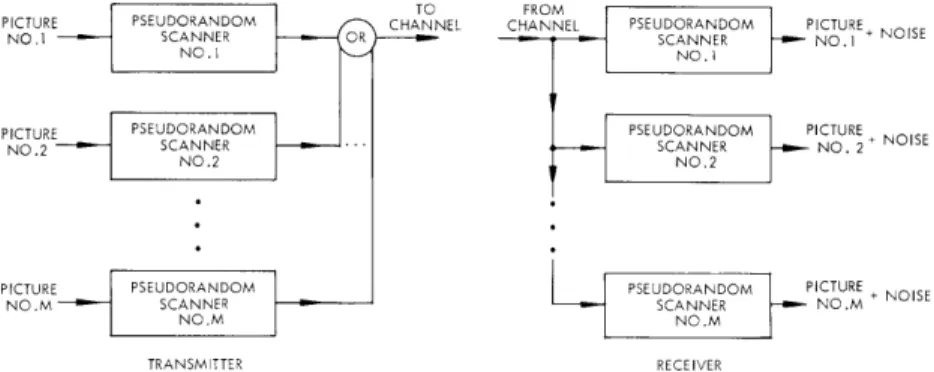
Our efficient facsimile transmission system is shown in Fig. XV-4. It is to be used for transmitting two-livel (black and white) digital pictures in which the white areas con-stitute only a small fraction of the total frame. The M pseudorandom scanners are
TO FROM
PICTURE PSEUDORANDOM CHANNEL CHANNEL PSEUDORANDOM PICTURE
NO.1 - SCANNER OR SCANNER NO.1 NOISE
NO.1 NO.1
PICTURE PSEUDORANDOM PSEUDORANDOM PICTURE
NO.2 SCANNER SCANNER NO. 2 NOISE
N0.2 NO.2
PICTURE PEUDORANDOM PSEUDORAND PSEUDO OM PICTURE NOISE
NO.M SCANNER SCANNER NO.M NOISE
NO.M NO.M
TRANSMITTER RECEIVER
Fig. XV-4. An efficient facsimile transmission system.
controlled by different pseudorandom sequences. At the transmitting end, the output binary sequences (black = 0, white = 1) of the scanners are "ored" and the resulting binary sequence is sent to the channel. At the receiving end, the received binary
sequence is fed to M scanners that are identical to those at the transmitter. The output of each receiver scanner will be the picture put into the corresponding transmitter scanner plus random noise caused by the other pictures and the channel. The noise will consist of white points scattered more or less randomly over the picture. Under the assumption that the channel is noiseless, the probability of error (black points received
as white) is
P
<
(M-1) p, (1)where M is the total number of pictures transmitted at the same time, and p is the fraction of white in each picture. For example, if a probability of error of 0. 3 can be tolerated and if the amount of white if 1/20 of the total picture, then 5 pictures can be transmitted at the same time.
Experimental Results
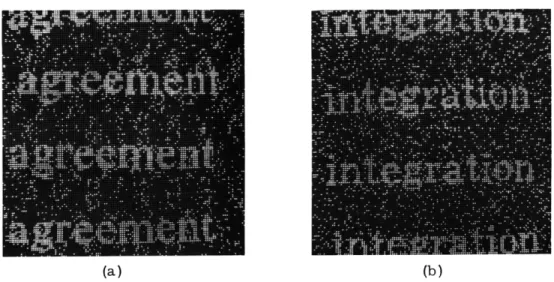
The system described here was simulated on the IBM 7094 computer. Some of the results are shown in Figs. XV-5 and XV-6. The original pictures used were white char-acters on black, the amount of white being approximately 1/10 of the total picture. Fig-ure XV-5 shows the received pictFig-ures for M = 2 and Fig. XV-6 for M = 4. Since the noise is randomly scattered over the picture, it can probably be reduced substantially by some noise-reduction scheme.
Discussion
The system described here is quite suitable for use as a party-line system. As the number of users increases, the noise in the received pictures will increase; however, in our system, as contrasted with ordinary party-line systems, any user can transmit
(a)
(b)
Fig. XV-5. Pictures from computer simulation of the system of Fig. XV-4 (M = 2).
(a) (b)
Fig. XV-6.
(c)
(d)
pictures at any time: the line never refuses service to the use, it only degrades gracefully.
The computer programming for this experiment was skillfully done by John Currano. T. S. Huang, O. J. Tretiak References
1. S. Deutsch, "Narrow-Band TV Uses Pseudorandom Scan," Electronics, Vol. 35,
pp. 49-51, April 27, 1962.
2. OPTIMUM BINARY CODE
Introduction
In Quarterly Progress Report No. 78 (pages 231-233) we considered the problem of transmitting digital data over a binary symmetric channel (BSC) using fixed-lingth binary codes. In particular, we were interested in finding the optimum code that minimizes the mean-square error or average noise power. We reported that if the input data are uniformly distributed over the integers 0 to 2n - 1, then the natural code minimizes the
2
single-bit average noise power, el, which was defined as the part of the average noise power resulting from single-bit errors in the received code words. If the error proba-bility p of the BSC is small, then the total average noise power is essentially the same as the single-bit average noise power, and therefore the natural code minimizes the total noise power. We believed that the natural code, in face, minimizes the total
aver-1
age noise for any value of p < 1; however, we have no proof thus far. We remark that the results of the last report depend only on the first-order statistics of the channel, and hence are valid for all binary channels, if p is interpreted as the average bit-error rate.
It was shown in the previous report that both natural and Gray codes are good as far as the average noise power is concerned. The purpose of the present report is to com-pare these two codes in more detail. First, we make a conjecture about the total aver-age noise power of the Gray code. Then, we discuss the effect of the input data on noise power. Finally, natural and Gray codes are compared in connection with picture trans-mission.
Average Noise Power of the Gray Code
We first write formally our previous conjecture.
Conjecture 1. If the input data are uniformly distributed over the integers 0 to 2n - 1, and if the average bit-error rate is p , then the natural code minimizes the (total) average noise power.
(XV. COGNITIVE INFORMATION PROCESSING)
Conjecture 2. Under the same assumptions as in Conjecture 1, the natural code yields a smaller (total) average noise power than the gray code.
An expression for the total average noise power of a natural code was given in the previous report. One approach to proving Conjecture 2 would be to find an expression for the total average noise power of the gray code; then we could compare the expres-sions for the average noise powers of the two codes. In carrying out this approach, we formulated the following conjecture.
Conjecture 3. Under the same assumptions as in Conjecture 1, we have
(Gn-Nn) = (1-2p) Gn-l', (1)
where Gi is the total average noise power of an i-bit gray code, and Ni is the total aver-age noise power of an i-bit natural code.
Equation 1 has been verified up to n = 6, but we have not been able to prove it in gen-eral. It is clear that Conjecture 2 follows readily from Eq. 1.
Noise as a Function of Signal Amplitude
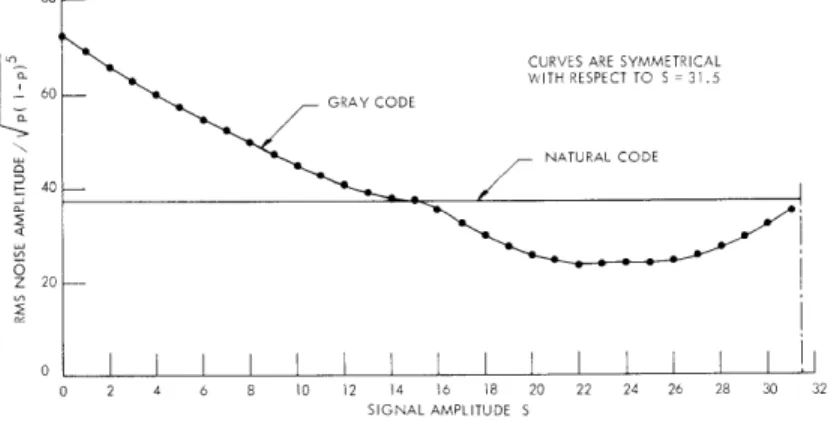
In order to calculate average noise powers for input data with various probability distributions, it is helpful to have curves of noise power (or rms amplitude) as a function of the signal amplitude. The average noise power is equal to the area under the curve which is the product of the input probability distribution curve and the curve of noise power versus signal amplitude.
80
-CURVES ARE SYMMETRICAL WITH RESPECT TO S = 31.5 GRAY CODE NATURAL CODE 0 Z 20 -0 2 4 6 8 10 12 14 16 18 20 22 24 26 28 30 32 SIGNAL AMPLITUDE S
Fig. XV-7. Curves of rms noise amplitude vs signal amplitude, for natural and gray codes.
For natural and gray codes, the curves of single-bit rms noise amplitude versus sig-nal amplitude are shown in Fig. XV-7 for n = 6. It is seen that if the input probability distribution has a peak near the center and is small at the extremes, then the gray code might yield less single-error average noise power than the natural code.
For a natural code, it is clear that the curves of noise power versus signal amplitude are flat for all n. For the Gray code, we observed empirically that the curves for dif-ferent values of n are very close to each other if they are properly normalized by powers of 2 in both the horizontal and the vertical directions. An interesting problem would be to find the asymptotic (n - co) form of the normalized curve and estimate the deviation of the normalized curves for finite values of n from this asymptotic curve.
Picture Transmission
In our discussion we took the mean-square error as our fidelity criterion. If the input data are samples of a digitalized picture, then the question in which we are interested is, Which received picture has better quality? This "best-quality" criterion depends, of course, on high-order statistics of the channel.
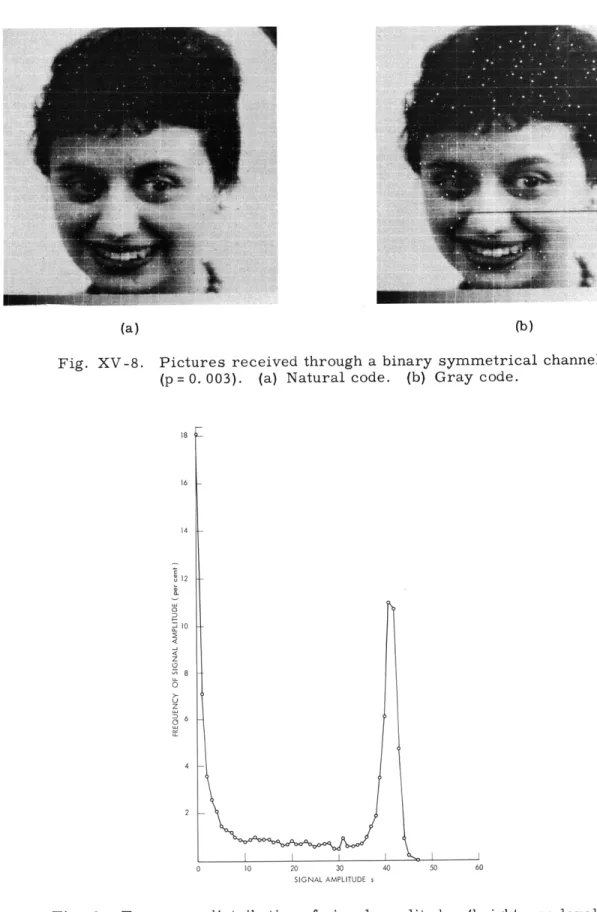
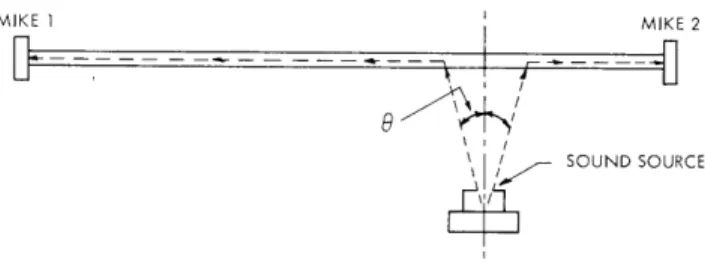
Picture transmission through the BSC has been simulated on the IBM 7094 computer, with both natural and Gray codes used. The received pictures are shown in Fig. XV-8. The picture consisted of 256 X 256 samples, and the bright was quantized to 64 levels (6 bits). The probability of error of the BSC was p = 0. 003. The distribution of the brightness levels in the input picture is shown in Fig. XV-9. The
peak-signal-to-rms-noise ratio is 29. 9 db for the natural-code received picture, and 27. 5 db for the Gray-code received picture. The noise in the Gray-code picture appears more visually objectionable than that in the natural-code picture. The poorer performance of the Gray code is evidently due to the fact that the input brightness distribution had peaks at the two extremes. It is quite possible that the subjective quality of a picture received through a BSC could be measured objectively by a weighted mean-square error, the weighting function being chosen to acount for the noise visibility over the Gray scale.
Y. Yamaguchi, T. S. Huang
C. SENSORY AIDS
1. MOBILITY AID SIMULATOR
This report describes the development of the mobility aid simulation facility which was described in Quarterly Progress Report No. 73 (pages 233-235).
More accurate position-monitoring equipment has been constructed. The original system used receivers located in the corners of a room. The signal processing involved taking the difference of squares of voltages. The path between the "dummy"
Fig. XV-8.
Pictures received through a binary symmetrical channel
(p = 0. 003).
(a) Natural code.
(b) Gray code.
10 20 30
SIGNAL AMPLITUDE s
40 50 60
Fig. 9. Frequency distribution of signal amplitudes (brightness levels)
of the picture used in Fig. XV -8.
mobility aid and a receiver could easily be interfered with by the subject who was holding the aid, and the difference of squares operation was implemented by an analog scheme that was subject to drift.
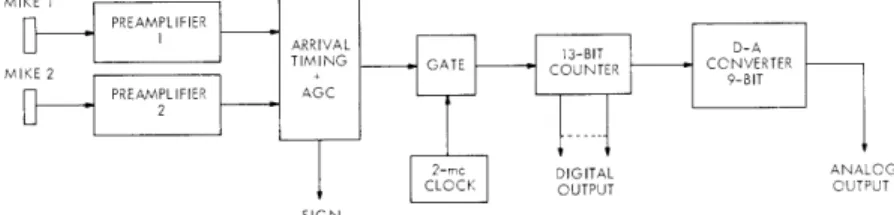
The new system uses a set of three mutually perpendicular polystyrene rods. Each rod provides one dimension of a Cartesian coordinate system. Two microphones are attached to each rod, one at each end. The microphones are Barium Titanate units and
MIKE 1 MIKE 2
/ SOUND SOURCE
Fig. XV-10. Sound-path geometry.
are fastened to the rods with beeswax. The "x" rod, 20 ft long, is composed of four 5-ft rods held together by epoxy. The first signals to be received at the ends of the rod after each transmitted pulse take the paths shown in Fig. XV-10. The angle a between the per-pendicular and the sound path in the air is just the critical angle for the passage of
sound from air to polystyrene and is given by
0
= sin- I(vA
where vA is the velocity of sound in air, and vR is the velocity of sound in the rod. Since VR is approximately 5 times that of air, 0 = 11*. Since the rod is mounted overhead and
0 is a small angle, it is much more difficult to interfere with the sound path. Polystyrene
was chosen as the rod material because it has the lowest transmission loss of any plastic tested and vR is not high enough to produce timing problems. It can be seen from Fig. XV-10 that the difference between the arrival times of the first pulse received at one end of the rod and the first pulse received at the other end is directly proportional to distance along the rod, is independent of the radial distance from the rod, and depends
only on the velocity of sound in the rod. The velocity of sound in air does not matter, as long as it is the same for both air paths, nor does the time of emission of the sound matter as it did in the old system. A zero crossing of the signal arriving at one end is used to turn on a counter, and the counter is turned off by the corresponding zero crossing of the signal arriving at the other end. A sign bit is derived by detecting which
(XV. COGNITIVE INFORMATION PROCESSING)
end received a pulse first (see Fig. XV-11). The linearity of the system is now being
MIKE 1
PREAM1PLIFIER ARRIVAL
D-A
PREAMPLIFIER AGC
2-m DIGITAL ANALCOG
CLOCK OUTPUT OUTPUT SIGN
Fig. XV-11. System diagram.
determined. The peak-to-jitter is less than 0. 1 inch over at least 15 ft of the "x" rod, and the radial distance from the rod can be as much as 10 ft without degrading perfor-mance.
E. Landsman
Z. OPTICAL CHARACTER RECOGNITION FOR READING MACHINE APPLICATIONS
Introduction
Optical character recognition (OCR) was applied to a very special problem, that of a reading machine for the blind. Since the proposed machine was, in fact, a personal one, interplay between the machine and the reader could be used to advantage. Figure XV-12 shows a possible reading machine system.
In normal operation the output of the data-reducing equipment will be connected by the switch to the recognition equipment. Whether or not the recognition equipment recog-nizes a letter depends on the distortion of the printed letter. If it is recognized it will be presented. If we assume, for example, that the output is spoken letters, the letter will be spoken to the operator. If it is not recognized an appropriate signal will be given to the operator. It is now up to the operator to decide whether he wants the distorted let-ter to be presented by a recoding device such as a two dimensional patlet-tern, or wants the machine to go on.
As an example let us assume that the "en in the word "the" is distorted beyond machine recognition. The machine could say t - h - beep. The operator would either
under-stand the word or not. If he did not he would throw the switch and the pattern of the dis-torted "e" would be presented as a tactile two-dimensional pattern (or some other recoded output), independently of how many correct letters had been read after this bad "e". The
operator could now feel the letter and tell the machine to go on.
The requirements of OCR in this application were found to be quite different than the requirements in electronic data processing. The most significant changes TACTILE
omT are the reduction of speed and error-rate
SCANNING DATA requirements and the increase
in
there-EQUIPMET REDCTION quirements
of
low cost and theability to
recognize type fonts of various styles. No NOT EOGNITIONexisting OCR
techniques were foundto be
OPERATOR RECOGNZ1EQUIPMENTsuitable for this purpose and a new
tech-nique was developed. OUTPUT
DEVICE
Contour Tracing Technique Fig. XV-12.
A personal reading machine system. The technique used here is based upon tracing the outside black-white boundary of the printed character. It was found that in the Roman alphabet the outside con-tour contained enough information to describe the characters. The outside con-tour of the character is traced by means of a digitally controlled flying-spot scanner. A column scan is generated which proceeds from left to right until a character is contacted. The scanner then traces the contour of this letter by means of simply generated local operations until the trace is complete. The basis of description of this trace is the local maxima and minima of the hori-zontal and vertical waveforms of the trace as it proceeds around the character and the positions at which these extrema occur. The details of the trace gen-eration are given in the author's thesis.1
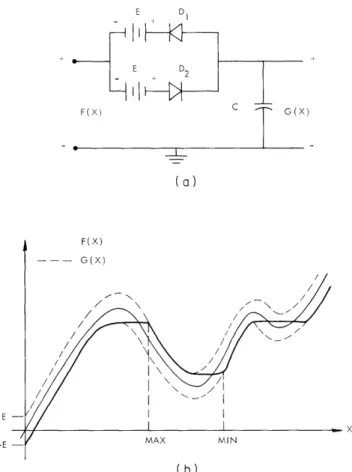
A method for smoothing had to be developed which would eliminate extrane-ous extreme caused by printing noise, and yet preserve the extrema arising from significant features of the character. The smoothing method used is a nonlinear technique employing hysteresis. This smoothing is analogous to "gear-backlash." Figure XV-13a shows the electrical model of a "gear-backlash" sys-tem. Figure XV-13b shows an input curve and an output curve that is the
smoothed curve. Notice that the smoothed curve still has sharp turns and inflec-tion points along it. If a maxima or minima is only detected when the slope
of the smoothed curve changes sign, then the extrema pairs that are separated by less than 2E units are eliminated, where 2E is the smoothing threshold.
We found that this smoothing threshold could be one-fourth the letter extent and still retain enough information to recognize the characters of the Roman alphabet. With this large noise threshold most of the variability of the characters caused by style variations
(XV. COGNITIVE INFORMATION PROCESSING) E D E D2 F(X) G(X) (a) F(X) -- G(X) MAX MIN (b)
Fig. XV-13.
Hysteresis smoothing.
and printing noise is eliminated in the scanner itself.
Generation of Binary Descriptions of Characters
There are three separate binary words used in the recognition of the letters, the height-to-width ratio of the letter, the sequence of the maxima and minima, and the
coordinates of the maxima and minima.
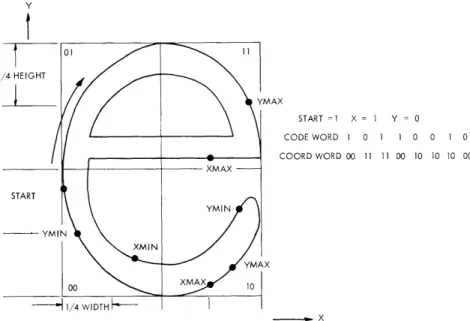
The generation of these binary words will be explained by an example. Figure XV-14 shows a letter to be scanned and recognized. The search is started by a column scan, bottom to top, which moves from left to right until the letter is contacted. This will occur at the point labelled "start" in Fig. XV-14. The captive scan is then initiated and the outside contour of the letter is traced. During this trace only two pieces of infor-mation are recorded, the letter extent in the vertical, or y direction and the letter
extent in the horizontal, or x, direction. From this information, the height-to-width ratio is calculated. This information is also used to set the actual values of the smoothing thresholds. The waveforms occurring in the horizontal and vertical directions during
Y
01
14 HEIGHT YMAX START = 1 X = Y = 0 CODE WORD 1 0 1 1 0 0 1 0 COORD WORD 00 11 11 00 10 10 10 00 XMAX START YMIN YMIN XMIN YMAX 00 10 -- 1/4 WIDTH - I - XFig. XV-14. Binary description of unknown character.
the contour trace are considered independently. In this example the threshold for the vertical (y) waveform is set to one-fourth the vertical extent and the threshold for the horizontal (x) direction is set to one-fourth the horizontal extent. These thresholds are in general different as can be seen in Fig. XV-14.
The trace routine is then initiated for the second time. During this trace the maxima and minima in the x and y directions are detected. Notice that it is not necessary to draw the smoothed curve described above to determine the position at which an extremum is detected. The extremum will always be detected when the trace moves one threshold unit from the extremum in the coordinate direction in which the extremum occurred. A description of the detection of the extrema for the letter in Fig. XV-14 will now be given.
When the second trace is initiated both x and y increase until the top of the letter in Fig. XV-14 is reached. At this point, y starts to decrease and x continues to increase. When y decreases the amount of the threshold, a y maximum is detected anid is so labelled on the letter. As the trace continues y continues to decrease and x reaches a maximum and then decreases. When x decreases one-fourth the letter width a maxi-mum is detected and is so labelled. As the trace continues again x reaches a minimaxi-mum and increases. Notice that this minimum is detected at one-fourth the distance from the minimum, and not one-fourth the distance from the edge of the letter. The trace continues detecting a y minimum, a y maximum, an x maximum, and a y minimum before com-pleting the trace.
The sequence of maxima and minima can be coded into a binary word, which will be called the code word. Each extremum of the trace can be determined unambiguously
(XV. COGNITIVE INFORMATION PROCESSING)
with one bit of information if it is assumed that the starting position is at a y minimum, as well as at an x minimum. The first extremum encountered on the trace must then be either a y maximum or an x maximum. This is a binary choice and can be desig-nated with 1 bit of information. Each extremum can be designated by 1 bit, since it is always known what the past extremum was in each coordinate direction. That is, although it may appear that there is a four-way choice of the next extremum along a trace, there is in fact only a two-way choice, because of the history of extrema along the trace.
The code word is generated by recording a 1 for the start position, a 1 for an x extremum and a 0 for a y extremum. This is done in sequence with new extrema added on the right of the word. The code word for the letter in Fig. XV-14 would be 10110010. The start position is labelled as a 1 so that the number of extrema is recorded, otherwise leading zeros would make the code word appear short.
In order to give information about where the extrema were detected, another binary word, called the coord word (coordinate word) is generated. The letter is divided in half in both the vertical and horizontal direction with the information obtained in the first trace. The four areas are labelled as shown in Fig. XV-14. Whenever an extremum is
detected it is appropriately recorded in the code word. Also, the label of the area in which the extremum is detected is recorded in the coord word. The coord word is formed in the same manner as the code word. That is, the two bits describing the coor-dinates of each extremum are added sequentially to the right side of the coord word. The
coord word for the letter in Fig. XV-14 is 0011110010101000.
To summarize, the binary description of a character is very simply generated. It is based on a contour trace of the letter which is performed twice. The first trace deter -mines the height-to-width ratio and the thresholds used in the smoothing operation. During the second trace the smoothing and the code-word and coord-word generation are performed simultaneously. When the second trace is complete all pertinent information has been taken and the scan moves on to the next letter.
For purposes of efficient data handling, the maximum length of the 3 binary words is fixed. A maximum length of 12 bits for the code words was found experimentally to be sufficient. The maximum length of the coord word was fixed as 18 bits instead of 24. We found that if the letter was so complicated that it had more than 9 extrema the code word itself carried enough information to determine the letter uniquely. The height-to-width ratio is divided into 4 classes and therefore requires a two-bit word.
The total information about the unknown letter is thereby contained in 32 bits of infor-mation. Most of the multifont machines in use today use a factor of 10 more information to describe the character in binary form immediately after scanning. Since, by means of this technique, a large part of the variability of the unknown is eliminated by the scanning technique, a great deal of data reduction has taken place in the scanner itself.
SpACE
CloSleng the Gop
(See Cover)
He stood on top of his spaceshipes
white titanium hull, He touched it with
his bulky thermal gloves. He burned
around like Duck Rogers propelling
himself with his handsheld jet. He
floated lazily on his back, He loked and
laughed, He gazed down at the earth
id3 miles below, spotted the Houston,
Galveston Day area where he lives and
tried to take a picture of it,
Like a gas
station Dttendant. he ehecked the space,
craftes thrusters, wiped its wlndshield,
Ordered to get back into the capsule, he
protested like a scolded kid*, **Im doing
great*** he said, **Ites fun* Ism not eoming
in*** When, after 2d minutes of space
gynmasties, U.S. Astponaut Edward
Higgins White II, 34, finally did agree
to squeeze himself baek into his Gemini
q ship, he still had not had enough of
spaee walking, Said he to Command
Pilot James Alton McDivitt, **Its the
saddest day of my life**,
Whitess exhilarating spaee stroll pro*
vided the moments of highest drama
during Gemini 4. scheduled 62. orbit,
98.hour. i.7ddeddd mile flight, White
spent twice the time outside the space,
eraft that Soviet Cosmonaut Aleksei
Leonov did last March 18, and he had
much more maneuverabllity, all Leonov
did was somersault around at the end of
a tethep, getting dizzy, while White
moved around pretty much at will,
Seeond Genepotlzon
Still, Geminies
planners would have serubbed White~s
EVA (for Extra.Vehicular Actlvityl
expedltion in a second if they had
thought it might detract from the
flightes basic missions,
Fig. XV-15. Example of reading "Time Magazine."
Recognition of the Unknown Character
The classification of the unknown character is made in three steps.
The code word
of the unknown is compared with the list of previously found code words. When a match
is found, the coord word of the unknown is compared with all coord words that previously
(XV. COGNITIVE INFORMATION PROCESSING)
occurred with that code word. Finally, the height-to-width ratio is compared and the appropriate character is given as output. The search can be terminated at any step if the unknown is uniquely classified at that step. If no match is found, an appropriate sig-nal is given.
Experimental Data
In order to make a realistic test of the variable font capability of this character-recognition technique, a set of 10 popular scripts was compiled. These type fonts were all of the Roman style but are quite different in design. Transparen-cies of these type fonts were taken from actual printed material so printing noise was included.
These 10 fonts were used also to experiment with various threshold settings. For each setting of the thresholds the letters were scanned and the results compiled. On the basis of these data the letters were then classified in terms of their code words, coord words, and height-to-width ratio. The number of code words encountered was recorded, as well as the number of coord words needed to distinguish letters that had the same code word. This is a measure of the amount of storage required to recognize the letters. The number of confusions represents the number of letters which could not be dis-tinguished. If 10 B's fell into the classification used for D's, this was called 10 confusions.
In order to make the results meaningful, it was assumed that ascenders and descend-ers of the lettdescend-ers were detected. This would certainly be done in any reading machine using this technique. The method for obtaining these is straightforward (see Earnest2). It can be done even when there are only several letters in a line of type. Although almost all letters are distinguished by their contours alone, the i, j, and 1 of the mixed type fonts are more readily distinguished with ascender and descender detection. Rarely are other letter pairs distinguished too.
Details of the various runs are given in the author's thesis.1 Possibly the best run has a large smoothing threshold with a high recognition rate. This was obtained with the smoothing threshold for the vertical waveform set to 1/4 the letter height and the smoothing threshold for the horizontal waveform set to 1/4 the letter width. The vertical division of the character was set at 9/32 rather than 1/2. The reason for this was that in some cases, notably in the letter "P1", the bulge of the letter, although shorter than the letter height, was larger than 1/2 the letter and was not detected as being short. In this case 61 code words and 67 coord words were needed.
In the run of the 10 fonts there were no confusions between upper-case and lower-case letters. There were 30 confusions among the 260 upper-case letters and 1 confusion among the 260 lower-case letters.
If the letters are assumed to be equally likely, the error rate for the lower-case let-ters, which make up the majority of letters in common usage, is 0. 4 per cent. In this
run the following confusions were made: B for D, Q for O, R for A, Y for V, c for e, H for N and C for G. It is interesting to note that the machine confuses letters that are readily confused by the eye. Possibly the two most surprising confusions were H for N because noise made the crossbar appear slanted, and C for G. The crossbar on the G is always more than 1/4 the horizontal extent of the letter; however, the line leading to the crossbar is in general very thick and hides the fact from the contour trace. All of these letters can be distinguished by further operations based on the technique described here. They are discussed in the author's thesis.1
In order to test the validity of this character-recognition technique for reading-machine applications a full page of "Time Magazine" was read. To be as impartial as possible the first page of text was taken from the issue of June 11, 1965. Over 3300 characters were encountered. There were no touching letters and only one broken letter. The page was scanned once and the data from all the characters were compiled. From these data the appropriate division for the 4 clases of height-to-width ratio was set and the characters were classified according to these code words, coord words, and height-to-width ratio. Only 68 code words and 86 coord words were needed. The num-ber of points around the contour of a letter was counted. If it was more than 16 but less than 64 points, it was called a general punctuation mark and no further data were recorded. The page was then read from the data collected. This is equivalent to reading with a completely trained machine.
Unfortunately, the property of detecting ascenders and descenders was not incor-porated in this reading program. Therefore the reading error rate is higher than it need be. The error rate, including letters and punctuation from titles and text, is approxi-mately 3 per cent. If ascenders and descenders were detected, the reading error rate would drop to 1 per cent. This error rate is quite sufficient for reading-machine appli-cations, because of the redundancy of the English Language. English text can be recon-structed from passages for which the error rate approaches 10 per cent.
The major confusions in reading this printed page were the letters 1 for i and j, p for r, and e for c. Numbers were also confused with letters, the major confusion being d for 0. The titles were printed in sans-serif type so some additional confusions exist there, mainly a for 0. Other confusions are listed in the author's thesis.
Figure XV-15 shows the results from the passage in "Time Magazine," including the confusions. The page is relatively easy to read if the possible confusions are kept in mind.
Conclusions
It is the contour tracing with the incorporation of the large-threshold hysteresis smoothing which permitted on approach to the OCR for the reading-machine applications
(XV. COGNITIVE INFORMATION PROCESSING)
problem. The variability of the data after scanning causes expensive data reduction when other techniques are used. Almost all of the variability of the character is elimi-nated in the scanning process itself, while the information describing the character is maintained. This is evidenced by the fact that the unknown characters can be described by 32 bits of information immediately after scanning and by the small amount of storage needed for the classification of characters. The simple operations used to generate the trace, the hysteresis smoothing technique used to reduce variability, and the small stor-age requirements suggest the real possibility of an inexpensive reading machine. We estimate that a reading machine operating as described here, including all optical
scanning equipment, could now be built for a few thousand dollars, which makes a per-sonal reading machine feasible.
J. K. Clemens
References
1. J. K. Clemens, "Optical Character Recognition for Reading Machine Applications," Ph. D. Thesis, Department of Electrical Engineering, M. I. T. , August 1965.
2. L. D. Earnest, "Machine Recognition of Cursive Writing," Information Processing 1962, Proc. IFIP Congress, 1962, edited by C. M. Popplewell (North-Holland Pub-lishing Company, Amsterdam, 1962), pp. 462-466.
3. PERCEPTUAL MODEL
When humans are required to identify a stimulus selected from a given set, the probability of a correct identification usually depends on several stimulus parameters. There is a class of stimuli, however, for the probability of a correct identification depending on only three parameters: the stimulus probability distribution, the stimulus rate, and the error costs.1 The purpose of this report is to present a model that allows the channel matrixabetween stimulus and response to be expressed in terms of these three stimulus paramaters.
The model is valid under the following conditions. (In this report a stimulus is characterized by its coordinate values along a set of stimulus dimension, analogous to the way in which a vector is characterized by its coordinates along a set of spatial axes.)
1. Each stimulus can assume one of at most two values along any one stimulus dimension.
2. The distance between coordinates along each dimension is well above threshold. 3. Only one of a finite number of stimuli occurs at any time.
4. The probability of occurrence of each stimulus is known by the observer. 5. The cost associated with each type of error is known by the observer.
Postulates of the Model
The model is based on the following postulates.
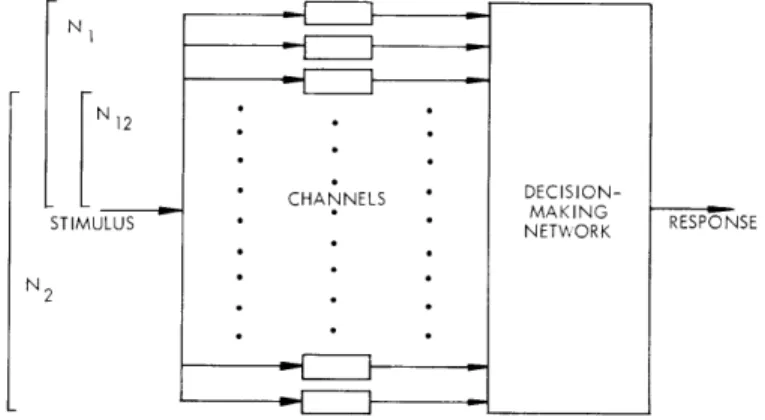
(i) The channel between the sensory stimuli and that portion of the nervous system where stimulus identification occurs can be modelled by a large number of identical parallel binary channels (not necessarily symmetric), followed by a decision-making network.
(ii) Each binary channel can transmit information about the coordinates of certain stimulus dimensions. Each channel can transmit information about only one stimulus dimension during any short space of time.
(iii) In general, the probability that a binary channel will correctly transmit the coordinate value of any one stimulus dimension depends on the coordinates along the
other dimensions.
(iv) Each individual channel is unreliable, and operates with a probability of error which is slightly less than 1/2.
(v) Decisions as to the identity of the original messages are made in such a way that the observers' risk is minimized.
The following discussion should help to illustrate these postulates.
Assume that a human is faced with the task of distinguishing 4 pure tones that vary along the dimensions of frequency and duration. The frequency is low or high; the dur-ation long or short. In accordance with the second assumption, N1 of the channels can be used for discrimination of frequency and N2 for discrimination of duration, while N1 2 of the channels can be used for the discrimination of frequency or duration
(see Fig. XV-16).
The fraction of the N12 channels used for the discrimination of frequency will depend on the message probabilities. If, for example, the two messages that are represented by tones of high frequency occur with probability zero, then all N12 channels will be used
N 2
S * CHANNELS
DECISION-- - MAKING
STIMULUS NETORK RESPONSE
N2
(XV. COGNITIVE INFORMATION PROCESSING)
for discrimination of duration, in accordance with the fifth assumption.
In general, the probability of correctly identifying a high-frequency tone will depend on its duration, in accordance with the third assumption. Similarly, the probability of correctly identifying a short-duration tone will depend on its frequency.
Some Special Cases
Consider the problem of discriminating between two stimuli that vary along only one dimension. Stimulus s is represented by the digit zero, stimulus s1 by the digit one. Each digit is transmitted through N identical channels as a zero or a one. These transmitted digits constitute an output sequence, on which a decision as to the identity of the original stimulus is based.
Define
v, any one of the 2N possible output sequences;
th
th
c. , cost of receiving the i stimulus when the j stimulus was sent;
th
P(si), probability of occurrence of the i stimulus; th
p(v si), probability of occurrence of the v output sequence, given that
stim-ulus s. was sent; 1
1th
wi, the set of all channel output giving rise to a decision that the i stimulus occurred; and
p, the probability of error per channel. (Without loss of generality, the chan-nels be considered symmetric.)
The expected cost, or risk c, can be minimized by choosing wo to contain all sequences v for which
p(vls
1)
LOIp(v s
o)
(C10-C00 P(So ) L =(C
0 1-C
1 1) p(s
1)
If vr denotes any output sequence containing r ones (and therefore N-r zeros), then the set w0 contains all sequences for which
Np
p -r
p I 1 p
<
L01Substitution of o = 1/2 - p in this inequality yields
SO
1 1 01
2 2
If this inequality is solved for r, and if second and higher order terms in
a-
are
neglected, the set wo is found to contain all output sequences v for which r < Nc.
N
N
log L
0 1 N + = N' c 2 8o- cL0
N' >N
c
0 <
N'<
Nc
N'
<0
c
From Eq. 1, the channel matrix for the over-all system can be evaluated. If P(wilsj) is the probability that the output sequence v falls in the set w. when the stimulus s.
1
J
occurs, then
N N! r(1p) N-r r=0 r! (N-r)c
P(w S1) N! (1p)r pN-rr=O0 r! (N-r)!
Approximation of these sums by integrals
all system.
(2) yields the channel matrix for the
over-erf (2
N~-
N
erf (-2rNo-log L
0 1+
01
+ o 4 N
log L)
0) 4erf
erf(2aN
(2-N
a
log L0/
g
0 1erf 2N
(2
- log LTNFN
01
T
e
-y 2 / 2 dy.Next, consider the problem of discriminating among 4 stimuli that vary along two
dimensions.
In this case, n
1channels are used for discrimination along dimension 1,
and n
2channels are used for discrimination along dimension 2. Thus,
1
n
1= N1
a12N12
2
n2 = N2
a12N12
1
2
a12 + a
= 1.
12
12
P(w
os
oP(Wo S
)
P(wolSl)
P(wl
1So
-P(wl Is
erf (x)-Ili 2
Tr-o(XV. COGNITIVE INFORMATION PROCESSING)
1
2
The constants al2 and al2 are chosen for minimum average risk.
If one assumes a unity cost matrix, minimizing the average risk is equivalent to maximizing the probability of a correct response, P(c).
3
P(c) = p(wi s i) P(si). i= 0
This sum is maximized by choosing w. to include all output sequences v for which 1
p(v sj) P(Si
_ _ < 1 (j=0, 1,
2,
3; j*i). p(v sj) p(sj)
Thus, the set w0 corresponding to stimulus so contains all sequences v for which
P(vlsj)
p(s)<
o
(j= 1, 2, 3).
p(vs o ) p(sj)
If one assumes that the probability of correctly identifying the coordinate value along one dimension is independent of the coordinates along the other dimension, then substitution of the appropriate liklihood ratios in this inequality gives the following equations. (r 1 is the number of one's transmitted by the n1 channels; rZ is the number of one's transmitted by the n2 channels. It is assumed that nl, and n2 lie between 0 and nl+n2 = N 1+N 2-N 1 2") g p(s
0
) logn1
p(s
1)
1 2 8crp(s
o ) log--n2
p(s
z)
r< + 28(-p(s )
log n1 + n2 p(s 3) S+ 2 280-The members of wl, w2, and w3 are determined in a similar way.
Once the numbers of wo, wi, and w3 have been determined, the over-all channel matrix can be evaluated. For example, if all four messages are equiprobable, then
n1/2 n2/2
nl! r I nl-rl n2! r n2-r
P(wo so) = p (1-p) 2-p) p
r =0 rl! (n1-rl)! = r2 (n-r
= erf (2I 1r) erf (2-Jn2o-).
If one lets
pl = erf (2J cr)
p2 = erf (2N2
a-),
then the channel matrix for the over-all system is
P(ws
o) P(W1 so) P(wZIs o ) P(w3 s0o) P2P1 P(1-pl ) (1-p2)P1 (I-pZ)(I-p 1) P(Wo0 Is) P(wl1SI) P(wZISI) P(w31s1)1 P(1-P1) PZP1 (1-PZ)(1-p I) (1-pZ)p 1P(Wo ls 2 ) P(wl SZ) P(w2 s2) P(w3 s2 ) (1-p z)p 1 (1-p2)(1-p ) PZP PZ(1-Pl)
P(w os3) P(wl s3) P(w s3 3) P(w3 s3) (1-P2)(1-p 1) (1-P2
)p
1 P2(1-Pl) P2P1 (4) Once the parameters &/ -, N2 a-, andN
N12 a- have been evaluated, the quantities1 2
p and 2 can be determined by choosing 12 and al2 to minimize the probability of error.
The parameters can be determined by evaluating the channel matrix that results when an observer is required to discriminate between judiciously chosen pairs of stimuli. By measuring the channel matrix that results when an observer discriminates between two equiprobable stimuli that vary along dimension 1, N a- can be deter-mined from
P(woI S) = erf (2Nf cra-).
By measuring the matrix resulting when an observer discriminates between two equiprobable stimuli that vary along dimension two, Nr a- can be evaluated from
P(wo s) = erf (2Nr-N2 o-).
Finally, determination of the matrix resulting when an observer discriminates between two equiprobable stimuli that vary along both dimensions allows N-N a- to be
12
(XV. COGNITIVE INFORMATION PROCESSING)
P(wo so) = erf [2( ' - +\ a- - T
e-l
")].General Case - Discrimination among 2m m-dimensional Stimuli
A set of stimuli which can assume one of two coordinate values along m stimulus dimensions can contain 2m different stimuli. In order to evaluate the confusion matrix for the over-all system, considerable algebraic manipulation is sometimes required. In principle, the computation is always possible It can be shown that when the N's and c's appear in various terms in the over-all matrix, they always occur as products of the form \]oa- . It can also be shown that all such products can be determined from the
chan-nel matrices that result when an observer is required to discriminate between judiciously chosen pairs of stimuli.3
a. Qualitative Comparisons of the Model with Experimental Data
The model is in qualitative agreement with several experimental facts. For example, when 2m messages are mapped into sensory stimuli that vary along m dimensions, the model predicts that the probability of error will increase with m, since the num-ber of channels available for discrimination decreases as m increases. When two messages are mapped into stimuli that vary along dimension 1, N1 channels are avail-able for discrimination. When the messages are mapped in stimuli that vary along dimension 2, N2 channels are available. When 4 messages are mapped into stimuli that vary along dimensions 1 and 2, N1 - a1 2N12 channels are available for discrim-ination along dimension 1, and N 2 - a 12 12 N12 channels for dimension 2. If N1 2 12 is non-zero, then the probability of a correct identification along each dimension decreases. Such an effect was observed by Pollace,4 and is consistent with earlier results.l
The model also predicts that a redundant use of stimulus dimensions will reduce the probability of a transmission error. When two messages are mapped into stimuli that vary along two dimensions, N1 + N2 - N12 channels become available for discrimination. Since N1 and N2 are always larger than N12, the number of channels increases, and P(e) decreases. Some earlier experiments,1 as well as experiments performed by Ericsen,5 support this prediction.
The fact that many of the channels can be used for discrimination along one of sev-eral dimensions suggests that people are able to focus attention on a few stimulus fea-tures, while paying little attention to others. We as humans seem to possess this flexibility.
b. Qualitative Comparisons of the Model with Experiments
When humans are required to discriminate between 2 m-dimensional stimuli, it can be shown that
+)2
+ log L
P(w so) = erf (5)
-8(-N)2 + log L01
P(wo sl) = erf 8 ), (6)
where N is the total number of channels available for discrimination.
m
m
M
m
m
+1
N= N- Z N.. +
E
N.. .. (-)m N...k )i=l i=1 j=1 1J i=1 j=1 k= l
jk
.ki#j ijfk ij... k
These equations support the hypothesis that when one of two stimuli can occur, sen-sory data can be described as varying continuously along a single axis, partitioned to minimize the observer's expected risk. In fact, (5) and (6) are almost identical to those used by Swets, Tanner, and Birdsall, Egan,7 and others to derive their receiver operating characteristics. The only difference is that the variances in (5) and (6) are equal. Although some workers do not impose this restriction, the experimen-tally determined variance ratio is often close to unity. Even when the data are best fitted with unequal variances, reasonable agreement between theory and experiment is obtained by assuming equal variances.
When an observer was required to discriminate between 4 equiprobable pure tones which varied in frequency and duration, the channel matrix shown in Fig. XV-17
resulted. It was found that the probability of correctly identifying the coordinate along one dimension was independent of the coordinate value along the other dimension. Thus, the theoretical matrix is given by (4). If dimension 1 is the frequency dimension, it was
found that qW
1
o=
.46;N--
2
= .19; and \I12
2 =- .08.1
2
3
4
1 .69 .11 .17 .03 58 .10 .27 .05 2 .11 .69 .03 .17 .17 .55 .04 .24 3 .17 .03 .69 .11 .20 .05 .64 .11 4 .03 .17 .11 .69 .07 .22 .09 .62 Theoretical ExperimentalTone 1: 1000 cps, 50-msec duration Tone 3: 1000 cps, 150-msec duration Tone 2: 3000 cps, 50-msec duration Tone 4: 3000 cps, 150-msec duration
Stimulus Rate: 1. 6 stimuli/sec Fig. XV-17. Auditory channel matrices.
(XV. COGNITIVE INFORMATION PROCESSES)
When an observer was required to decide whether or not each of two adjacent fingers was stimulated tactually by a poke probe, the probability of correctly identifying a poke on one finger was larger when the other finger was poked than when it was not poked (in accordance with Weber's law). An equal number of channels were available to each finger. If the subscript of a is used to designate a poke (1) or no poke (0) on the other finger, then, at a stimulus rate of 2. 6 stimuli/sec,
N1
o = 41; 1 1. 33; N~2 = . 15; and NI a-1 = .13. It was found that the number of channels
com-mon to pairs of fingers decreased as the distance between fingers increased, as did the ratio of ao/al. The same was true when the fingers were stimulated kinesthetically, rather than tactually.
When an observer was required to simultaneously identify pure tones differing in frequency, and decide whether or not a finger was poked, approximately one-quarter of the total number of channels was common to the auditory and tactile dimensions.
Variation of the Parameters with Stimulus Rate
When the distance between the stimulus coordinates is well above threshold, the N[N-'s are independent of all stimulus parameters except rate.l When subjects were required to discriminate between several pairs of stimuli, it was found that the ,JN--0's were linear functions of stimulus period.
N- = c(T-0. 25).
The constant c depends on the stimulus pair. The time T is in seconds. Thus, parameters measured at T1 can be scaled to T2 as follows:
(T2-. 25)
/N - (T2) =
TN
a- (T1)(T2-. 25)
Dimensional Goodness and Dimensional Independence
The model suggests a quantitative comparison of the goodness of a set of sensory dimensions, and a measure of the degree of dependence of two or more dimensions. The numbers N1 2 , N2 2, N3 a- 2 , etc. , all evaluated for the same coordinate values and stimulus rate, can be used as a numerical measure of dimensional goodness. Evaluation of the ratio N1/N 2 allows one to say whether dimension 1 is twice as good, three times as good, or half as good as dimension 2.
N
The ratio + N - N12 provides a measure of the degree of interdependence of
1 2 12
two dimensions. A unity ratio indicates strong dependence, as all channels can be used for discrimination along other dimensions. A zero ratio indicates dimensional