Publisher’s version / Version de l'éditeur:
Canadian Geotechnical Journal, 11, 3, pp. 348-358, 1974-08
READ THESE TERMS AND CONDITIONS CAREFULLY BEFORE USING THIS WEBSITE.
https://nrc-publications.canada.ca/eng/copyright
Vous avez des questions? Nous pouvons vous aider. Pour communiquer directement avec un auteur, consultez la
première page de la revue dans laquelle son article a été publié afin de trouver ses coordonnées. Si vous n’arrivez pas à les repérer, communiquez avec nous à PublicationsArchive-ArchivesPublications@nrc-cnrc.gc.ca.
Questions? Contact the NRC Publications Archive team at
PublicationsArchive-ArchivesPublications@nrc-cnrc.gc.ca. If you wish to email the authors directly, please see the first page of the publication for their contact information.
NRC Publications Archive
Archives des publications du CNRC
This publication could be one of several versions: author’s original, accepted manuscript or the publisher’s version. / La version de cette publication peut être l’une des suivantes : la version prépublication de l’auteur, la version acceptée du manuscrit ou la version de l’éditeur.
Access and use of this website and the material on it are subject to the Terms and Conditions set forth at
Field tests of deep power-installed screw anchors in permafrost
Johnston, G. H.; Ladanyi, B.
https://publications-cnrc.canada.ca/fra/droits
L’accès à ce site Web et l’utilisation de son contenu sont assujettis aux conditions présentées dans le site LISEZ CES CONDITIONS ATTENTIVEMENT AVANT D’UTILISER CE SITE WEB.
NRC Publications Record / Notice d'Archives des publications de CNRC:
https://nrc-publications.canada.ca/eng/view/object/?id=2d08ead2-7fca-4b54-aa60-d14e7c723559 https://publications-cnrc.canada.ca/fra/voir/objet/?id=2d08ead2-7fca-4b54-aa60-d14e7c723559
Field Tests of Deep Power-installed Screw Anchors in Permafrost1
G . H . JOHNSTON
Norther11 Research, Geotechnical Section, Division of Blrilditlg Research, National Research Colrncil of Catlada, Ottawa, Canada KIA OR6
AND B. LADANYI
Depnrttnetlt of Mining Engineering, Ecole Polytechtliqlre, 2500 Marie Glryard, Montreal, Quebec Received October 2, 1973
Accepted February 25, 1974
A test program was conducted in northern Manitoba to evaluate the creep behavior and load capacity of 8-, lo-, and 15-in. (20.3.. 25.4-, and 38.1-cm) diameter power- installed screw anchors embedded in permafrost (frozen, stratified silts and clays containing ice at about 3 1.5 "F (-0.3 " C ) ) . The test results show that the anchors behaved under uplift loads, in a manner that was essentially very similar to that exhibited by deep footings of the same size. N o failure planes (slip surfaces) were observed around the plates but a deformed zone above the plates was clearly visible in the varved soil when the anchors were excavated after testing. A method of analysis which allows the test data to be used directly for design, based on secondary creep rates and allowable displacen~ents, is described.
Un programlne d'essais, destini B itudier le fluage sous charge et la capaciti portante d'ancrages hklicoYdaux de 8, 10 et 15 po. (20.3, 25.4 et 38.1 c m ) de diamktre vissis dans le pergklisol, fut effectui dans le Nord du Manitoba. Le pergklisol du site choisi pour ces essais, consistait en couches intermittentes d'argile et de silt et avait une tempirature d'environ 31.5 "F (-0.3 " C ) . Les rksultats d'essais nlontrent que, sous I'action des charges d'arrachage, le comportement de ces plaques d'ancrage ressemble fortenlent 5
celui des fondations circulaires profondes. En effet, lorsque les ancrages furent excavis aprks les essais, on a constatk une absence complkte de toute surface de rupture au voisinage des plaques, mais la plus grande partie de deformation semblait plutBt &tre concentrke dans une zone sphirique nu-dessus des plaques, clairement visible dans le sol stratifii. En ~itilisant les donnkes sur le taux de fluage secondaire tirCes d e ces essais, et en adoptant le critkre d'un dkplacement admissible, on a riussi a mettre les risultats d'essais sous Line forme analytique, convenable pour la conception d e tels ancrages et permettant une comparaison d e leur comportenient avec d'autres types d'ancrages etablis dans le pergilisol.
Introduction
The design and installation of anchors in permafrost for various types of structures, in- cluding guyed towers and buried pipelines pre- sent dificult engineering problems. The be- havior of frozen soil in resisting uplift forces and the displacements associated with the long- term creep of frozen soil under load are of particular interest. Although experimental in- formation on the behavior of anchors under uplift forces in unfrozen soils has been reported in a number of papers (Adams and Hayes
'Presented at the 26th Canadian Geotechnical Con- ference, Toronto, Ontario. October 18-1 9, 1973.
1967; Bhatnagar 1969; Hanna and Carr 1971; Adams and Klym 1972) comparable informa- tion for frozcn soils is still very scarce. The Division of Building Research of the National Research Council of Canada undertook, there- fore, a field study of anchors in permafrost to evaluate their creep behavior and load ca- pacities.
Two types of anchors were installed early in 1967 at two permafrost test sites located at Thompson and Gillam, Manitoba (Fig. 1 ) . The results of investigations conducted on grouted rod anchors have been reported (Johnston and Ladanyi 1972). This paper describes the instal- lation and testing procedures and presents the results of the test programs conducted on
JOHNSTON A N D LADANYI: SCREW ANCHORS IN PERMAFROST 349 ICE LENS THICKNESS
H.W.T. INCHES MOISTURE CONTENT. %
S A S K A T C H E W A N
FIG. 1. Location of test sites, Thompson and Gillam, Manitoba.
p o w e r - i n s t a l l e d s c r e w anchors a t t h e T h o m p s o n site.
Test Site Conditions
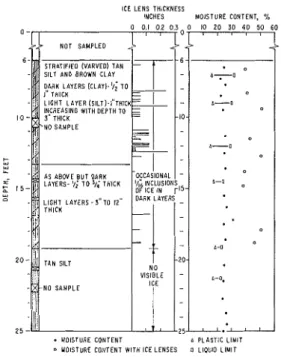
Thompson lies within the discontinuous permafrost zone. Stratified sediments (varved clays) of low to medium plasticity occur at the test site to a depth of about 19 ft ( 6 m ) . The thickness of the silt layers varicd from 1 to 12 in. (2.5 to 30.5 cm) and of the clay layers from 0.5 to 1 in. (1.3 to 2.5 c m ) . The varved clay was ~ ~ n d e r l a i n by a dense silt. Ice lenses were mainly horizontal and varied in thickness from hairline to about 0.5 in. (1.3 c m ) in the top 13 ft ( 4 m ) . Very little ice was noted between 13 and 19 ft ( 4 and 6 m ) and none was visible in the silt between 19 and 30 ft ( 6 and 9 m ) . Soil and ice conditions are shown in Fig. 2.
Ground teniperatures at the test site, from about 5 to 30 ft (1.5 to 9 m ) , were between 31.5 and 31.8 " F (-0.3 and -0.1 "C); i.e. they were essentially
isothermal throughout the year. The original depth of thaw (active layer) of 3-4 ft (1-1.2 m ) increased to about 8 ft (2.4 m ) over a 3-year period due to clear- ing of vegetation and moss cover and as a resitlt of testing activity.
Further information on soil and permafrost con- ditions at the Thompson site is given in a paper by Johnston and Ladanyi 1972.
Installation of Screw Anchors
A total of 12 screw anchors were successfully in- stalled at the Thompson site. Four specially fabricated anchors with round hubs, two of which had single and two had double helix screws (TS series, Fig. 3 ) were installed in February 1967 to depths of from 10 to 15 ft (3.1 to 4.6 m ) . Eight, commercial-type
FIG. 2. Soil conditions. Hole T H - I , anchor test site Thompson, Manitoba.
FIG. 3. Power-installed screw anchors (TS series), after testing.
single helix screw anchors with square hubs were installed in March 1967 to depths of from 8.5 to 13 ft (2.6 to 4.0 m ) . Details of the screw anchors reported here are given in Fig. 4. Single lengths of 1.5 0-ln. ' (4.1-cm) diameter round steel rods were used for the TS anchors. The rods for the other anchors were I-in. (2.5-cm) diameter round steel bars coupled together in 7-ft (2.1-m) lengths. All rods were attached to the anchor hubs by threaded con- nections. Helix diameters varied from 8 to 15 in. (20 to 38 c m ) .
CAN. G E O T E C H . 1 - 8 H P 2 - 8 H P 1 - I O N 2 - I O N I - 1 O H P T S - I 1 8 " D I A . \. PP:..;:. 10" D I A /
1
1 5 " D I A . FIG. 4. Power-installed screw anchors, Thompson, Manitoba.within an area 50 X 50 ft (15.1 X 15.1 m ) in size at the test site. All anchors were installed vertically using a special 'wrench' attached to the drive motor o r kelly bar of a truck-mounted, hydraulically-operated. radial-arm, power digger. This machine could exert a maximum torque of 5000-8000 ft-lb (690-1100 kg-m). The wrench (a long hollow tube) was slipped over the anchor rod so that it engaged either the back edge of the helix plate of the T S anchors (Fig. 5 ) , or the square hub of the other anchors. In all cases. an attempt was made to 'screw' the helix into the g r o ~ ~ n d , by applying a suitable downward pres- sure and rotational speed, to keep disturbance of the ground above the plate to a minimum. The 2-3 ft (60-90 c m ) thick, hard frozen seasonal frost layer was extremely difficult to penetrate and was usually churned up before the helix would 'bite' and screw into the frozen ground. The anchors were advanced with difficulty even in the underlying warmer tem- perature frozen materials. Similar problems were experienced in penetrating the dense silty material which occurred at the greater depths. On some occasions insufficient torque could be generated by the power digger and the machine stalled or the anchor could not be installed to the desired depth.
Several anchors were broken and lost during installa- tion; failure occurred because the helix buckled or the weld connecting the helix to the hub fractured. The time taken to successfully install an anchor to about 10 ft (3.3 m ) varied from about 30 min t o 1 h.
When the wrench was removed after installing an anchor, a void remained between the anchor rod and the wall of the hole made by the wrench. In most cases, an attempt was made to fill this void by pouring loose fill insulation down the hole.
Test Equipment, Procedures, and Results
Most of the anchors were tested during May and June 1970; two were tested in Novcmber 1969. Loads were applied to the anchors using 30- or 100-ton (27- or 90-t) center-hole hy- draulic jacks with 6 or 3 in. (15 or 7.5 cm) travel, respectively. The jacks wcre slippcd over the anchor rod onto a specially designed stcel tripod test frame. Thc uplift load was applied to a heavy nut or stecl clamp on the
to^ of thc anchor rod and the downward thrust taken by timbers on the ground surface which supported the legs of the test franie. Cantilever beams (1 0: 1 lever arm) loaded with concrete blocks werc used occasionally to apply constant loads. The test arrangement for both mcthods is shown in Fig. 6.
To maintain constant loads for several hours or days, the hydraulic systcrn was pressurizcd by an air-actuated pump cquippcd with an accumulator to dainpcn pressure fluctuations in the systcrn. A hand pump was also used to apply prcssure to thc jacks when small loads wcre to be applied for short pcriods of time.
Stainlcss stecl rules wcre sccurclv attachcd to the anchor rods and movements of the anchors under tcst were measured using an
JOHNSTON AND LADANYI: SCREW ANCHORS IN PERMAFROST 351
cnginecr's level. All movements were refcrenced to a bench mark (another stable anchor rod) to which a steel rule had also been attachcd. All anchors werc stage-loaded, that is, loads werc applied in increments of 2 o r 5 kips (0.9 o r 2.3 t ) , each load increment being maintaincd until a constant rate of strain was obtaincd.
The time period during which a load incrc- ment was applied varied from onc anchor to another but ranged from about 1 to 1 8 h. T h e total timc taken to complcte tcsting of an anchor also varied, therefore, and ranged from about 5 h to 8 0 h. Most tests were completed in less than 4 0 h. T w o screw anchors (not re-
ported here) werc testcd by applying an initial load of 15 or 20 kips (6.7 o r 9 t ) for 2 months and then stage-loaded to failure over a 24- to 36-h period.
During some tcsts, the jack travel was used up because of scttlement of the test frame and b c a ~ ing timbers and bccause anchor movements i n c r c a ~ e d at thc high loads. When this occurred the load was rcleased, the jack cylindcr re-
turned to its initial position, and the load reapplied as quickly as possible. 'Recycling' the jack usually took from about 5 to 15 min.
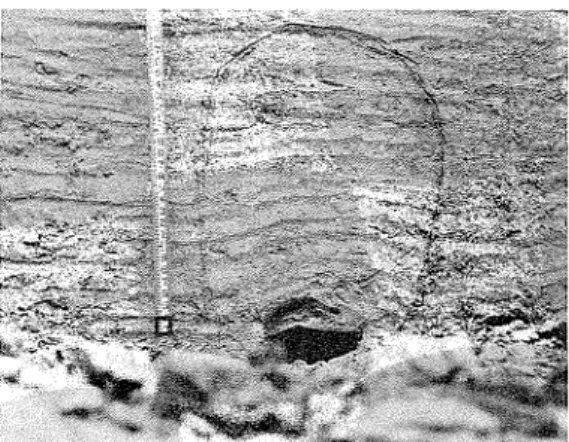
Immediately after thc test program had been complcted, trenches were dug adjacent to all anchors so they could bc examined in situ and salvaged. A numbcr of the anchors wcre dam- aged o r broken when struck by the back-hoe during excavation of thc trench or whcn they wcre bcing extracted from the ground (Fig. 3 ) . No failurc planes (slip surfaces) were observed around the platcs but a deformed zone above the plates could be clearly distinguished in the frozcn varved clay (Fig. 7 ) . In somc cases, a cone of compacted material adhered to the plate when it was removed (Fig. 8 ) . The voids ob-erved beneath the plates conespondcd closely with the displacement measured during the tests. N o upward movement or cracking of the ground surface was observcd during the tests. Some disturbance of the column of frozcn soil betwcen the ground surface and the plate had occurrcd during installation of the anchors in a few cases but was not evident in others. The deformed zone immediately above the plate extended beyond the disturbed cylinder of soil.
The rcsults of stage-load testing of six single helix screw anchors which are representative
FIG. 7. Deformation of frozen varved soil above plate anchor, Thompson.
FIG. 8. Cone of compacted frozen soil above plate anchor, Thompson.
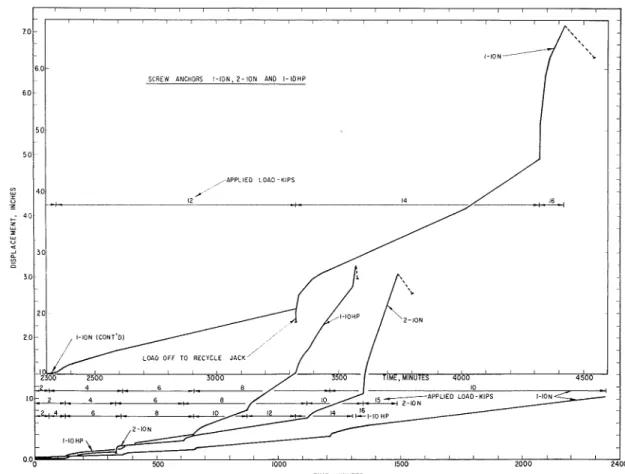
(three diameters and sevcral depths) of those installed arc prescnted as displacement-time curves in Figs. 9 , 10, and 11. Pertinent dctails of the anchors and tcsts are given in Table 1. The results of tests on the two double helix anchors arc not included at this timc because the effect of interaction between the plates is not clear and this complicates the analysis.
Discussion of Results
Ground surface observations made during the tests, and visual examinations of the anchors cxposed in the trenches excavatcd after testing was completed, showed that the dis- turbed (during installation) column of soil above the anchors did not visibly affect their behavior. I n fact, while thc disturbed column could bc detected after excavation, thcre was n o indication that it was vertically displaced during the tests and the soil deformation was
C A N . G E O T E C H . J . VOL. 1 I , 1974
/ I I I ~ 1 ! 1 ~ 1 ~ l
S C H C I ! A \ C H O R S 1 8 HP A N D 2 - 8 HP
0 5 0 0 I D 0 0 I 5 0 0
TI51C. ? , l I H U T t S
FIG. 9. Stage-load tests of screw anchors, Thompson.
TIME. MINUTES
JOHNSTON AND LADANYI: SCREW ANCHORS IN PERMAFROST
3.0
3 5 , 40 d 5 l A P P L l t O L O A O , K I P S
I
1
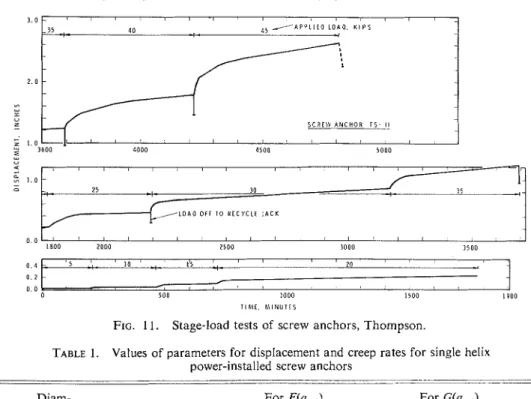
FIG. 11. Stage-load tests of screw anchors, Thompson.
TABLE 1. Values of parameters for displacement and creep rates for single helix power-installed screw anchors
-. - - . .-. -
Diam- For F(~lnct) For G(qnCt)
eter Depth
Anchor* B D Y D sci (7mi i c qas t5o.z
NO. (in.) (ft) D/B ( p i (in.) C p i . (in./min) P (days)
1-8HP 8 13.0 19.5 11.3 136.9 320 1 0 206.0 323 3 2 2-8HP 8 12.8 19.2 11.1 lo-' 43.1 306 1 0 80.5 277 7 . 5 1-10N 10 10.0 12.0 8.7 1 5 3 216 0 36.7 213 12.0 2-10N 10 9.3 11.2 8.1 lo-' 100.8 505 57.7 200 6 . 8 1-IOHP 10 9 . 0 10.8 7.8 28 1 271 lo-5 92.0 210 4 . 7 TS- 1 1 15 1 4 9 11.9 12.9 37.3 328 - - --. -- .- - A- 16.9 - 313 40.8
*'N' and 'HP' refer to the manufacturers ~ d e n t ~ f i c a l ~ o n code, 'TS' I S D.B R anchor ~dentlfical~on
found to be distributed above the plate as if the colunln did not cxist.
It should be notcd, however, that the anchors wcre tested morc than 3 years after they were installed and the mechanically disturbed soil had 'healed' naturally during that pcriod so that the frozen material was again well bonded and had rcgained its strength to a considerablc degree. One might speculate that refreezing of moisture resulting from thawing of thc ground, caused by cnergy generatcd during drilling of the hclix into frozen ground or by surface water pcrcolating down from the surfacc along the anchor rod, would assist in rebonding the dis- turbed material. O n the other hand, had these same anchors becn tested shortly after thcy werc installed, that is, before 'healing' could take place, then it is quite probable that thc
disturbed column of soil abovc the plate would influence the behavior of the anchor.
Behavior of Screw Anchors Under Load and Comparison with Grouted Rod Anchors
Thc single hclix, power-installcd screw an- chors behaved under pull-out loads, in a man- ner that was essentially vcry similar to that exhibitcd by decp footings of the samc size, that is, they showed vcry nonlinear load-dis- placement and load-displacement ratc relation- ships and attaincd their ultimate bearing ca- pacity in a hyperbolic manner.
It is known that, for deep circular footings and anchors installed in predrillcd holes, thc ultimate bcaring capacity is attained only aftcr a large displacement which is proportional to the footing diamcter. F o r example, Bhatnagar
354 C A N . GEOTECH. J . VOL. I I. 1974
1969 rcports values of prcfailure displacements of up to 5 0 % of the platc diameter in his pull-out tcsts on 3-in. (7.5-cm) diarncter plate anchors in silty clay and Hanna and Carr, 1971 find displacemcnts of more than 20% ilrc necessary beforc the ultimate pull resis- t a w c of 1 . S i n . (3.8-cm) diametcr plate anchors i7 sand is attaincd.
O n the other hand, it is a150 well known that cc>niparativcly much smaller displacen~ents are required to mobilize thc ultimate shcar strength at thc soil-pile interface, as, for cxample, on the latcral surfacc of grouted rod archors. Bhatnagar 1969 found, for cxample, that, in silty clay, plate anchors of the samc diameter and irlstalled at thc same depth as pile anchors required twicc the displacement to mobilizc the ulti~iiatc bearing capacity coniparcd to the pilc anchors. This means, therefore, that, evcn if the ultimatc capacities of thc two types of anchors, having thc same diameter and at thc same dcpth, are not very differcnt, their capaci- tics may differ much morc when comparcd on the basis of similar displaccments. For cxample, Bhatnagar 1969 found that when the displacc- ment attairlcd 10% of thc platc and pile diam- ctcr, 8 5 % of thc ultimate load was mobilized in the case of tlic pilc anchor and only 3 0 % for the platc anchor.
Similar behavior was obscrvcd in thc preccnt invc~tigations not only for thc displac~mcnts but also the d i s ~ l a c e m c n t rates. For all thc scrcw anchors t s t c d , the ultimatc short-term pull load was relatively high, but, becausc of the 1:lrge displaccmeiit ratcs which occurred ~l-dcr quite small pressures, thc long-tcrnl al- lowable load that would guarantee that an allowable displacement w o ~ ~ l d not bc exccedcd, wa; actually very small.
A comparison of the behavior of thcse scrcw anchors and the groutcd rod anchors tested previou-ly at the same site (Johnston and Ladanyi 1 9 7 2 ) , although intercsting, is not ea-ily niadc becausc of the different modcs of failure. A comparison can be made using vari- ous as;um;tions as far as thc depth, sizc, and the loading ratc are conccrfied. A logical critericn to follow might be to cornparc the performanc? of the two types of anchors having thc same diameter, at the same depth and at the salne di;placemcnt or averzge displace~ncnt rate. Unfortunatcly, becauze the diarncter of
thc rod anchors was only about 6 i-1. ( 15 c m ) and that of the :crew anchors varied from 8 to 15 in. ( 2 0 to 38 c m ) , the first condition cannot be met. Neglecting this condition, one can cornparc, for example, the short term capacities of two particular anchors installed at the same depth. Two such anchors are the screw anchor 1 - 1 0 N (Table 1) and thc grouted rod anchor TG-3 reportcd previously (Johnston and Ladanyi 1972, Table 1 ) . It will be seen that both anchors werc installed to a dcpth of 10 ft ( 3 m ) . Although the 6 in. ( 15 c m ) diameter rod anchor attaincd a maximum load of 38 tons (34.2 t ) in about 3 7 min after about 2 in. ( 5 c m ) displaccment, the 1 0 in. ( 2 5 c m ) diameter screw anchor attaincd only about 7.6 tons (6.8 t ) load for the same time and displacement, that is, about 20% of the grouted rod capacity. With increasing times to failure, it was found that the difference very rapidly increases.
Interpretation of Test Results
A study of available expcrimental evidence on the behavior under uplift loads of footings and anchors cmbeddcd in unfrozen cohcsive soils (Meyerhof and Adams 1968) has shown that when anchors are at shallow dcpths, the soil is mainly strcssed in flexure and fails by tcnsion cracking. A t great depths, however, it was thought that flexing of the cohesive soil mass would be prevented by the weight of the overburden and that the resistancc to uplift would be dctermined by the shcar strength of thc soil mass. For this case, thc limiting uplift capacity of a plate anchor was found to be approximately dctermined by the bearing ca- pacity formula for a dcep footing.
As all of the screw anchors tested in this investigation wcre embeddcd deeply in frozen soil, which is, in fact, a highly cohesive mate- rial, their bchavior was essentially similar to that of deep footings of the same size. The similarity can hold, obviously, only as long as the effect of thc free ground surface remains negligible or equal in the two cases. Sincc the dcpth to diameter ratio of the anchors was greater than 1 0 and, in addition, the total dis-
placements in the tests did not excced about 5 0 % of the plate diameter, the condition of similarity with deep footings was considered to be satisfied. I n fact, as mentioned previously,
JOHNSTON AND LADANYI: SCREW ANCHORS IN PERMAFROST 355
when the anchors were excavated, there was no 131 s ( t ) = si
+
Stevidence that total uplift failure had reached the ground surface.
If this similarity is accepted, then the uplift capacity of a circular anchor plate embedded deeply in frozen soil is approximately given by the following expression (similar to Eq. [19] in Meyerhof and Adams 1968) :
where:
W
=
weight of lifted soil mass and weight of anchor,B = plate diameter, and
q,,,, = the ultimate bearing capacity. Thc ultimate bearing capacity can be expressed by the usual bearing capacity equation (by neglecting the soil weight term because of depth) :
Ladanyi and Johnston 1974 have shown that the ultimate uplift capacity of the anchors can be predicted in the same manner provided the complete constitutive creep equation of the frozen soil has bcen independently determined by a laboratory or in situ investigation. It was found that not only the cohcsion, c, in Eq. [2] is a function of time and tcmperature, but also that the bearing capacity factors N,, and N , are affected by the nonlinearity of creep behavior. The equations and graphs for determining N,, and N,. are given in the abovc noted paper.
It is the intention here to describe a method which shows how field data obtained from creep tcsts of screw anchors can bc put into analytical form and used for the design of anchors undcr the samc site conditions but whcre different loading schedules and times under load may be involved.
As in creep testing of grouted rod anchors, in practice one is mainly concerned with the prediction of displacements in the secondary o r ctcady-state creep stage. This is b ~ c a u s c the tertiary stage is usually considered to be beyond the point of crecp failure, while the primary stage represents, for long timc intervals, only a small portion of the total time. For long time intervals any point on the secondary creep line niay, therefore, be given by the following equation:
where:
s ( t ) = time-dependent displaccment, si
=
pseudo - instantaneous displace-ment (the intercept on the ordi- nate axis of the steady-state creep line at zero time, as defined in Johnston and Ladanyi 19.72, Fig. 1 4 )
S
=
ds/dt = steady-state displacement rate, andt = time.
At a givcn frozen soil t e m ~ e r a t u r e , both si
and S are functions of t h e applied net uplift pressure, q,,,,,
Once the functions F and G have been experi- mentally determined, e.g. from the anchor tcst data, the displaccment of an anc1;or under a sustained load can be determined from Eq. [3]. Thc value of q,,,t is obtained by subtracting the overburden pressure y D from the pressure mea- sured at the ground surlace, i.e. from the uplift load Q,
[61 q n e t = ( Q - W > / [ r ( B 2 / 4 ) l
If the anchor is loaded by a series of increas- ing step loads, as shown in Figs. 9, 10, and 11, the displacement at a givcn time may be evaluated from
[71 s ( t ) = ~ ( q . . , , )
+
+ ~ ( q . , . t ) a tThe analytical form of thc two functions, F and
G in Eq. [7], can usually be determined by
plotting the pseudo-instantaneous displacements and steady-state creep rates versus the applied stress. In the case of grouted rod anchors (Johnston and Ladanyi 1972) it was shown that the two relationships linearized when plotted in a log-log plot,Athus permitting the two functions to be expressed by equations of a power-law type. This is understandable, be- cause the rod anchors produced deformations very similar to those in an ordinary simple shear test.
As the deformations produced by the screw anchors were much morc complex, similar to
356 C A N . G E O T E C H . J . VOL. 1 1 , 1974
. .
those around a deep footing, the form of the
-
-% two functions was seen to be approximately ' 3 +. -
hyperbolic, as is usual when deep footings
.-
=r..- .
penetrate into a soil mass (Perloff and Rahim :: 1966). In other words, the most convenient analytical form of the functions F(q,,,,) and
0.8
G(q,,,.l ) was found to be:
3 0 . 6 -
[S] F(qnet) = s i = s c i
93s - 9 2 0 . 4 -
In the::c two equations, s,.' and S,. are arbitrary constants. The four paramcters, C, qiIsi,
C,
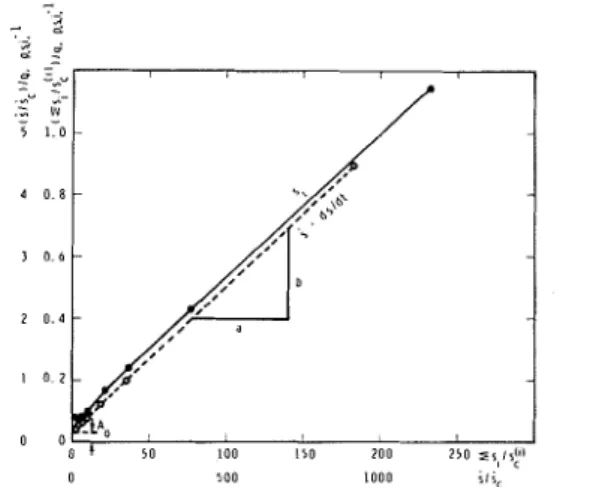
and q:,,, can bc found by plotting the ficld data for pseudo-instantaneous displacement and creep rate for each crecp stage in a plot originally shown by Kondncr (1963), in which such hyperbalic data linearize. One such plot is shown in Fig. 12 for anchor I-
1 ON.Subsequent
to selecting the arbitrary con- stants s,.' = 10-"n. and S,. = lo-;' in./min, the following wcrc plotted in Fig. 12: on the abscissa-the cunlulativc pseudo-instantaneous displacemcnt, 2s; over s,.', and the displacement rate, S, ovcr S,., respectively; on the ordinate- thc values on the abscissa were divided by the total uplift pressure q, that is, (Ss;/s,.')/q and (S/S,.)/q, respectively. From the straight line obtained in this plot, e.g. for the rate linc in Fig. 12, the values of the parameters are given by[ l o ]
c
= A,, a/b andIn a similar manncr C and q,,,' are obtained from the displacement line. The valucs of the four paramcters for the six single hclix anchors tested at the Thompson site are given in Table 1.
When comparing the values of the param- eters lizted in Table 1 for the six anchors, it
FIG. 12. Transformed plot of pseudo-instantaneous
displacement and creep rate data for anchor 1-ION.
by various factors, such as, anchor depth (the silt cgntent increased with depth at the test site), a ~ c h o r diamcter, D/B ratio, soil tem- perature, and degree of disturbance during in- stallation. It is, therefore, not surprising that the q,,,, derived from the rate equation, was not quite the same for all six anchors, but showed a tcndency to increase with increasing B, D, and D/B.
With the hclp of Eqs. [7]-[9], and by using the values of parameters given in Table 1, i t
is possib!e to extrapolate the measured infor- mation and predict thc behavior of similar anchors undcr any given dcsign loading con- ditions. One can, for cxamplc, predict the ratc of displacemcnt of a given anchor under the dc~ign load, or the timc at which, under a given load, an allowable total displacement will be attained.
For cxample, if s;,!, is an allowable total dis-
placement, then the time required to attain that displaccnlent under a given nct uplift pressure, q,,,.., will be according to Eqs. 131-[5]:
whcre F ( q ,,,.,) and G ( q
,,,.
t ) arc given by Eqs.[8] and [9], rcspectively.
Taking anchor 1-1 ON as an example, and using values from Table 1 we obtain:
F(qnc,) = 0.153
-
(in.) 216 - qJOHNSTON AND LADANYI: SCREW ANCHORS IN PERMAFROST 357
G(q,,,) = 0.529 4 (Inelday) that the anchors behaved, under pull-out loads, 212.5
-
q in a manner that was essentially very similar from which, for example, one can find thatunder a step load of q = 50 p.s.i. (3.5 kg/cm2) this particular anchor would reach an allowable disp!acement of 2 in. ( 5 cm) after
2.0 - 0.046
[req =
0.163 = 12 days
In the same manner, the times required for all the anchors to reach a 2 in. ( 5 cm) displace- ment under q = 50 p.s.i. (3.5 kg/cm2) have been calculated and are given in Table 1. The time versus load line shown in Fig. 13 was calculated in the same way for anchor 1-ION. The load Q, corresponding to a given time and selected allowable displacement, can then be picked from this plot.
In addition to the information just described, it should be noted that, in Fig. 11 of the paper by Ladanyi and Johnston 1974, a plot of the net pressure versus the resulting creep rate was shown for three of the anchors (1-ION, 2-10N and 1-1OHP). This plot can be used for quickly estimating the average creep rate for a given design load applied to the same type of anchor in similar ground conditions.
Conclusions
Several conclusions can be drawn from evi- dence obtained when a number of single-helix, power-installed screw anchors deeply embedded in frozen varved soil were creep tested at Thompson, Manitoba.
From the test results, it can be concluded
o : , . 17, k i p s
T I M t . lrep D A Y S
FIG. 13. Anchor 1-ION. Load versus time rela- tionship for an allowable total displacement of 2 in.
(5.1 cm).
to that exhibited by deep footings of the same size. One important aspect of this behavior, however, is that the anchors required relatively large displacements to attain their ultimate capacities. In addition, the tests showed that large displacement rates occurred under quite small pressures so that the anchors very quickly reached total displacements that might nor- mally be allowed for structure anchors.
The relatively low pull-out capacities of the single helix anchors tested cannot be attributed directly to the disturbance of the soil column above the plates that might have occurred during installation. In fact, from a visual ex- amination of the anchors in trenches excavated following testing, it was concluded that the dis- turbed soil column had completely refrozen during the 3 year period between installation and testing and it appeared to have had only a minor effect on anchor behavior. It should be noted that, had the anchors been tested shortly after they were installed, then the influ- ence of the disturbcd column of soil presumably would have been of more significance and per- haps would have resulted in even lower pull- out capacities.
In practice, groups of screw anchors might be considered to obtain the required pull-out capacity and limit the displacement. Whether or not multiple helix anchors would provide significantly increased capacities is pure specu- lation at this time and is a subject for further investigation. The ease with which screw an- chors, either single or multiple helix, can be installed in frozen ground, the amount of soil disturbance caused during installation, and the time period between the time of installation and loading of the anchor (with regard to 'healing' of the disturbed material) are important factors to be considered.
The screw anchors reported here were in- stalled with some difficulty in 'warm tempera- ture', frozen, fine-grained soil-materials that might be considered ideal from an installation point of view. To improve installation of an- chors in similar materials and other frozen soil types, and particularly when lower ground tem- peratures are experienced, the plates and rods need to be thicker and larger, the connections stronger, and the power of installation equip-
358 C A N . GEOTECH. J . VOL. 1 1 , 1974
ment considcrably increased. Larger diameter plates could also be considered to increase the pull-out capacity; in this case much stronger anchors and more powerful installation ma- chinery would be required.
As a general conclusion of the test programs carried out on both grouted rod and power- installed single helix anchors installed at the same permafrost site, it can be said that, in this particular type of frozen soil, grouted rod an- chors are as easy to install and have several times higher pull capacities when compared with the screw anchors at the same depth, dis- L .
placement, and time to failure. Notwithstanding the fact that mixing and placement of grout must be carefully controlled, it is concluded that for thc site conditions cncountercd, the use of grouted rod anchors is very likely to be much more reliable, efficient, and cconomical than the use of power-installed screw anchors.
Acknowledgments
The assistance of several D.B.R. tcchnical officers who participated in the installation and tcsting of the anchors is gratefully acknowl- edged. Special thanks are extended to I. Reinart, Teshmont Consultants Ltd., and to
G . E. McLure, Manitoba Hydro who helped with the procurcment of materials and provided
personnel and equipment during the installation phase.
This paper is a contribution from the Divi- sion of Building Research, National Research Council of Canada, and is published with the approval of the Director of the Division.
ADAMS, J. I., and HAYES, D. C. 1967. Theuplift capacity of shallow foundations. Ont. Hydro Res. Q. 19 (I), pp. 1-13.
ADAMS, 1. I., and KLYM, T. W. 1972. A study of anchor- ages for transmission tower foundations. Can. Geotech. J. 9 (I), pp. 89-104.
BHATNAGAR, R. S. 1969. Pullout resistance of anchors in silty clay. M.Sc. thesis, Duke Univ. Sch. Eng., Durham, N.C., Soil Mech. Ser. No. 18.
H A N N A , T. H., and CARR, R. W. 1971. The loading be- haviour of plate anchors in normally and over consoli- dated sands. Proc. 4th Conf. Soil Mech., Budapest, Hung. pp. 589-600.
JOHNSTON, G. H., and LADANYI, B. 1972. Field tests of grouted rod anchors in permafrost. Can. Geotech. J. 9(2), pp. 176-194.
KONDNER, R. L. 1963. Hyperbolic stress-strain response: cohesive soils. Proc. A.S.C.E. 89(SM1). . . . DD. ..
115-143.
L A D A N Y I . B.. and JOHNSTON. G. H. 1974. Behaviour of circular footings and p~atk anchors embedded in per- mafrost. I n press.
MEYERHOF, G. G., and ADAMS, J. I. 1968. The ultimate uplift capacity offoundations. Can. Geotech. J. 5, pp. 225-244.
PERLOFF, W. H., and RAHIM, K. S. A. 1966. A study of the pressure-penetration relationship for model footings on cohesive soil. Presented at 45th Annu. Meet. Highw. Res. Board, Wash., D.C.