Publisher’s version / Version de l'éditeur:
Journal of Cellular Plastics, 30, 2, pp. 106-124, 1994-03
READ THESE TERMS AND CONDITIONS CAREFULLY BEFORE USING THIS WEBSITE. https://nrc-publications.canada.ca/eng/copyright
Vous avez des questions? Nous pouvons vous aider. Pour communiquer directement avec un auteur, consultez la première page de la revue dans laquelle son article a été publié afin de trouver ses coordonnées. Si vous n’arrivez pas à les repérer, communiquez avec nous à PublicationsArchive-ArchivesPublications@nrc-cnrc.gc.ca.
Questions? Contact the NRC Publications Archive team at
PublicationsArchive-ArchivesPublications@nrc-cnrc.gc.ca. If you wish to email the authors directly, please see the first page of the publication for their contact information.
NRC Publications Archive
Archives des publications du CNRC
This publication could be one of several versions: author’s original, accepted manuscript or the publisher’s version. / La version de cette publication peut être l’une des suivantes : la version prépublication de l’auteur, la version acceptée du manuscrit ou la version de l’éditeur.
For the publisher’s version, please access the DOI link below./ Pour consulter la version de l’éditeur, utilisez le lien DOI ci-dessous.
https://doi.org/10.1177/0021955X9403000201
Access and use of this website and the material on it are subject to the Terms and Conditions set forth at
Techniques to assess the role of various components in retarding
aging of rigid, faced thermal insulating foams
Bomberg, M. T.; Kumaran, M. K.; Ascough, M. R.; Creazzo, J. A.; Zane, J.
K.; Syrop, A. H.
https://publications-cnrc.canada.ca/fra/droits
L’accès à ce site Web et l’utilisation de son contenu sont assujettis aux conditions présentées dans le site LISEZ CES CONDITIONS ATTENTIVEMENT AVANT D’UTILISER CE SITE WEB.
NRC Publications Record / Notice d'Archives des publications de CNRC:
https://nrc-publications.canada.ca/eng/view/object/?id=11696f23-3508-4b8b-b053-06cdee615bcf https://publications-cnrc.canada.ca/fra/voir/objet/?id=11696f23-3508-4b8b-b053-06cdee615bcf
T e c hnique s t o a sse ss t he role of va rious c om pone nt s in re t a rding
a ging of rigid, fa c e d t he rm a l insula t ing foa m s
N R C C - 3 6 0 6 6
B o m b e r g , M . T . ; K u m a r a n , M . K . ; A s c o u g h , M . R . ;
C r e a z z o , J . A . ; Z a n e , J . K . ; S y r o p , A . H .
M a r c h 1 9 9 4
A version of this document is published in / Une version de ce document se trouve dans:
Journal of Cellular Plastics,
30, (2), World Congress : Polyurethane '93 93), pp.
106-124, March-94, DOI:
10.1177/0021955X9403000201http://www.nrc-cnrc.gc.ca/irc
The material in this document is covered by the provisions of the Copyright Act, by Canadian laws, policies, regulations and international agreements. Such provisions serve to identify the information source and, in specific instances, to prohibit reproduction of materials without written permission. For more information visit http://laws.justice.gc.ca/en/showtdm/cs/C-42
Les renseignements dans ce document sont protégés par la Loi sur le droit d'auteur, par les lois, les politiques et les règlements du Canada et des accords internationaux. Ces dispositions permettent d'identifier la source de l'information et, dans certains cas, d'interdire la copie de documents sans permission écrite. Pour obtenir de plus amples renseignements : http://lois.justice.gc.ca/fr/showtdm/cs/C-42
'Thchniques to Assess the Role
of Various Components in Retarding
Aging of Rigid, Faced Thermal
Insulating Foams
M. T. BOMBERG* AND M. K. KUMARAN
National Research Council (NRC) Canada Montreal Road
Ottawa, Ontario, Canada K1A OR6
M. R. ASCOUGH
DuPont Canada Inc
MississaugaJ Ontario
J. A. CREAZZO
E. I. du lbnt de Nemours & Co. Chesnut Run Plaza
P.O. Box 80711 Wilmington, DE 19880.()711
J. K. ZANE AND A. H. SYROP
BASF Corporation 1609 Biddle Avenue Wyandotte, MI 48192-3736
INTRODUCTION
A
s industry began to evaluate CFC-replacements, it became ap-parent that foam performance characterizations have been based*Author to whom correspondence should be addressed.
106 JOURNAL OF CELWLAR PLASTICS Volume 30- March 1994 0021-955X/94/02 0106-19 $06.00/0
Techniques to Assess the Role of Various Components 107
primarily on empirical evidence collected over a long period of gradual improvements. Much of the existing wealth of knowledge was simply not applicable to new systems. The development of new products with CFC replacements requires understanding how formulation variables (polyol, isocyanate, blowing agent, catalyst) and manufacturing condi-tions affect foam properties, how condicondi-tions in use affect foam perfor-mance and how the process of sample selection and testing may be used to provide feedback to design improved foams.
Testing forms an important link in this process. Testing technique that assumes uniform sample may not adequately characterize the foam's overall performance. Foam conditioning at elevated tempera-ture, while useful for quality control on a given polymeric foam, is not suitable when comparing different combinations of polymer and blow-ing agents (4].
From SPI!NRC and DuPont/NRC joint research, new techniques were developed for estimating long-term thermal performance of foams. Recognizing the differences in cell morphology between the surface and core regions of foam products [5], all these new techniques use thin layers (slices) for measurements of diffusion or thermal properties (resistivity or conductivity). By measuring thermal resistivity as a '· function of time on open or partly encapsulated slices and normalizing these results, the characteristic aging curve is obtained (4]. This aging curve characterizes combined diffusion and solubility performance of the given polymeric matrix. This curve is affected very little by varia-tion in such factors as BA concentravaria-tion or extincvaria-tion coefficient, which alter thermal properties of the foam with little or no effect on the rate of gas transport through the foam. For this reason, the normalized ag-ing curve may be used to calculate long-term thermal resistance with a scaling method [6,7] if the foam is homogenous enough, or to calculate the diffusion coefficient of blowing agent if the first stage of aging process (air ingress) has already been completed [8].
Measuring thermal resistivity (conductivity) as a function of temperature on partially or fully encapsulated specimens permits de-termination of the blowing agent concentration if the condensation of the blowing agent occurs within the tested temperature region. For blo-wing agents which do not condense in the tested range of temperatures, additional information on cell gas composition may be needed (4].
Our work, focused on testing ;nethodology, addresses the package of techniques related to selection of foam components, including a blow-ing agent, screenblow-ing of foam variability and assessment of long-term performance of the foam insulating system, i.e., foam provided with im-permeable facers. This package can link tasks of the chemist
for-108 M. T. 80MBEAG ET AL.
mulating foam system with that of the foam manufacturer and the user asking questions about long-term thermal performance of the in-sulating system under specific conditions of use.
TECHNIQUES USED IN THIS RESEARCH
It is established that a fully encapsulated foam retains its initial thermal performance [9]. The blowing agent redistribution within the specimen and dissolution processes continues, but the encapsulation prevents the entry of air components into the foam. There is virtually no change in the thermal performance of this fully encapsulated foam specimen, because the cell-gas only contains the blowing agent. The thermal conductivity of the cell-gas does not depend on the pressure of the gas (as long as the gas pressure does not fall below 0.01 at-mosphere) [10]. Thus, despite the change in the cell-gas pressure, as long as air has not entered into the cells of the foam, the thermal con-ductivity (k-factor) does not change. For this reason, foams with im-permeable sheet metal facings demonstrated high thermal perfor-mance for an extended period of time [10]. The zero-aging panel, however, requires perfect encapsulation on all sides.
The effect of impermeable barriers is often greatly reduced by lateral diffusion in a thin layer of the foam adjacent to the impermeable facers. Even though this layer is only a few cells thick, the rate of gas diffusion parallel to the impermeable barrier may greatly exceed the rate of dif-fusion in the normal direction of the foam, even at significant distances from the edges, and reduce its thermal performance. Three reasons may be associated with the phenomenon of diffusion parallel to the im-permeable gas barrier: (1) the roll-over of the cells during the lamina-tion process, (2) the poor adhesion of the gas barrier to the foam, and (3) the collapse of cell walls under a shear stress introduced by the differences between the expansion coefficient of the metallic gas bar-rier and the foam. These effects may reduce the efficiency of the gas barriers, even when they are applied under well controlled conditions. This paper reviews five techniques used for screening of foam compo-nents (polyols, isocyanates, blowing agent and gas barriers), as well as manufacturing process with a view to ensuring good, long-term ther-mal performance of the foam. All these techniques employ periodic measurements of thermal properties such as thermal resistivity or thermal conductivity (one is the inverse of the other) either as a func-tion of time or temperature. Two of them use 25 mm thick specimens, a traditional thickness used in these measurements. Three others, more recently developed at NRC during collaborative work with
indus-Techniques to Assess the Role of Various Components 109 try (SPIINRC [1] and DuPont/NRC [2]), involve thermal measurements performed on either completely or partially encapsulated thin layer specimens (slices). These slices are cut from different locations in the cross-section of the product, allowing examination of how the manufac-turing process affects the variability in material properties.
Furthermore, encapsulating the specimens permits performing ther-mal measurements after a few months when the process of gas redistri-bution is completed. As the encapsulation eliminates gas exchange bet-ween the environment and the specimen, the repeated measurements on encapsulated specimen may help in assessing the effect of redistri-bution of air and the blowing agent(s) solubility in the polymer (11].
When a foam has a densified material layer (skin), which may reduce the rate of aging, the specimen is encapsulated on all surfaces except the skin surface so. that the diffusion through this surface can be com-pared to that of the core material. 'lb eliminate gas flow through the surfaces other than the tested one, they were encapsulated with an epoxy resin applied in the manner previously described by Kumaran et a!. [2].
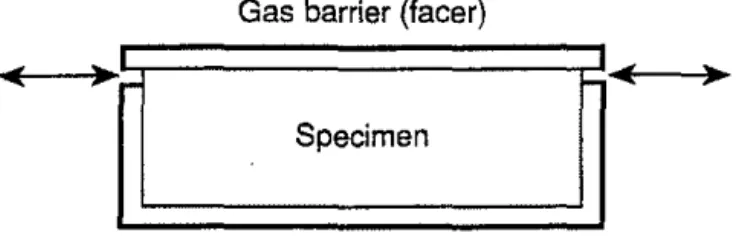
Another technique employing a partly encapsulated specimen was used for foams provided with gas barriers (impermeable facings). A thin layer of material adjacent to the facing is cut and encapsulated on all the surfaces except for that of the gas barrier. Then, a slot, 1 to 2 mm wide, is cut around the perimeter, directly under the gas barrier (see Figure 1). The effect of the open slot on thermal resistance of the slice should not be evident for several months, because the theFmal resistance is measured on a central, metering area of the specimen, i.e., is separated from edges by a distance many times longer than the spec-imen thickness. If, however, the rate of lateral diffusion through the layer adjacent to the facer is much higher than the rate of normal gas diffusion, then a significant reduction of thermal resistance will be
Gas barrier (facer)
Specimen
Note: The arrows Indicate path of gas flow
Figure 1. Schematic of partial encapsulation for surface layers provided with gas
110 M. T. 80MBEAG ET AL.
measured already within a few months. Therefore, measuring the rate of change in thermal properties on such, partly encapsulated, spec-imens can be used to estimate efficiency of facers in retarding the aging process.
'Ib examine the discriminating value of this technique as well as some of the techniques described in previous research [1-3], an evalua-tion of foam components, blowing agents, manufacturing process and efficiency of gas barriers was performed. Results are reported in the form of three series of comparative tests. The first series involved screening two polyols, two types of PMDI and two blowing agents to ar-rive at the best combination of the components. The second series in-volved screening of four different blowing agents for one polyol/PMDI combination. Since these series were intended to assess relative sig-nificance of different factors (screening tests), they included only a few specimens.
Conversely, the third series of tests was to evaluate the efficiency of the gas barrier in retarding the aging of a polyisocyanurate board manufactured with a reduced amount ofCFC-11. As the results of such evaluation may depend on variability in material properties, this eva-luation required a large number oftest specimens.
MMERIALS AND RESULTS
Initially two blowing (frothing) agents and four foam components (two polyols and two types of PMDI) were included in comparative eva-luation performed in two laboratories. Table 1 shows the combinations of the blowing agents and ''N' and "B" components and primary characteristics of froth foams manufactured and tested at BASF Cor-poration. Three of these foams (codes 1810, 1811, 1812) were also tested
Table 1. Component selection and characterization of the foams used in the first test series.
Code 1810 18101 18s 1811 1812 31s 31i Blowing agent CFC-11112
• •
HCFC-22• •
•
• •
Polyol Polyol 1• •
• • •
Polyol 2• •
Isocyanate PMDI-1•
•
•
•
PMDI-2•
•
•
Density kg/m3 core 33.6 32.8 33.5 34.3 34.0 35.2 34.9 % closed cells 90.6 90.0 91.2 92.4 95.5 87.4 90.4'Thchniques to Assess the Role of Various Components 111
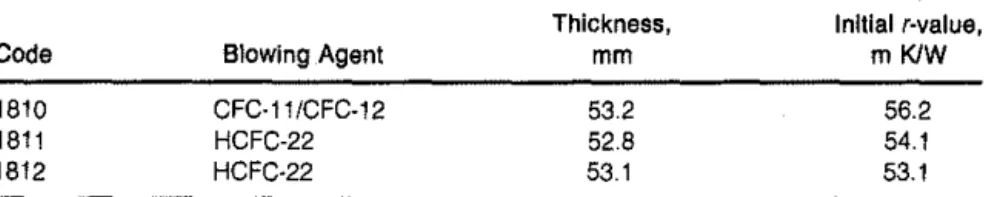
Table 2. Characterization of specimens prepared for thermal testing at NRC.
Code 1810 1811 1812 Blowing Agent CFC·11/CFC·12 HCFC·22 HCFC·22
Thickness, Initial r·value,
mm m KIW
53.2 56.2
52.8 54.1
53.1 53.1
at the National Research Council (NRC) Canada (see Table 2). The foam 1810, in this paper, is also referred to as "CFC foam:'
As a second series in this study (see Table 3), the polymer composition was fixed, and four different blowing agents, HCFC-141b/HCFC.22, HCFC-22, HFC-134a arid HFC-152a, were used in pressurized froth foams.·
In the third series of tests, yet another product (polyisocyanurate called C) laminated with impermeable gas barrier was tested. It was a free-rise product, faced with a gas barrier made out of Kraft paper laminated with aluminum foil and manufactured on a commercial equipment as 25 mm thick board and cut in 1.2 m x 2.4 m pieces.
セ@ The research involved testing standard thickness (25 mm thick) and thin layer specimens (5 to 10 mm thick slices). Different techniques for preparation of slices were previously discussed by Edgecombe [12]. The technique of cutting with a horizontal band saw was used, and the thickness of the destroyed surface layer (TDSL) was measured with the air displacement method (see Schwartz eta!. [13]). The values ofTDSL were consistent for the tested specimens prepared with the band saw, although slightly higher than those determined on specimens prepared by means of surface grinding (Carborundum disc) [13]. Because of the consistency in the TDSL results and the comparative character of this work, all test specimens were prepared with the band saw.
Thin specimens were also used to determine distribution of density in
Code
430·88 430·90 430·94 430·92
Table 3. Characterization of the second series specimens prepared for thermal testing.
Blowing. Thickness, Initial イセカ。ャオ・L@
Agent mm mKIW
HCFC·221141 b 53.2 49.2
HCFC·22 52.9 51.1
HFC·134a 53.0 50.8
112 M. t 80MBERG ET AL.
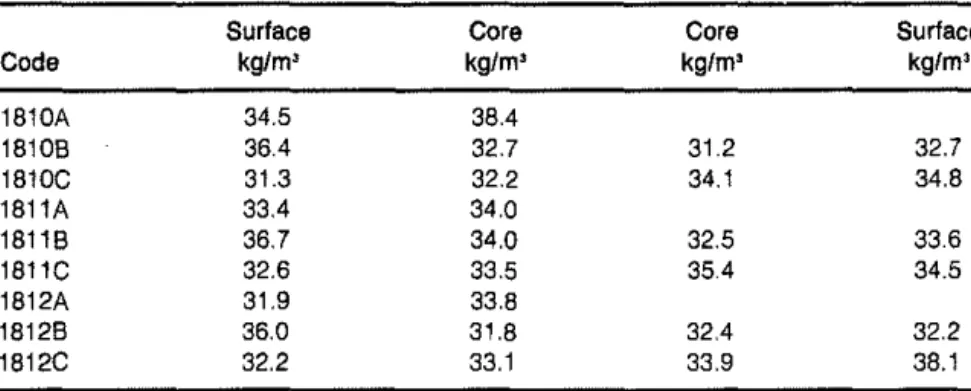
Table 4. Density of the ffrst series specimens prepared for thermal testing.
Surface Core Core Surface
Code kg/m' kg/m' kg/m' kgfm3 1810A 34.5 38.4 18108 36.4 32.7 31.2 32.7 1810C 31.3 32.2 34.1 34.8 1811A 33.4 34.0 18118 36.7 34.0 32.5 33.6 1811C 32.6 33.5 35.4 34.5 1812A 31.9 33.8 18128 36.0 31.8 32.4 32.2 1812C 32.2 33.1 33.9 38.1
the foam cross-section when selecting components during optimization of the overall thermal performance of the foam. Tables 4 and 5 show the density of four layers cut from each surface and material core. These layers were cut from three locations of each foam board.
Variations in density shown in Tables 4 and 5 indicate that the ex-perimental foam products were manufactured with acceptable unifor-mity. Table 2 indicates small differences in the initial thermal re-sistance of different foams used for screening process, i.e., selecting polyol and isocyanate components. Table 3 shows somewhat lower level of initial thermal resistance in the second test series, although the dif-ferences between various foams were also small. Equally uniform was Product C, manufactured at nominal density of 29 kg/m' (Table 6).
Using the test data in Table 6, a mean density of28.6 kg/m' (standard deviation 1 kg/m') and a mean thermal resistivity of 50.7 m'K/W (stan-dard deviation 1.3 m'K/W) were calculated. The initial thermal
Table 5. Density of the second series specimens prepared for thermal testing.
Surface Core Core Surface
Code kg/m3 kg/m3 kg/m3 kg/m3 430·88A 30.4 31.0 31.3 31.8 430·888 30.5 30.1 30.5 31.4 430·90A 37.3 36.4 33.7 32.7 430·908 37.4 37.1 34.2 31.4 430·92A 32.7 32.2 31.9 30.9 430-928 31.6 32.5 31.8 30.7 430-94A 41.9 40. 39.3 37.6 430-948 40.3 40.0 39.5 38.6
Techniques to Assess the Role of Various Components 113
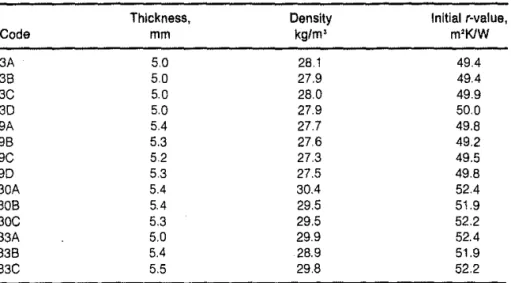
Table 6. Thickness, density and initial r-value for unlaced core layers of product C (3rd series).
Thickness, Density Initial rMvalue,
Code mm kg/m' m2K1W 3A 5.0 28 1 49.4 38 5.0 27.9 49.4 3C 5.0 28.0 49.9 30 5.0 27.9 50.0 9A 5.4 27.7 49.8 98 5.3 27.6 49.2 9C 5.2 27.3 49.5 90 5.3 27.5 49.8 30A 5.4 30.4 52.4 308 5.4 29.5 51.9 30C 5.3 29.5 52.2 33A 5.0 29.9 52.4 338 5.4 28.9 51.9 33C 5.5 29.8 52.2
resistivity measured on standard thickness encapsulated specimens (':(able 7) and encapsulated slices cut from surface layers (Table 8) shows that product C is highly uniform.
Mean value of thermal resistivity measured on full thickness, faced, specimens, Table 7, is 54.5 m'K/W, compared to initial thermal resis-tance of about 51 m'K/W measured on unfaced slices (Table 6), ·in-dicating that some aging process has already occurred before those core slices were tested. Similarly, encapsulated and faced, thin-layered spec-imens, for which measured initial thermal resistivity values are shown in Table 8, varies from the lowest r-values similar to that of unfaced material shown in Table 6, to the highest values similar to those of the standard thickness boards shown in Table 7.
Table 7. Thickness and initial r-value of standard thickness, faced board specimens.
Thickness, Initial r-value, Thickness, Initial rMvalue,
Code mm m2KIW Code mm m2KJW
2a 26.9 53.3 27 27.8 54.0
2b 25.9 53.8 34 26.5 54.0
2c 26.6 56.0 12 25.2 54.6
114 Code 4a 4b 4c 4d 10a 10b tOe 10d Sa Sb Sc Sd M. T. BOMBERG ET AL.
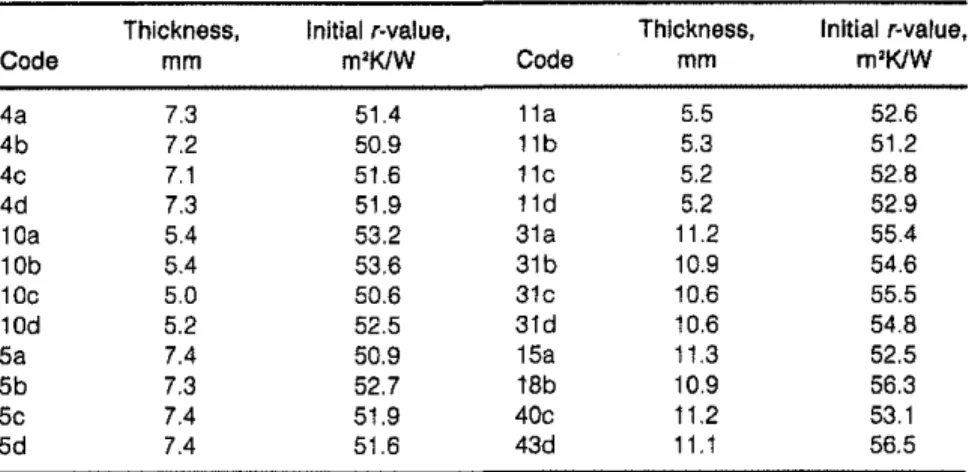
Table B. Thickness and Initial r-value for encapsulated and faced surface layers of product C.
Thickness, Initial r-value, Thickness, Initial イセカ。ャオ・L@
mm m2KIW Code mm m2KIW
7.3 51.4 11a 5.5 52.6 7.2 50.9 11b 5.3 51.2 7.1 51.6 11c 5.2 52.8 7.3 51.9 11d 5.2 52.9 5.4 53.2 31a 11.2 55.4 5.4 53.6 31b 10.9 54.6 5.0 50.6 31c 10.6 55.5 5.2 52.5 31d 10.6 54.8 7.4 50.9 15a 11.3 52.5 7.3 52.7 18b 10.9 56.3 7.4 51.9 40c 11.2 53.1 7.4 51.6 43d 11.1 56.5
COMPONENT SELECTION IN RELATION TO LONG-TERM THERMAL PERFORMANCE
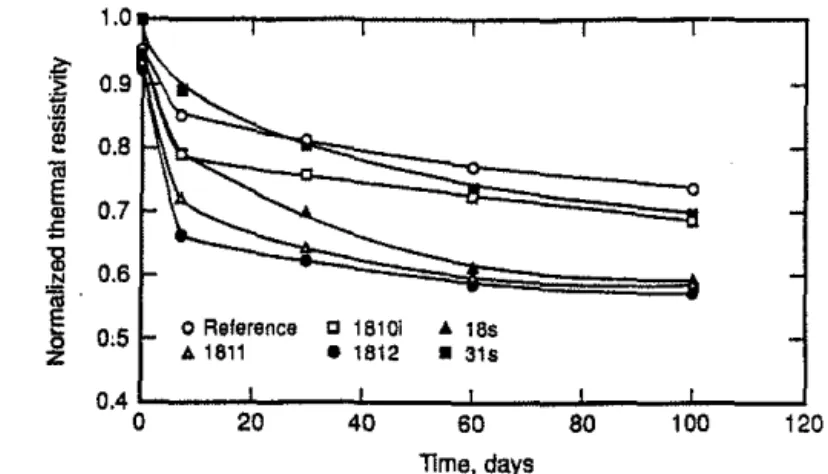
Different techniques can be used for screening the foam components, i.e., evaluating their compatibility and ratio to achieve a required level of long-term thermal performance. Figure 2 shows the aging curve [thermal resistivity (r-value) versus aging time] for foams used in the first test series. These results are presented as the dimensionless
ther-1.0 2:-0.9
:t
I!! 0.8 1il E 0.7 Q) ,.;..,
Q) Mセ@ 0.6セ@
0 0.5 o Reference D 18101 • 18s z ... 1811 • 1812 • 31s 0.4 0 20 40 60 80 100 120 Time, daysFigure 2. Dimensionless thermal resistivity for 20°C aging of 25 mm thick specimens. Foam codes and blowing agents are as follows: 1810 (CFC-11/CFC-12-reference), 1810i (CFC-ll/CFC-12), 18s (HCFC-22), 1811 (HCFC-22), 1812 (HCFC-22), 31s (HCFC-22).
Techniques to Assess the Role of Various Components 115' 1.0
f
0.9e
0.8 'iile
0.7"
=
a! 0.6 .!:! 'iil'セ@
o,s
o Reference a 1810i • 18sA 1811 • 1812 • 31S
0.4
0 20 40 60 80 100 120
11me, days
Figure 3. Dimensionless thermal resistivity for 60<>C aging of 25 mm thick specimens. Foam codes and blowing agents are as follows: 1810 (CFC-11/CFC-12-reference), 1810i (CFC-ll/CFC-12), 18s (HCFC-22), 1811 (HCFC-22), 1812 (HCFC-22), 31s (HCFC-22).
mal resistivity, i.e., thermal resistivity divided by the initial r-value. The foam with the highest thermal resistivity at time zero was selected ,as the basis of normalization-the foam coded 31s manufactured with
HCFC-22.
Use of the dimensionless r-value makes comparison of aging curves easy. First, differences in the initial r-values, as large as 12 percent, may be observed. Second, variance in the rate of aging is also easily observed. For example, one foam, coded 1811, started at the level com-parable to the CFC foam (1810) but aged faster than the reference foam. However, another foam (coded 31s) showed aging rate lower than the reference CFC foam. Even though this foam (manufactured with HCFC-22) aged more than the CFC-11/CFC-12 foam, after 100 days of aging it showed an r-value equal to that of the CFC reference foam.
Figure 3 shows aging of the same foams measured during the expo-sure to elevated temperature (60'C). The aging curves obtained under these conditions show similar relationships between different foams. Foam coded 31s showed the highest value of initial thermal resistivity, and its aging curve is therefore started at the dimensionless value of one. This foam shows the rate of aging slightly faster than that of the CFC foam, reaching after 100 days of aging a level of thermal perfor-mance slightly lower than the CFC foam. Similar to Figure 2, foam coded 1812 shows poor long-term thermal resistivity. Comparing Fig-ures 2 and 3, one may, however, observe a difference in aging of foams coded 18s and 1811. These two foams, when exposed to elevated
tem-116 M. T. BOMBERG ET AL.
perature, showed larger reduction of thermal performance than was the case at room temperature.
Figures 2 and 3 show aging curves obtained on 25 mm thick spe-cimens cut from 50 mm thick panel. While testing at 7, 30, 60 and 100 days is convenient for control of a foam quality, i.e., comparisons for the same polymeric material; this type of testing does not permit eva-luating long-term thermal performance for different types of polymeric materials [4].
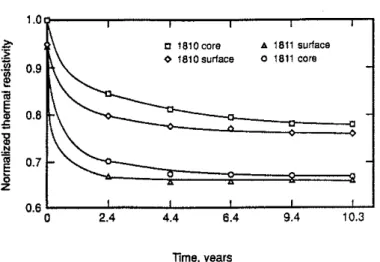
'1b evaluate long-term thermal performance [3,14], aging curves were measured on 10 mm thick core and surface specimens and then recalculated for the standard thickness of the foam (52 mm) (see Figure 4) using thickness corrected with the thickness of destroyed cell layer (TDSL) [12,13].
Figures 2-4 allow a comparison of different techniques that can be used for screening the suitability of different polyols and PMDI. The differences in thermal performance of various foams are significant. Yet, these figures indicate that an appropriate combination of compo-nents may provide good, long term thermal performance of the foam even when the blowing agent itself has lower thermal performance than CFC. One froth system with HCFC-22 gives the long term ther-mal performance similar to that of the CFC foam employing CFC-11 and CFC-12. 1.0 ;,;.
i
0.9e
1i! § 0.8 セ@ ; a! セ@ 0.7セ@
z 0.6 0 2.4 c 1810 core o 1810 surface 4.4 6.4 Time, years A 1811 surface o 1811 core 9.4 10.3Figure 4. Dimensionless thermal resistivity for 20oc aging of 50 mm thick specimens recalculated from slices. Foam codes and blowing agents are as follows: 1810 (CFC-11/CFC-12-reference), 1811 (HCFC-22).
Techniques to Assess the Role of Various Components 117 VUイMMMセMMMイMMM[MMMMイMMMセMMMイMMMN@ ' '
-" 55r-e:
f
45 !----
_
.
.::::::::.::::::::::::::::
---
.:::::::···
·-·-·-·-·-
-Mセ@ r-セ@ - - Surface (1 month)f
セ@ 35r ···
Core (1 month) - - - • Surface (1 0 months) - -·-·· Core (10 months) 25 I ·30 ·20 ·10---
---I 0 10 Temperature, oc
---
--.
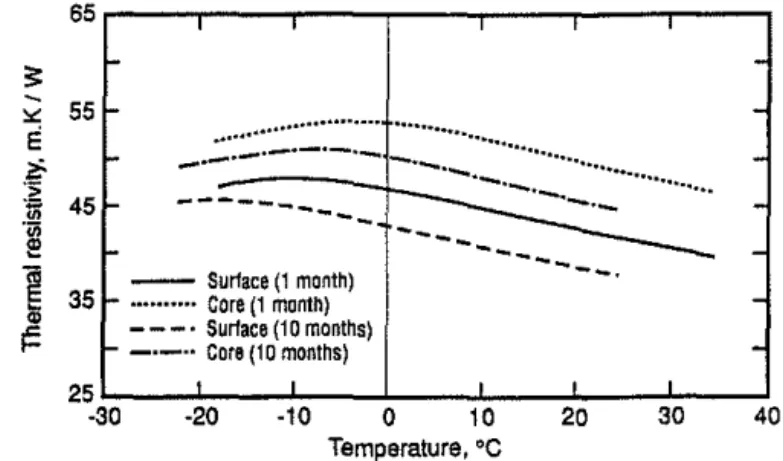
20 I 30 -40Figure 5. Thermal resistivity as a function of temperature measured after 1 month and after 10 months on core and surfaces of the CFC-11/CFC-12 reference foam.
CROSS-SECTIONAL DIFFERENCES IN THERMAL PROPERTIES
Using a thin layer technique not only gives an estimate of thermal ,performance related to a much longer period of aging than the stan· dard 25 mm thick specimens, but also permits assessing the cross· sectional variability of material properties.
Figure 4 shows dimensionless thermal resistivity for surface and core layers of two products, indicating a slight difference between each of these two locations. The same phenomenon is shown in Figure 5 which shows thermal resistivity as a function of temperature on thin, encap· sulated layers cut from the foam surfaces (codes e and h) and the middle core (codes f and g)[11,15]. Figure 5 shows thermal resistivity as a func· tion of temperature measured one and ten months after foam manufac-turing. Earlier work [11,16] has shown a drift in thermal resistivity of encapsulated polyurethane specimens over a period of a minimum of seven months, indicating that such a period was necessary to reach a final equilibrium between cell gases and polymeric matrix. These curves also show that thermal performance of surface layers (e and h) is not as good as that of middle core layers (f and g).
Figure 6 shows thermal resistivity of the foam 1811 as a function of temperature measured one and ten months after foam manufacturing. There is no condensation of the blowing agent (HCFC-22) within the ex-amined temperature range, and the r-value may be approximated as a linear function of temperature. As in the previous case, thermal resistivity as a function of temperature measured on the same spe·
118 65
:;:
t
-"
e
55t-;::.
1-·;;: ii 45 1-·;; IEt-1
35t-!!:
t-25 ·30 M, t 80MBERG ET AL.
<.... '
'
···'Core (1 month)
••••••••••••••••••••••• - - Surtace (1-·-·· Core (10 months)
month)
--·-·-·-·-·-.
セZ]Z]ZZZZZZMセMセセセセZセNセMQMセNZNセZNセィウI@
セ@
·-·-·
-MMMMM]MセMMセMセセMMMNMM⦅M⦅M⦅M⦅M⦅MMMMMM
---
セ@
-I I I I'
·20 ·10 0 10 20 30 40 Temperature,•c
Figure 6. Thermal resistivity as a function of temperature measured after 1 month and after 10 months on core and surfaces of the foam 1811 made with HCFC-22.
cimen after one and ten months are shifted. This shift relates to both gas redistribution within the encapsulated specimen of the foam and change in solubility of the BA.
Figures 7 and 8 show thermal resistivity as a function of temperature measured six months after foam manufacturing. The same polyol/ PMDI combination was used each time, but four different blowing agent combinations were used: HCFC-22/14lb for the foam coded
430-60
3: 55 ---·Core (430-90) - · - · · Surface (430-90)
"'
e
---- · Surtace(430-90) - - Core {43D-a8);;:. 50 :j; Mセ@ 45
1
40 I'= ••• ·•····•••· Surface (43o-88) ••. ::··· ·•····•••· Surface (43o-88)::
ZMセセセセZZウセZ@
[[MセセZ[[Z[[Z[[Z[[ZNNNNNNNNNNNNNNNN@
..
..._ --
--
MᄋMMMNZZセZBBᄋBBNNNZZZ@-·-
...
セァ@ -35 ·30 -20·10
010
20 30 Temperature, ocFigure 7. Thermal resistivity as a function of temperature measured after 6 months on core and surfaces of foams 430-88 (HCFC-221HCFC-14lb) and 430-90 (HCFC-22).
Techniques to Assess the Role of Various Components 119 VPセMMセMMMMセMMセMMMMセMMMMセMMセ@ ··... - - - · Surface{43o-92) ••••·.• -·-·· Surface (43D-92)
···-. ···-···
==-·
[セセセセZSLセセTI@
GᄋセMMセᄋᄋNᄋᄋᄋᄋᄋᄋᄋᄋᄋᄋᄋᄋᄋᄋᄋᄋᄋᄋᄋᄋᄋᄋᄋᄋᄋᄋ@
セ@ ··· Surtace {43D-94) ••·••···•• ·••·•·•••· Core (43o-94)...
::::.:::...
....
.
... .
...
...
__
:::::.::::-.セM
·-
···
···•··•···•·
···
--...
...
-
セMセ@ セM···
...._____
ZZZZZNZNZZMNセN@---
--;: 55
"'
e
:;,; 50 ·s: ..,
·j
45 セ@ セ@ 40"'
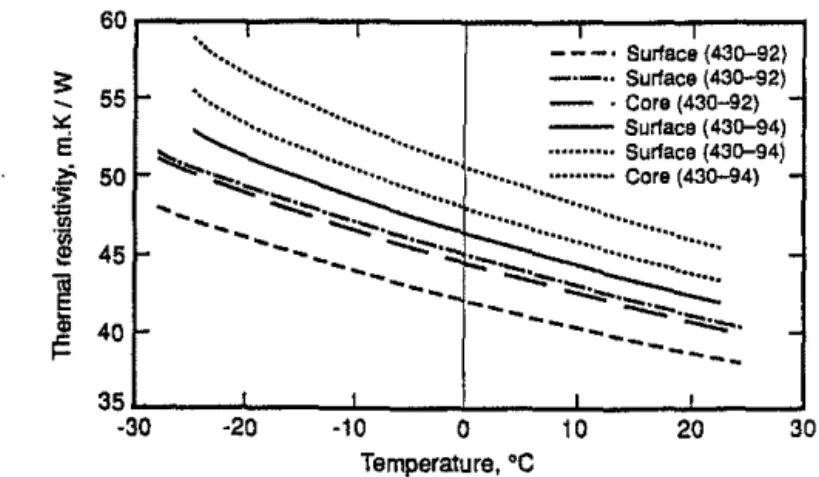
35 ·30 ·20 ·10 0 10 20 30 Temperature, ocFigure 8. Thermal resistivity as a function of temperature measured after 6 months on core and surfaces of foams 430-92 (HFC-152a) and 430-94 (HFC-134a).
88, HCFC-22 for the foam coded 430-90, HFC-134a for the foam coded 430-94 and HFC-152a for the foam coded 430-92 (see Table 3). All these foams show behavior similar to that shown in Figure 6. For foams tested in Figures 7 and 8, the surface-to-core differences are slightly
'
smaller than those in the previous case (see Figure 6).
These results show that the testing techniques developed at NRC per· mit detecting differences in thermal performance of thin layers cut from different locations which are related to the manufacturing pro· cesses for frothed (this paper), sprayed [6] or molded foams [17]. These techniques may, therefore, be used in the quality assurance for dif· ferent foam products.
EFFICIENCY OF GAS-BARRIERS IN RETARDING AGING OF RIGID FOAMS
Aging of thin-layered, faced and encapsulated specimens provided with a groove on their perimeter was examined with a view to estab-lishing an accelerated method of testing gas barrier efficiency in re-tarding the aging process. Aging rates of such specimens were com-pared with that of unfaced foam (see Figure 9). Figure 9 shows aging curves of four core layers cut from different boards and recalculated to standard thickness of product C. Figure 10 shows aging curves ob-tained on such specimens with area of 300 x 300 mm square, while Figure 11 shows results measured on 600 x 600 mm square
spec-120 M. T. BOMBERG ET AL. 55
s:
50-"'
WE"'
45·s
';l ᄋセ@ 40I
0 Specimen A 0 Specimen B 35 4 Specimen C a Specimen D 30 0.01 0.1 10 100 Tlme, yearsFigure 9. Thermal resistivity of 25 mm thick specimens without facers recalculated from s1ices. PIR product C manufactured with CFC-11.
imens. The reduction of thermal resistance became evident after 10-30 days of aging of the smaller specimens and 30-60 days of aging of the larger specimens. Since the metering area of a thermal test is 75 mm and 150 mm away from the perimeter, i.e., 3 or 6 times further than the specimen thickness, the reduction in the specimen thermal resistance seen in Figures 10 and 11 implies the presence of a strong lateral diffu-sion in the layer adjacent to the gas barrier.
60
s:
55"'
E·f
50 'fi.,
0 Specimen A !!! 45 1il 0 Speelman 8 E .A Specimen C=
40 D Specimen Dr=
35 0.1 10 100 1000 Time, daysFigure 10. Aging curves for thin-layer, encapsulated and grooved 300 x 300 mm square surface specimens of the PIR product C (CFC-11).
Techniques to Assess the Role of Various Components 121 VPイMMMMMMMMイMMMMMMセMMMMMMMMセMMMMMMセ@ ;!: 55 Specimen A
--____,_....,__,
セ@
sー・セ」セャュセ・ョセbセセセMMセセセMM
]' 50 :§e
45!
40 SUセMMMMセセMMMMセセMMMMセセMMMMセ@ 0.1 10 100 1000 11me. daysFigure 11. Aging curves for thiri-layer, encapsulated and grooved 600 X 600 mm square surface specimens of the PIR product C (CFC-11).
The measurements performed over a three year period on the control specimens (300 x 300 mm square provided with facing on both sides) are shown in Figure 12. These measurements can be compared with the results shown in Figures 10 and 11. Figure 12 shows that the gas b,arrier functioned effectively. There was practically no change in ther-mal performance of the control specimens, while there was. a very sig-nificant diffusion under gas barriers in the results shown in Figures 10 and 11.
60r---.---.---r---.---.
;!: 55"'
e
Mセ@ 50 .);·"
!il
- 45セ@
"
t=
40i
i
a Specimen A .a. Specimen B o Specimen C • Specimen 0 & Specimen E • Specimen F1
u a
•
SUセMMMMセMMMMセMMMMセMMMMセセMMセ@ 0.1 10 100 1000 10000 11me. daysFigure 12. Aging of 300 x 300 mm square standard thickness specimens of the PIR product C (CFC-11).
122 M. T. BOMBEAG ET AL.
The cause of this apparent paradox may be related to the technique used for preparing the specimens. A vacuum was applied to one side of the specimen (gas barrier) to prevent it from moving during cutting the slices. It is probable that under these circumstances the vibrations in-troduced by the band saw affected a bond between the foam and the gas barrier. Since control specimens were not cut on a vacuum table, the bond between the gas barrier and the foam was not affected; the results shown in Figure 12 indicate that the gas barrier was highly efficient in retarding the aging process. Therefore, observation of such a large difference between these two series of experiments highlights the danger of performing laboratory tests in conditions not representing those in the field. Placing a gas barrier on a vacuum table during the sample preparation appears unacceptable.
CONCLUDING REMARKS
The review of different techniques which can be used to assess the im-portance of various components in retarding aging of rigid, thermal in-sulating foams indicates that periodic testing of thermal properties performed on either completely or partially encapsulated slices may help in the quality assurance of the boardstock products. These tech-niques not only help in screening of different polyols and polyiso-cyanates to achieve best long-term performance of the foam but also may help in evaluating variations in foam properties introduced by the manufacturing process. Two evaluation techniques were applied for the selection of foam components with a view to long-term thermal per-formance (series 1 and 2). They proved to be simple, but powerful tools for screening the compatibility of foam components. The differences in thermal performance of various foams were significant. Yet, an appro-priate combination of components may provide good, long term ther-mal performance of the foam even when the blowing agent itself has lower thermal performance than the previously used CFC. In the stu-died case, one froth system with HCFC-22 gave the long term thermal performance similar to that of the CFC foam employing CFC-11 and CFC-12.
An additional advantage obtained from these measurements is the knowledge of temperature dependence of the thermal resistivity (con-ductivity). As shown for the gaseous blowing agents, such as HCFC-22, HFC-134a or HFC-152a, there is a continuous improvement of the foam thermal resistivity with reduction of the operating temperature. It in-dicates that use of some blowing agents may be more efficient in low
Techniques to Assess the Role of Various Components 123 operating temperatures than the others, a fact not forthcoming from the standard thermal testing at room temperature.
Finally, a modification of the encapsulation technique was used to de· termine efficiency of the gas barrier. These experiments were not suc-cessful, as the bond between the gas barrier and the foam showed an alarming dependence on sample preparation. Another method of sam· pie preparation or perhaps a technique based on rapidly diffusing gas with low solubility, e.g. helium, may be considered for development of gas barrier efficiency test.
ACKNOWLEDGEMENTS
The authors gratefully acknowledge technical assistance from Mr. John Lackey and Mme Nicole Normandin. Gratitude is also expressed to Jim Walter Research Corporation and Foam Enterprises Inc. for manufacturing and supplying the experimental PUR/PIR products ex-amined in this project.
REFERENCES
1. Bamberg, M. T. and M. K. Kumaran. 1989. "Report· on Sprayed Polyurethane Foam with Alternative Blowing Agents;• CFCs and the Polyurethane Industry, 2:112-128.
2. Kumaran, M. K., M. T. Bomberg, R. G. Marchand, J. A. Creazzo and
M.
R.Ascough. 1989. "A Method for Evaluating the Effect of Blowing Agent
Condensation on Sprayed Polyurethane Foams:' J. Thermal Insulation,
13:123-137.
3. Kumaran, M. K. and M. T. Bomberg. 1990. "Thermal Performance of Sprayed Polyurethane Foam Insulation with Alternative Blowing Agents", J. Thermal Insulation, 14:43-58.
4. Bomberg, M. T. and M. K. Kumaran. 1991. "Evaluation of Long!ferm Thermal Performance of Cellular Plastics Revisited;' ASTM STP 1116, pp. 123-141.
5. Schwartz, N. V. and M. T. Bamberg. 1991. "Image Analysis and Characterization of Cellular Plastics;' J. Thermal Insulation, 15:153-171. 6. Kumaran, M. K. and M. T. Romberg. 1990. "Thermal Performance of Sprayed Polyurethane Foam with Alternative Blowing Agents;' J. of Ther-mal Insulation, 14:43-58.
7. Christian, J. E., G. E. Courville, R. S. Graves, R. L. Linkous, D. L. McElroy, F. J. Weaver and D. W. Yarbrough. 1991. "Thermal Measurement ofin·Situ and Thin Specimen Aging of Experimental Polyisocanurate Roof
Insula-I·
'
I
I
I
I
I 124 M. T. BoMBEAG ET AL.tion Foamed with Alternative Blowing Agents;' ASTM STP 1116, pp. 142-166.
8. Booth, J. R. and T. S. Holstein. 1993. "Determination of Effective Diffusion Coefficients of Nitrogen in Extruded Polystyrene Foam by Gravimetric Sorption;' J. ofThermallnsulation and Building Envelope, 16(3):246-262. 9. SPI Polyurethane Division k-factor Task Force. 1988. "Rigid Polyurethane and Polyisocyanurate Foams: An Assessment of Their Insulating Proper-ties;' Polyurethanes 88, October 18-21, 1988, pp. 323-337.
10. Tsederberg, N. V. 1965. Thermal Conductivity of Gases and Liquids, The
MIT Press. ·
11. Bamberg, M. T., M. K. Kumaran, M. R. Ascough and R. G. Sylvester. 1990. "Effect of Time and Te111perature on R-Value of Rigid Polyurethane Foams;' Polyurethanes 90, Orlando, FL, October 1-3, 1990, pp. 420-431.
12. Edgecombe, F. H. 1989. "Progress in Evaluating Long-Term Thermal Re· sistance of Cellular Plastics;' J. Thermal Insulation, 13:105-123. 13. Schwartz, N. V., M. T. Bomberg and M. K. Kumaran. 1989. "Measurement
of the Rate of Gas Diffusion in Rigid Cellular Plastics;' J. Thermal Insula· tion, 13:48-61.
14. Moore, S. E. 1992. "Effect of Polymer Structure on Long-Term Aging of Rigid Polyurethane Foam;' J. of Thermal Insulation, 15:279-293. 15. Low, N. M. P. 1990. "The Characterization of Thin Layers of Cellular Plas·
tic Insulations;• J. Thermal Insulation, 13:246-262.
16. Ascough, M. R., M. T. Bomberg and M. K. Kumaran. 1991. "The Influence of Environmental Factors on Thermal Resistance of Rigid Polyurethane Foams;' Polyurethanes World Congress 1991, September 24-26, 1991, pp. 399-407.
17. Bamberg, M. T. and M. K. Kumaran. 1991. "Progress Report on Long-Term Thermal Performance ofPolyisocyanurate Boardstock Materials;' Internal Report 603.