Université de Montréal
Characterization of Glutaraldehyde-Immobilized
Chymotrypsin and an In-Situ Immobilized Enzyme Reactor
Using Capillary Electrophoresis-Based Peptide Mapping
par
Golfam Ghafourifar
Département de chimie Faculté des Arts et des Sciences
Thèse présentée à la Faculté des Études Supérieures et Postdoctorales en vue de l‘obtention du grade de Philosophiæ Doctor (Ph. D.)
en Chimie
Avril, 2015
Résumé
La digestion enzymatique des protéines est une méthode de base pour les études protéomiques ainsi que pour le séquençage en mode « bottom-up ». Les enzymes sont ajoutées soit en solution (phase homogène), soit directement sur le gel polyacrylamide selon la méthode déjà utilisée pour l’isolation de la protéine. Les enzymes protéolytiques immobilisées, c’est-à-dire insolubles, offrent plusieurs avantages tels que la réutilisation de l’enzyme, un rapport élevé d’enzyme-sur-substrat, et une intégration facile avec les systèmes fluidiques. Dans cette étude, la chymotrypsine (CT) a été immobilisée par réticulation avec le glutaraldehyde (GA), ce qui crée des particules insolubles. L’efficacité d’immobilisation, déterminée par spectrophotométrie d’absorbance, était de 96% de la masse totale de la CT ajouté. Plusieurs différentes conditions d’immobilisation (i.e., réticulation) tels que la composition/pH du tampon et la masse de CT durant la réticulation ainsi que les différentes conditions d’entreposage tels que la température, durée et humidité pour les particules GA-CT ont été évaluées par comparaison des cartes peptidiques en électrophorèse capillaire (CE) des protéines standards digérées par les particules. Les particules de GA-CT ont été utilisés pour digérer la BSA comme exemple d’une protéine repliée large qui requit une dénaturation préalable à la digestion, et pour digérer la caséine marquée avec de l’isothiocyanate de fluorescéine (FITC) comme exemple d’un substrat dérivé afin de vérifier l’activité enzymatique du GA-CT dans la présence des groupements fluorescents liés au substrat. La cartographie peptidique des digestions par les particules GA-CT a été réalisée par CE avec la détection par absorbance ultraviolet (UV) ou fluorescence induite par laser. La caséine-FITC a été, en effet, digérée par GA-CT au même degré que par la CT libre (i.e., soluble). Un microréacteur enzymatique (IMER) a été fabriqué par immobilisation de la CT dans un capillaire de silice fondu du diamètre interne de 250 µm prétraité avec du 3-aminopropyltriéthoxysilane afin de fonctionnaliser la paroi interne avec les groupements amines. Le GA a été réagit avec les groupements amine puis la CT a été immobilisée par réticulation avec le GA. Les IMERs à base de GA-CT étaient préparé à l’aide d’un système CE automatisé puis utilisé pour digérer la BSA, la myoglobine, un peptide ayant 9 résidus et un dipeptide comme exemples des substrats ayant taille large, moyenne et petite, respectivement. La comparaison des cartes peptidiques
ii
des digestats obtenues par CE-UV ou CE-spectrométrie de masse nous permettent d’étudier les conditions d’immobilisation en fonction de la composition et le pH du tampon et le temps de réaction de la réticulation. Une étude par microscopie de fluorescence, un outil utilisé pour examiner l’étendue et les endroits d’immobilisation GA-CT dans l’IMER, ont montré que l’immobilisation a eu lieu majoritairement sur la paroi et que la réticulation ne s’est étendue pas si loin au centre du capillaire qu’anticipée.
Mots-clés: Cartographie peptidique, Réticulation, Glutaraldéhyde, Chymotrypsine,
Abstract
Digesting proteins using proteolytic enzymes is a standard method in proteomic studies and bottom-up protein sequencing. Enzymes can be added in solution or gel phase depending on how the protein has been isolated. Immobilized, i.e., insoluble, proteolytic enzymes offer several advantages such as reusability of enzyme, high enzyme-to-substrate ratio, and integration with fluidic systems. In this study, we prepared glutaraldehyde-crosslinked chymotrypsin (GA-CT), which creates insoluble particles. The immobilization efficiency was determined by absorbance spectrophotometry and found to be 96% of the total amount of chymotrypsin added. Different immobilization (i.e., crosslinking) conditions such as buffer composition/pH and initial mass of CT during crosslinking as well as different storage conditions such as temperature, time and humidity for the GA-CT particles were evaluated by comparing capillary electrophoretic (CE) peptide maps of protein standards digested with the particles. The GA-CT particles were used to digest BSA as an example of a large folded protein that needs denaturation prior to digestion, and casein-fluorescein isothiocyanate (FITC) as an example of a small, labeled substrate to test enzyme activity in the presence of substrate-bound fluorescent groups. Peptide mapping of digests from GA-CT particles was achieved by CE with ultraviolet (UV) absorbance or laser induced fluorescence (LIF) detection. FITC-labeled casein was digested by GA-CT to the same extent as with free (i.e., soluble) CT. An immobilized enzyme microreactor (IMER) was fabricated by immobilizing CT inside a 250 µm i.d. fused-silica capillary tube pre-treated with 3-aminopropyltriethoxysilane to functionalize the inner walls with amine groups. Glutaraldehyde was reacted with the amine groups and then CT was immobilized by crosslinking to the GA. IMERs based on GA-CT were fabricated using an automated CE system and used to digest BSA, myoglobin, a 9-residue peptide and a dipeptide as examples of large, medium and small substrates. Digests were studied by comparing peptide maps obtained by CE coupled to either UV or mass spectrometric (MS) detection in order to evaluate immobilization conditions as a function of buffer composition/pH and reaction times. A separate study, which used fluorescence microscopy to investigate the extent and location of GA-CT immobilization in the IMER, showed that immobilization
iv
only takes place primarily near the capillary walls and that crosslinking does not extend as far into the center of the IMER as had been expected.
Keywords: Peptide mapping, Crosslinking, Glutaraldehyde, Chymotrypsin, Capillary
Table of Contents
Résumé ... i
Abstract ... iii
List of Tables ... xi
List of Figures ... xiii
List of Abbreviations and Acronyms ... xxi
Acknowledgment ... xxiv
Chapter 1. General Introduction, Literature Review and Research Objectives ... 1
1.1. Determination of Proteins ... 2
1.1.1. Sample Preparation for Structural Proteomics Studies ... 4
1.1.2. Enzymatic Digestion ... 7
1.1.3. Peptide Mapping ... 8
1.2. Enzyme Immobilization ... 11
1.2.1. Immobilized Proteases ... 11
1.2.2. Immobilization by Glutaraldehyde-Mediated Crosslinking ... 13
1.2.3. Immobilized Enzyme Reactor (IMER) ... 15
1.3. Chymotrypsin as the Protease ... 17
1.4. Research Objectives and Thesis Structure ... 18
Chapter 2. Analytical Techniques ... 18
2.1. Capillary Electrophoresis ... 19
2.1.1. Peptide Mapping by CE-UV for digests obtained by using immobilized chymotrypsin pellet ... 21
2.1.2. Peptide Mapping by CE-UV for digests obtained by using IMER ... 22
vi
2.2. Capillary Electrophoresis-ElectroSpray Ionization / Mass Spectrometry
(CE-ESI/MS) ... 22
2.3. Confocal Laser Scanning Microscope (CLSM) ... 27
Chapter 3. Capillary Electrophoretic Peptide Mapping to Probe the Immobilization/Digestion Conditions of Glutaraldehyde-crosslinked Chymotrypsin ... 29
3.1. Abstract ... 30
3.2. Introduction ... 30
3.3. Experimental ... 32
3.3.1. Reagents and Chemicals ... 32
3.3.2. Substrate Denaturation ... 33
3.3.3. Preparation of Immobilized Chymotrypsin ... 33
3.3.4. Digestion of Substrate by Immobilized Chymotrypsin ... 34
3.3.5. Effect of Digestion Time ... 34
3.3.6. Effect of Buffer Composition During Enzyme Crosslinking Reaction ... 35
3.3.7. Effect of Substrate Denaturation on Digestion ... 35
3.3.8. Reusability of the Immobilized Chymotrypsin ... 35
3.3.9. Peptide Mapping by Capillary Electrophoresis ... 36
3.4. Results and Discussion ... 36
3.4.1. The Effect of Preparation Method on Immobilized Enzyme Performance... 36
3.4.2. Effect of Digestion Time ... 40
3.4.3. Effect of Buffer Composition During the Enzyme Crosslinking Reaction ... 40
3.4.4. Reusability of Immobilized Chymotrypsin ... 43
3.5. Conclusions ... 46
3.6. Acknowledgements ... 47
3.7. Supporting Information ... 47
Chapter 4. Development of Glutaraldehyde-Crosslinked Chymotrypsin and an In Situ Immobilized Enzyme Microreactor with Peptide Mapping by Capillary Electrophoresis ... 52
4.1. Abstract ... 53
4.2. Introduction ... 53
4.3. Materials and Methods ... 55
4.3.1. Reagents and Materials ... 55
4.3.2. Protein Substrate Denaturation ... 55
4.3.3. Digestion of Substrate by Soluble Chymotrypsin ... 56
4.3.4. Preparation of GA-Crosslinked Chymotrypsin Particles ... 56
4.3.5. Digestion of Substrate by Immobilized Chymotrypsin Particles ... 57
4.3.6. CE-UV and CE-LIF Separations ... 57
4.3.7. Microreactor (IMER) Construction and Characterization ... 58
4.4. Results and Discussion ... 59
4.4.1. Immobilization Efficiency ... 59
4.4.2. Autoproteolysis of Chymotrypsin ... 61
4.4.3. Storage Conditions ... 62
4.4.4. Digestion of Fluorescently Labeled Protein using GA-Chymotrypsin Particles 63 4.4.5. IMER Digestion ... 64
4.4.6. CE-MS Characterization ... 66
viii
4.6. Acknowledgments ... 69
4.7. Supporting Information ... 70
Chapter 5. A Study of the Chymotrypsin IMER Digestion Efficiency as a Function of Substrate Size ... 71
5.1. Abstract ... 72
5.2. Introduction ... 72
5.3. Materials and Methods ... 74
5.3.1. Reagents and Materials ... 74
5.3.2. BSA Substrate Denaturation ... 75
5.3.3. Digestion of Substrate by Soluble Chymotrypsin ... 75
5.3.4. Preparation of Glutaraldehyde-Immobilized Chymotrypsin Particles ... 76
5.3.5. Digestion of Substrate by Immobilized Chymotrypsin Particles ... 76
5.3.6. In situ IMER Fabrication ... 76
5.3.7. Separation Buffers for Peptide Mapping by CE-UV ... 77
5.3.8. Digestion Using the IMERs ... 77
5.3.9. Peptide Mapping by CE-UV ... 81
5.3.10. Peptide Mapping by HPLC-MS ... 82
5.4. Results and Discussion ... 83
5.4.1. Choosing the Separation Buffer for Peptide Mapping by CE-UV ... 83
5.4.2. The Effect of Borate Buffer Concentration on CE-UV Mapping ... 84
5.4.3. Blank Digestion Using an IMER ... 85
5.4.4. IMER Digests of Substrate FH-OMe ... 86
5.4.5. IMER Digestion of WAGGDASGE ... 89
5.5. Conclusions ... 97
5.6. Supplementary Data ... 98
Chapter 6. Fluorescence microscopy imaging of an immobilized enzyme microreactor to investigate glutaraldehyde-mediated crosslinking of chymotrypsin ... 102
6.1. Abstract ... 103
6.2. Introduction ... 103
6.3. Materials and methods ... 105
6.3.1. Reagents and materials ... 105
6.3.2. In situ IMER fabrication: 3 cm × 250 µm microreactor ... 105
6.3.3. In situ IMER fabrication: 43 cm × 250 µm microreactor ... 106
6.3.4. Fluorescence microscope imaging ... 107
6.3.5. Digestion of Bovine Serum Albumin in the Microreactor ... 107
6.4. Results and discussion ... 107
6.4.1. Direct monitoring of enzyme immobilization ... 108
6.4.2. Indirect monitoring of enzyme immobilization by fluorescence imaging ... 109
6.4.3. Digestion of bovine serum albumin in the microreactor ... 115
6.5. Conclusion... 116
6.6. Acknowledgements ... 117
Chapter 7. Conclusion and Perspectives on Future Work ... 118
References ... 123
Appendix A. The Effect of Urea and Calcium Chloride on Denaturation of the Protein HbA ... 140
Appendix B. Determining Immobilization Efficiency by UV-Vis Absorbance Spectroscopy ... 146
x
B.1 Analysis of a Mixture ... 147 B.2 Fourth Derivative Method ... 149
List of Tables
Table 3.1. The pooled washes from the full-scale enzyme immobilization procedure were
collected and the solutions concentrated 10 times by evaporation under centrifuge. The concentrates were injected to the CE and the chymotrypsin concentration was calculated based on a calibration curve. ... 39
Table 3.2. The effect of crosslinking buffer composition on immobilized enzyme
reproducibility and activity (batch-to-batch) evaluated by peptide mapping of BSA (22.5 µM) at an apparent E:S ratio of 8:1 (mol:mol). Separations were carried out as in Figure 3.1. ... 43
Table S3.1. The effect of crosslinking buffer composition on GA-crosslinked chymotrypsin
activity evaluated by comparing digests of BSA (22.5 µM) at an E:S ratio of 8:1 (mol:mol). Peptide mapping was carried out by CE at +15 kV (75 µm i.d. capillary) in 50 mM sodium phosphate buffer, pH 2.5, with detection at 200 nm. For each buffer composition, three batches of crosslinked enzyme were made and digestion was carried out with aliquots of the same BSA solution (denatured, reduced and alkylated).. ... 51
Table 4.1. Experimentally identified residues from horse myoglobin digested by
chymotrypsin IMER and identified by CE-MS. ... 67
Table 5.1. Methods used to pass substrate FH-OMe through an IMER for digestion using
the programmable CE system. ... 79
Table 5.2. Methods used to pass substrate WAGGDASGE through the IMER for digestion
using the programmable CE system. ... 80
Table 5.3. Methods used to pass substrate BSA (denatured) through the IMER for digestion
using the programmable CE system. ... 81
Table 5.4. The peak resolutions calculated between two neighbouring peaks as a function
of borate buffer concentration (pH 8.6), using BSA digests from IMER #5 digested by Method 5b as the sample. The separations were performed by CE-UV. ... 84
xii
Table S5.1. Experimentally identified peptides by HPLC-MS from BSA digested by the
GA-crosslinked chymotrypsin IMER #4 using Method 4. ... 99
Table S5.2. Experimentally identified peptides by HPLC-MS from BSA digested by the
GA-crosslinked chymotrypsin IMER #5 using Method 5b. ... 100
Table S5.3. Experimentally identified peptides by HPLC-MS from BSA digested by the
GA-crosslinked chymotrypsin IMER #6 using Method 6. ... 101
Table A.1. Identified peptides by CE-UV from HbA digested by GA-crosslinked
List of Figures
Figure 1.1. General schematic for protein extraction, enrichment and separation. ... 5 Figure 1.2. Tertiary structure of the native protein, the yellow sites indicate the presence of
F, W or Y in BSA crystal
(http://www.ncbi.nlm.nih.gov/Structure/MMDB/mmdb.shtml). ... 6
Figure 1.3. The workflow of in-gel protein digestion including gel band excision,
reduction, alkylation and finally enzymatic digestion. ... 7
Figure 1.4. General workflow for bottom-up and top-down proteomics [19]. ... 9 Figure 1.5. One of the common crosslinking reactions between glutaraldehyde and an
enzyme, were Enz-N represents a lysine ε-amino group of the enzyme[50]. ... 15
Figure 2.1. Schematic of capillary electrophoresis instrumentation. ... 21 Figure 2.2. A) Schematic of CE coupled to an ESI-MS via the interface. B) A photo of the
ESI-MS flow splitter used to connect the CE capillary outlet to the MSD for peptide mapping. ... 24
Figure 2.3. A) Schematic presentation of CE connected to ESI-MS showing analyte from
CE, sheath flow, and drying gas going to nebulizer and then MS [137]. B) ESI nebulizer (left panel) showing the outlet of the CE capillary placed slightly beyond the end of the nebulizer tip (right panel). ... 26
Figure 2.4. A schematic presentation of confocal laser scanning microscope (Leica TCS
SP5). ... 28
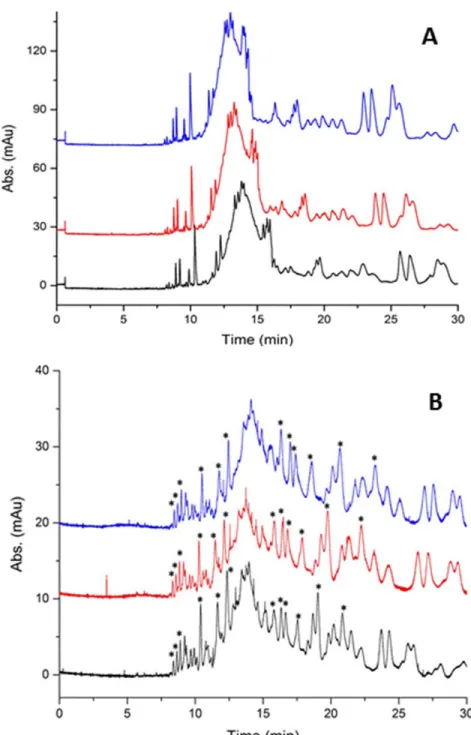
Figure 3.1. Peptide maps showing the effect of the preparation scale of immobilized
enzyme on its overall performance. (A) CE-UV peptide maps of BSA (9 µM) digested by GA-crosslinked chymotrypsin prepared using the full-scale procedure and with an apparent E:S ratio of 26:1 (mol:mol); (B) CE-UV peptide maps of BSA (22.5 µM) digested by GA-crosslinked chymotrypsin prepared using the small-scale procedure and with an apparent E:S ratio of 8:1 (mol:mol). In both cases, digestion was performed for 4 h at 37 °C. Separations were performed at +15 kV in 50 mM sodium
xiv
phosphate buffer, pH 2.5, with detection at 200 nm. Triplicate injections into the CE are shown for both preparation methods. Peaks with asterisks were used to calculate area reproducibility. ... 38
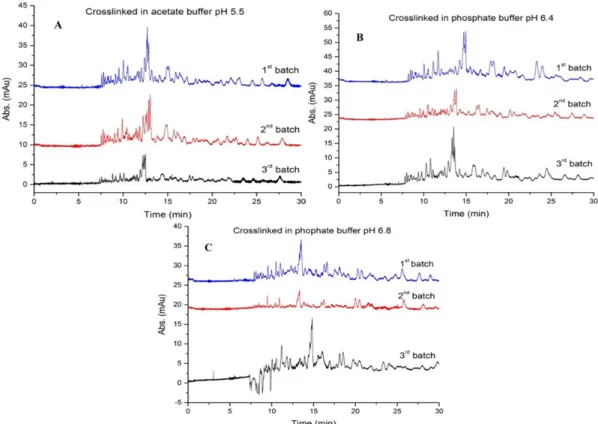
Figure 3.2. Graphs of peptide peaks in BSA digests showing batch-to-batch (n = 3)
reproducibility of immobilized chymotrypsin for three different buffers tested during enzyme crosslinking: (A) acetate buffer, pH 5.5; (B) phosphate buffer, pH 6.4; (C) phosphate buffer, pH 6.8. All 9 batches of immobilized chymotrypsin were prepared by the small-scale procedure. Nine aliquots of the same substrate (BSA, 22.5 µM) were used. The E:S ratio was 8:1 (mol:mol) and digestions were performed for 4 h at 37 °C then peptideseparations were carried out as in Figure 3.1. ... 42
Figure 3.3. Peptide maps showing immobilized enzyme reusability for digestion of BSA
(22.5 µM) by a single batch of GA-crosslinked chymotrypsin prepared using the small-scale procedure. The enzyme pellet was washed 4 times: 2 × 200 µL each with water and crosslinking buffer. The apparent E:S ratio was 1:1 (mol:mol) during both digestions carried out for 4 h at 37 °C. Separations were carried out as in Figure 3.1. 44
Figure 3.4. Comparison of immobilized enzyme digestion efficiency for denatured versus
native substrate. (A) Electropherogram of denatured BSA; (B) peptide map of digested denatured BSA (22.5 µM); (C) electropherogram of native BSA; (D) peptide map of digested native BSA (22.5 µM). Digestions were performed for 4 h at 37 ⁰C using the small-scale preparation of GA-crosslinked chymotrypsin at an apparent E:S ratio of 1:1 (mol:mol). Separations were carried out as in Figure 3.1. ... 46
Figure S3.1. Electropherograms showing the residual, unreacted chymotrypsin removed
after each stage of washing the immobilized enzyme aggregated particle that was made using the full-scale procedure. Each pooled wash solution was concentrated 10 fold using a Speed Vac before injection into the CE for separation. Separations were carried out by capillary electrophoresis at +15 kV (75 µm i.d. × 43 cm capillary) in 50 mM sodium phosphate buffer, pH 2.5, with detection at 200 nm. ... 48
Figure S3.2. Peptide maps showing the effect of digestion time for BSA (22.5 µM)
procedure and with an apparent E:S ratio of 1:1 (mol:mol). Separations by CE-UV were carried out as described in Figure S3.1. ... 48
Figure S3.3. Peptide map of BSA (9 µM) digested for 1 h at 37 °C by GA-crosslinked
chymotrypsin prepared using the full-scale procedure and with an apparent E:S ratio of 26:1 (mol:mol). Separations by CE-UV were carried out as described in Figure S3.1. Triplicate injections of a single digest into the CE are shown. ... 49
Figure S3.4. Peptide maps for BSA digestions showing batch-to-batch (n = 3)
reproducibility of immobilized chymotrypsin prepared using three different buffers during enzyme crosslinking: (A) acetate buffer, pH 5.5; (B) phosphate buffer, pH 6.4; (C) phosphate buffer, pH 6.8. All 9 batches of immobilized chymotrypsin were prepared following the small-scale procedure. Nine aliquots of the same substrate (BSA, 22.5 µM) were used. The apparent E:S ratio was 8:1 (mol:mol) and digestions were performed for 4 h at 37 °C. Separations by CE-UV were carried out as in Figure. S3.1. ... 49
Figure S3.5. Carry-over study for assessing GA-crosslinked chymotrypsin reusability using
substrate blanks as controls for either the first use or the second use of enzyme. (A) GA-crosslinked chymotrypsin was used to “digest” a blank solution containing all denaturation reagents except BSA, then the crosslinked particle was washed, then reused with denatured BSA (22.5 µM) as substrate for the second digestion. (B) GA-crosslinked chymotrypsin was used to digest denatured BSA (22.5 µM) as substrate in the first use of the enzyme particle, followed by the same washing procedure as above, then reused with the blank substrate solution “digested” in the second use of enzyme. The immobilized chymotrypsin for both batches (A and B) was prepared using the small-scale procedure. All digestions were performed at 37 ⁰C for 4 h and the E:S ratio for BSA was 1:1 (mol:mol). Separations (peptide mapping) by CE-UV were carried out as in Figure S3.1. ... 50
Figure 4.1. UV-Vis absorbance spectra of chymotrypsin (12 μM) and glutaraldehyde
xvi
Figure 4.2. CE-UV peptide maps showing autoproteolysis of soluble chymotrypsin (A) and
GA-crosslinked (immobilized) chymotrypsin (B), both incubated at 37 °C for 24 h. Milli-Q water as a substrate was subjected to the denaturation conditions described in the text. Separations were performed at +15 kV using 50 mM phosphate buffer, pH 2.5. The concentration of chymotrypsin was 0.12 mM in both experiments. ... 62
Figure 4.3. CE-UV peptide maps of BSA (2 mg/mL) showing the effect of different
short-term storage conditions on immobilized enzyme activity where the GA-chymotrypsin particles were stored either wet for 24 h at the indicated temperatures (panel A), then used to digest three aliquots of denatured BSA, or stored dry for 24 h at the indicated temperatures (panel B), then used to digest three more aliquots of denatured BSA. For both wet and dry storage conditions, the enzyme:substrate ratio was 20:1 (mol:mol), and digestion was for 24 h at 37 °C. Separation conditions were the same as in Figure 5.2. ... 63
Figure 4.4. CE-LIF peptide maps of FITC-casein substrate (400 nM) digested for 4 h at 37
°C by GA-crosslinked chymotrypsin (A) and soluble chymotrypsin solution (B). The separation was carried out at +20 kV, in 50 mM phosphate buffer, pH 7.0. The E:S ratio was 30:1 (mol:mol). ... 64
Figure 4.5. Stereomicroscope images taken from the window section of the IMER capillary
after passing the 3-APTES through (image A), and then after passing the glutaraldehyde and chymotrypsin through (image B), leading to GA-chymotrypsin immobilized inside the IMER. ... 65
Figure 4.6. Primary sequence of myoglobin with slashes indicating the expected
(theoretical) chymotryptic cleavage sites and with CE-MS identified peptides underlined to visualize the sequence coverage and missed cleavages. ... 66
Figure S4.1. CE-LIF peptide map of FITC-casein substrate (1 µM) before digestion. The
separation was carried out at +20 kV, in 50 mM phosphate buffer, pH 7.0. All other separation and detection conditions were the same as in section 4.3.6. ... 70
Figure S4.2. CE-UV peptide map of undenatured myoglobin (2 mg/ml) digested using
10:1 (mol:mol). The separation was carried out at +15 kV in 50 mM phosphate buffer, pH 6.4 (baseline noise was high at the typical separation pH of 2.5). All other separation conditions were the same as in section 4.2.6. ... 70
Figure 5.1. Blank digestion (blue trace) using water passed through the IMER for 1 h at
50 mbar pressure. The blank digest spiked with 80 µM FH-OMe (red trace). CE-UV separations were performed at +15 kV using 50 mM borate buffer, pH 8.6, at 25 °C in an uncoated fused silica capillary (43 cm total length, 75 µm I.D.) with detection at 200 nm. ... 85
Figure 5.2. CE-UV peptide map FH-OMe (1.6 mM) digested by IMER #1 using Method 1
(blue electropherogram). The digest solution was spiked with phenylalanine solution (2 mM) in order to determine the Phe peak (red electropherogram). Separation conditions are the same as in Figure 5.1. ... 86
Figure 5.3. Calibration curve (log-log plot) for different concentrations of Phe standard
injected the CE. The average area was measured for three injections. ... 87
Figure 5.4. CE-UV map of the peptides collected by passing FH-Ome through IMER #2
using Method 2a (A) and Method 2b (B). The separation conditions were the same as in Figure 5.1 ... 89
Figure 5.5. CE-UV peptide maps for the nonapeptide substrate WAGGDASGE (1.3 mM)
digested by IMER #3 using Method 3a. Separation conditions for CE-UVwere the same as those given in Figure 5.1. The blue trace shows the electropherogram of collected digest and the red trace is the same sample spiked with 5 mM Trp standard. ... 90
Figure 5.6. Calibration curve of standard Trp at 5 concentrations, each injected three times
and the average area plotted with error bars for each concentration. Analyses were done by CE-UV using the separation conditions as in Fig. 5.1 ... 91
Figure 5.7. CE-UV peptide maps for substrate WAGGDASGE (0.21 mM) digested by
xviii
ratio (blue trace). The red trace is the digest sample spiked with 5 mM Trp standard. Separations were carried as in Figure 5.1. ... 92
Figure 5.8. HPLC-MS peptide map (total ion chromatogram) for denatured BSA
(0.12 mM) digested by the chymotrypsin IMER using Method 4 with IMER #4 (see Table 5.3) for a total substrate digestion/residence time of 32 min. Analysis conditions are given in the experimental section. ... 93
Figure 5.9. CE-UV peptide map for denatured BSA (0.12 mM) digested by chymotrypsin
IMER #4 using Method 4 for a total substrate digestion/residence time of 32 min. The separation conditions were the same as in Figure 5.1. The insert represents the zoomed in electropherogram. ... 94
Figure 5.10. CE-UV peptide map for denatured BSA (0.12 mM) passed through IMER #6
using digestion Method 6 (see Table 5.3) for a total substrate digestion/residence time of 61 min. The separation conditions were the same as in Figure 5.1. The insert represents the zoomed in electropherogram. ... 96
Figure 5.11. HPLC-MS peptide map (total ion chromatogram) of denatured BSA (0.12
mM) passed through IMER #6 using Method 6 (see Table 5.3) for a total substrate digestion/residence time of 61 min. The separated conditions for HPLC-MS are given in the experimental section. ... 96
Figure 6.1. Stereomicroscope images taken from the capillary window before and after
each step of enzyme microreactor fabrication. All images were taken in ×4 and ×10 magnification. ... 109
Figure 6.2. An example of two 3 cm-long microreactor capillaries (intact) glued to a
microscope slide with nail polish in preparation for imaging by confocal laser fluorescence microscopy. Both microreactors were functionalized with 3-aminopropyl-triethoxysilane, activated with glutaraldehyde, crosslinked with chymotrypsin and then treated with fluorescein isothiocyanate. ... 110
Figure 6.3. Fluorescence (left side) and transmitted light (right side) images of five small
(A) partially prepared microreactor with only aminopropyl functionalization before treatment with fluorescent probe; (B) partially prepared microreactor with aminopropyl functionalization and glutaraldehyde activation, then treatment with fluorescent probe; (C) full microreactor prepared with crosslinked chymotrypsin then treated with fluorescent probe; (D) same as (C) but no fluorescent probe passed through (i.e., the blank); (E) cross-section of a broken capillary prepared as in (C). 112
Figure 6.4. Images obtained from continuously moving the confocal laser scanning
microscope from the top of the capillary to the middle along the optical axis, i.e., the z direction as in panel (A), showing its cross-section for a complete 3-cm microreactor with glutaraldehyde-crosslinked chymotrypsin, treated with fluorescein isothiocyanate. (B) Section of microreactor imaged to obtain screen shots #1 through 8 (lower panels), which span a total depth or vertical distance imaged of 103 µm. ... 113
Figure 6.5. Fluorescence microscope imaging at different lengths along the capillary of a
complete 43-cm microreactor with glutaraldehyde-crosslinked chymotrypsin applied in three layers and treated with fluorescein isothiocyanate then left at room temperature for 24 h. Windows were burned at 2, 7, 16 and 26 cm from the inlet before adding microreactor fabrication reagents. ... 115
Figure 6.6. Total ion chromatogram of the digest of BSA collected after digestion for 3.2
min at 37 °C of the substrate in a 43-cm long glutaraldehyde-crosslinked chymotrypsin microreactor. The separation was performed by ultra-performance liquid chromatography coupled to a quadrupole-time-of-flight mass spectrometer and using a C18 column and gradient elution with water and acetonitrile (both with 0.1% formic acid) at a flow rate of 400 µL/min. The injection volume was 3 µL. All other details are in the experimental section. ... 116
Figure 7.1. Proposed protein characterization system with coupling the IMER to CE-UV or
CE-LIF to separate the peptides and finally the MS (or MS/MS) to identify and sequence them. ... 122
Figure A.1. UV absorption spectra for different amino acids (pH 5) from 185 to 230 nm.
xx
Figure A.2. Spectra obtained from choosing some peaks on denatured and digested HbA
using immobilized chymotrypsin electropherogram. ... 143
Figure A.3. A blank solution of denatured protein containing all denaturation chemicals
except the protein substrate. The amount of protein was replaced with water. An enzyme, (A. free chymotrypsin and B. free trypsin) was separately added, to reach an E:S of 1:25 as if there was any protein. The digestion was carried out at 37 ⁰C for 4 hours. ... 144
Figure A.4. A blank solution of denatured protein containing all denaturation chemicals
except the protein substrate and urea. The urea and protein were replaced with water. An enzyme, (A. free chymotrypsin and B. free trypsin) was separately added, to reach an E:S of 1:25 as if there was any protein. The digestion was carried out at 37 ⁰C for 4 hours. ... 145
Figure B.1. Drawing the graph using Equation B.5 allows calculating the concentration of
chymotrypsin based on the intersect value... 148
Figure B.2. Measuring absorption of supernatant and standard solution of chymotrypsin
and glutaraldehyde at four different wavelengths, 265, 268, 271, and 275 nm and drawing the graph using Equation B.5. ... 149
List of Abbreviations and Acronyms
3-APTES (3-aminopropyl)-triethoxysilane
API-ES Atmospheric pressure electrospray ionization BAEE N-α-benzoyl-L-arginine ethyl ester
B-Arg N-α-benzoyl-L-arginine BGE Background electrolyte BSA Bovine serum albumin CE Capillary electrophoresis CGE Capillary gel electrophoresis CIEF Capillary isoelectric focusing CITP Capillary isotachophoresis CLCE Crosslinked enzyme crystal CLEA Crosslinked enzyme aggregates CPG-Trypsin Controlled pore glass-Trypsin CSLM Confocal laser scanning microscope CT Chymotrypsin
CZE Capillary zone electrophoresis DAD Diode array detector
DPSS Diode-pumped solid state
DTT Dithiothreitol
EOF Electroosmotic flow F Phenylalanine (Phe) f.s. Fused silica capillary
xxii
FITC Fluorescein isothiocyanate
FRQNT Fonds de recherche du Québec – Nature et technologies GA Glutaraldehyde
GA-CT Glutaraldehyde crosslinked chymotrypsin
H Histidine (His)
HPLC High performed liquid chromatography ID Inner diameter
IMER Immobilized enzyme reactor LC Liquid chromatography
Ld Total length to capillary detector
LIF Laser induced fluorescence Lt Total length
MS Mass spectrometry
NCBI National Center for Biotechnology Information
NSERC Natural Sciences and Engineering Research Council of Canada OD Outer diameter
Phe Phenylalanine
PMT Photomultiplier tube RSD Relative standard deviation SDS Sodium dodecyl sulfate
SDS-PAGE Sodium dodecyl sulphate- Polyacrylamide gel electrophoresis SIM Single ion monitoring
TPCK-Trypsin Tosyl phenylalanyl chloromethyl ketone-Trypsin TRIS- HCl Trizma hydrochloride
Trp Tryptophan
Tyr Tyrosine
W Tryptophan (Trp)
Y Tyrosine (Tyr)
xxiv
Count what is countable, measure what is measurable, and what is not measurable, make measurable.
Acknowledgment
First, I would like to express my deepest gratitude to my research supervisor, Professor Karen C. Waldron, for being a tremendous mentor. I am thrilled and honored to have been working with her.
I would like to thank the past and present members of Prof. Waldron‘s Group; Fatima Farhat, Georgiana Roman, Shao Ming Gan, Denis Santiagos, Navneet Kaur, Fatma Elshalae, Waleska Bento, and the intern students, especially Sami Khedri, Antoine Fleitz and Brian Fleury. I would like to also thank Prof. Dominic Rochefort and his research group members; Yufen Zhang, Carlos A. Castro Ruiz, Marco Polo Guerrero, Mathieu Hébert, Wenmu Li, John C. Forgie, Arash Atashi, Han Jin Xie, Bruno Gélinas, Soumia El Khakani, and Imane Benrazek. Thanks to their support, I was able to achieve my research goals.
I would like to thank Dr. Alexandra Fürtös and Marie-Christine Tang of the Mass Spectrometry Lab at UdM, Prof. Jean-François Masson for kindly letting us use his spectrophotometer and stereomicroscope, and Prof. Kevin Wilkinson and Elena Nadezhina for kindly letting us use their confocal Laser Scanning Microscope and for help in using it for the fluorescence experiments. I am sincerely grateful to my committee members, Drs Rochefort, Wilkinson and Donkor, for their helpful suggestions and corrections to improve this thesis.
I would like to thank the Natural Sciences and Engineering Research Council of Canada (NSERC) and the Fonds de recherché du Québec—Nature et technologies (FRQNT) for financial support and the University of Montréal Chemistry Department for stipend assistance.
And last but not least, I would like to thank my parents who always encouraged me to follow my dreams, even if it means that I could not be there for them when they needed me the most. And my brothers, Shahram, whom I have counted on always, and Pedram, who opened my eyes and heart to the world of science and has been my role model all the time. And finally, my husband, Pooriya, who has accompanied me through the whole journey and given me his invaluable unwavering support through all the ups and downs.
Chapter 1. General Introduction, Literature Review and Research
Objectives
1.1. Determination of Proteins
The human body is made of billions of living cells, each containing a vast number of biomolecules. Knowing the composition of cells, tissues and biological fluids plays an important role in state-of-health studies. Abnormalities in cellular functions can cause different responses, usually a disease state [1, 2]. Biochemical studies have provided much information about diseases and biochemical markers such as proteins are used as indicators for diagnosis [1-3]. While DNA is considered the blueprint of life, proteins can be considered as its tools. To study proteins’ functions, it is important to understand their structure, composition and interactions. The field of research aimed to study proteins emerged in 1994 and Wilkins named it “proteomics” [4]. The word proteomics is based on the philosophy of the previously introduced terms “genomics” and “genome” describing the sets of genes in an organism, where the term “omics” indicates the overall understanding of living cells [5, 6]. Proteomics studies include protein separation, identification, quantification and sequence analysis, and provide a means for understanding and mapping protein function in cells. Additionally, proteomics studies have provided opportunities for introducing new medicins. While many earlier medicines are small non-protein molecules, several new drugs have been derived from proteins in last two decades. Proteomic studies have helped in reconstituting endogenous proteins such as insulin, growth hormones, blood clotting factors and reproductive hormones as medicines with pivotal impact in the treatment of many diseases [7]. The proteome of a cell can show large variations that depend on cellular and environmental conditions. The proteome has a dynamic nature because of many molecular interactions and post-translational modifications. The number of modified and unmodified proteins in a cell is higher than the number of genes that code for them. Additionally, many of these proteins are at low abundance, which makes proteomic analysis a challenge. Such a complex sample requires very robust separation techniques prior to sequence analysis or quantification as well as highly sensitivity detectors.
The ultimate goal of analytical methods used in proteomics is to identify and quantify all individual proteins in a cell. Finding a single method is challenging, however a combination of sequential methods can provide high resolution analysis for a complex
3
protein mixture. Mass spectrometry (MS) and multidimensional liquid chromatography (LC) are the two dominant analytical separation techniques used in structural proteomics studies [8]. A high quality separation is essential for protein identification as T. Rabilloud, a leader in the field of protein separation, emphasized: “Because of the complexity of biological samples, it is absolutely necessary to separate (and sometimes quantify) the analytes prior to their measurement with mass spectrometry” [9].
Proteins are made of linear chains of amino acids. These amino acids are linked together by a peptidic bond between the amino group of one amino acid and the α-carboxylate group of another. Proteins have four levels of structure, namely: primary, secondary, tertiary and quaternary. The specific number and sequence of amino acids in a linear polypeptide is called the primary structure. Analytical separations of polypeptides by techniques such as LC and MS are usually based on the primary amino acid sequence.
A protein’s secondary structure is the local structure of neighboring amino acids. Once the primary structure is formed, the single chain can twist into an α-helix, or lie alongside itself and form a β-pleated sheet. These structural conformations are called secondary structure. All proteins are defined first by their primary structure and then secondary structure. Larger proteins such as myoglobin or bovine serium albumin (BSA) can have a tertiary structures and quaternary structures.
Tertiary structure refers to the three dimensional shape formed when the peptide chain curls and folds. Some forces such as covalent disulfide bonds between two cysteines, electrostatic (ionic) interactions mostly between acidic and basic side chains, hydrogen bonds, van der Waals forces, and hydrophobic side chains pushed away from water create and hold the tertiary structure. It is this structure that gives a protein its unique function [10]. Not all proteins have quaternary structure. Quaternary structures exist only for proteins containing more than one polypeptide chain bonded to the others in the same protein via non-covalent interactions.
Identifying and quantifying a large protein can be quite challenging. One way to study large proteins is to cleave them into smaller segments called polypeptide chains. This is frequently accomplished by enzymatic digestion. Enzymes are incredibly important
biological catalysts exerting the ability to cut proteins by specific recognition of certain amino acids in the primary structure. An enzyme catalyzes a single reaction or class of reactions with its protein substrates, a property known as enzyme specificity. For example, chymotrypsin cleaves peptide bonds primarily on the carboxy-terminal side of the amino acid residues phenylalanine, tryptophan and tyrosine in a protein. These amino acids all contain an aromatic group, which makes chymotrypsin specific for this class of molecules. Enzymes are very specific and a powerful means of cleaving proteins into smaller polypeptides to allow analysis. However, enzymes are sometimes not able to function if the protein substrate cannot reach the enzyme’s active site. When a protein is large and highly folded, the enzyme has very limited access to the internal amino acid residues and therefore it will have limited cleavage sites accessible. This affects the amount of polypeptide fragments that can be created and may affect the analytical methods for protein identification. In order to increase the extent of enzymatic digestion for large or heaviliy folded proteins, the protein can be unfolded, i.e., the proteins lose their tertiary structure. This can be achived by denaturing the protein [10], generally by heat or use of chemical reactions. At high temperatures, the energy of heat can overcome the hydrophobic interactions that hold a protein together and cause the protein to partially unfold; however, this is a reversible process and the protein may refold at lower temperature. Chemical chaotropic reagents such as urea [11] can break the strong hydrogen bonds within a protein’s secondary and tertiary structure and reducing agents such as dithiothreitol can break the intramolecular disulphide bonds between two cysteines allowing the protein to be unfolded.
1.1.1. Sample Preparation for Structural Proteomics Studies
Proteins are usually contained within intracelleular strucutres inside a cell. Often cell wall disruption is required before proteins can be effectively solubilized and extracted. Various chemical and physical techniques can be used to destroy the cell wall [12, 13]. The next step involves protein solubilisation and extraction. This is often aided by surfactants such as sodium dodecyl sulfate (SDS). Due to the wide range of proteins and interfering
5
contaminants that SDS solubilisation can produce, protein separation at this point is imperative. Protein enrichment during separation is the next step, which increases the concentration of the proteins of interest and decreases the concentration of interfering compounds. Proteins treated with SDS are usually fractionated either by two dimensional polyacrylamide gel electrophoresis (2D-SDS-PAGE), which separates proteins based on their isoelectric point (pI) and molecular mass, or by chromatographic methods such as LC, depending on the sample complexity (Figure 1.1) [14]. Isolation (fractionation) is usually followed by protein digestion using proteolytic enzymes. The resulting polypeptides are then separated by LC methods with higher resolution than those used for proteins, or by MS or capillary electrophoresis (CE) because analysis of peptides yields higher resolution and more accurate identification than analysing the intact proteins.
Since the early days of biotechnology, some proteins have been known to be difficult to digest due to their tight folding. As mentioned above, in order to conduct proteomic studies on large proteins, digestion by using denaturation is usually necessary. For example, Figure 1.2 shows the undenatured (folded) native tertiary structure of bovine serium albumine (BSA) with the locations of Phe (F), Tyr (Y) and Trp (W) highlighted; the amino acid residues that should be cleaved by using chymotrypsin (Figure 1.2). However, due to the folded structure of BSA these sites are not readily accessible for cleavage, which makes denaturation a critical step in protein analysis of BSA [15].
Figure 1.2. Tertiary structure of the native protein, the yellow sites indicate the presence of
F, W or Y in BSA crystal (http://www.ncbi.nlm.nih.gov/Structure/MMDB/mmdb.shtml).
Although fewer sample preparation steps are needed for thermal denaturation, this method can lead to protein aggregation or renaturation upon cooling. The mechanisms of protein aggregation are not fully understood, but it is known that protein aggregation causes insolubility of proteins [16]. On the other hand, chemical denaturation is commonly used as an initial step for digesting large proteins. It involves unfolding with urea, reduction of disulfide bonds and then alkylation of the cysteine –SH groups to prevent reformation of disulfide bridges. In the present study, for most experiments, BSA was chemically denatured in this way prior to digestion by chymotrypsin. Undenatured BSA was also digested using this enzyme in a comparative way to study the effect of denaturation.
7
1.1.2. Enzymatic Digestion
Proteomic studies typically proceed by one of two types of digestion: gel” or “in-solution”. The in-solution digestion is used for proteins fractionated by LC, with collected fractions redissolved in buffer and then enzyme added to the solution in order to digest the protein substrates. The in-gel digestion is for proteins fractionated by gel electrophoresis. The isolated protein is embedded in a gel matrix, already extracted from the whole gel, and the enzyme solution is added to the slice of the gel. In-gel digestion offers the benefit of removal of low molecular weight impurities [17]. It normally includes destaining, reduction, and alkylation of –SH groups, enzymatic cleavage of protein, peptide extraction from the gel, and finally analysis by MS or LC-MS, including sequencing by tandem MS [14].
Figure 1.3. The workflow of in-gel protein digestion including gel band excision,
reduction, alkylation and finally enzymatic digestion.
Proteolytic enzymes can undergo autoproteolysis, which is self-digestion. Autoproteolysis leads to interfering background peptides during identification and quantification. In both in-solution and in-gel digestions, the enzyme-to-substrate ratio must be low to avoid having autoproteolysis products detected as they are interfering background peptides. Since enzymes are catalysts and not consumed in the substrate digestion, using low amounts of enzymes typically suffice in these reactions. However, such enzyme reactions are slow, as the reaction rate correlates positively with the amount of the enzyme used. In-gel digestions are often carried out for 18-24 h (“over night”) to allow complete
digestion. An alternative approach is to use a larger amount of enzyme for faster enzymatic reaction, or turnover. This is achieved by immobilizing enzyme, which can greatly reduce autoproteolysis and thus the nuisance of interfering background peptides. There is a limitation to increasing the enzyme concentration that depends on the turnover number of the enzyme. This is further described below under Section 1.2.
Various proteolytic enzymes are used for protein digestion, including trypsin, chymotrypsin and pepsin. Trypsin is one of the most commonly used enzymes for this purpose. It cleaves peptide bonds at the C-terminal side of Lys and Arg residues with very high selectivity, producing a modest number of polypeptides of small and medium length which are easily separated by most analytical separation techniques. The separation of such peptides is called “peptide mapping” of the parent protein and is described further in the next section. Traditional enzymatic digestion in solution or in gel can be time consuming because of the low concentration of enzyme [14], a drawback that is addressed further under Section 1.2.
1.1.3. Peptide Mapping
Proteomics analysis can be performed in either “bottom-up” (also called shotgun), or “top-down” mode (Figure 1.4). In the latter mode, protein fragmentation is not achieved by using enzymes; it takes place in a mass spectrometer due to specific collisionally induced dissociation. The “bottom-up” approach involves digestion of proteins using a proteolytic enzyme that cleaves at well-defined sites to create a peptide mixture. For both modes, proteins from biological samples are extracted then fractionated by gel electrophoresis or LC (Figure 1.1) because of the complexity of the sample [18].
9
In the “bottom-up” approach to a proteomics study, the sample preparation usually includes proteolysis of proteins into peptides (protein digestion) by using an enzyme leading to a more effective analysis because peptides are less complex than proteins and easier to separate by analytical techniques. Every enzyme cleaves only specific peptide bonds according to the amino acid residue. Therefore, the peptides resulting from the action of a known enzyme on each given protein are easier to identify using protein databases (e.g., National Center for Biotechnology Information (NCBI) protein resources or UniProtKB/Swiss- Prot) if mass spectrometric detection is used and thus the exact masses of the peptides are known. This is referred to as peptide mass mapping and can oftern be carried out without the need of chromatography techniques, for example by matrix assisted laser desorption/ionisation-time of flight mass spectrometry (MALDI-TOF MS). Additionally, the peptides can be sequenced if an MS/MS (tandem MS) analyser is used, which will fragment each parent peptide (precursor) separated first in the LC or CE “map” and/or the first analyser of the spectrometer. This reveals the amino acid sequence of the peptides and provides a very high confidence in protein identification using comparison with genomic databases. It also provides primary sequence information for newly discovered proteins and is used in determining post-translational modifications (PTMs) of proteins.
Peptide mapping has also been conducted by CE, a complementary technique to HPLC, either to compare the fingerprint separation of one sample to another, or as CE-MS and CE-MS/MS to identify peptides according to their mass followed by identifying the proteins via genomic database searching [18, 20]. The map or fingerprint alone (the electropherogram or the chromatogram) acquired with photometric detection can be used to compare two samples without the need to identify each peptide by its mass.
The amount of a sample available for proteomics studies is often limited, which can affect the accuracy of an analysis. CE is an ideal technique in this respect because it requires only small amounts of sample and can achieve separation efficiencies of over one million theoretical plates [20-26]. CE is a powerful tool for peptide separation such that peptide mapping was one of the first applications shown when CE was first described in the literature [27-31]. For unambiguous identification of peptides separated by CE, it is coupled
11
with MS. Kasicka published a very good review on different peptide separation methods using CE [32, 33].
Regardless of the technique chosen for peptide mapping, the use of enzymes is an unavoidable step to preparing the protein substrates. Due to the drawbacks of using enzymes in solution or for in-gel digestion, as described under Section 1.1.2., the enzyme immobilization approach has been used widely and has recently grown in popularity.
1.2. Enzyme Immobilization
The classical method of enzyme digestion, whether done in solution or “in-gel” following PAGE fractionation, suffers from long digestion time and interference of enzyme autoproteolysis products during the quantification and identification. To decrease the autoproteolysis, typically a low enzyme to substrate ratio is used, usually 1:20 to 1:100, which indicates that the enzymatic reactions are slow (16-24 h) [34-37]. Using enzyme immobilization can address this limitation and expedite digestion without the interference from autoproteolytic peptides.
1.2.1. Immobilized Proteases
The immobilization of enzymes for chemical analysis applications has become more popular during the last two decades. In this technique, an enzyme can be immobilized by several methods. These methods include: binding to a solid-phase carrier, [38, 39] or glass beads as a support [40-44]; encapsulating by a polymer [45]; entrapping using sol-gels [46, 47]; and crosslinking as a carrier free immobilized enzyme [48-53]. Several immobilization approaches have been demonstrated, including entrapment, adsorption, covalent binding, crosslinking or affinity-based interaction.
1.2.1.1. Covalent Immobilization
In the covalent binding method, a biocatalyst is bound to a surface or solid support through functional groups. These functional groups are those which are not essential for the catalytic activity of the biocatalyst. The binding is normally carried out by initial activation of the surface using multifunctional reagents (e.g., glutaraldehyde), and then enzyme coupling to the activated support. Although this method provides a high stability of enzyme immobilization, the reproducibility is sometimes poor and it needs high amounts of bioreagent [51, 54, 55]. It is still one of the most popular methods of immobilization since it provides very strong binding of enzyme with minimal leakage. Non-covalent bonds are normally weaker and changing the pH, temperature, or ionic strength can compromise the enzyme and thus its reaction with the substrate [56].
1.2.1.2. Entrapment
Enzymes can be immobilized in three-dimensional matrices such as an electropolymerized film, carbon paste, a photopolymer, a polysaccharide or a silica-based sol-gel. This immobilization method is easy to perform and the activity of the enzyme is preserved during the immobilization process because there is no chemical reaction between the monomers and the enzyme. The drawbacks for this method include biocomponent leaching and possible diffusion barriers [49].
1.2.1.3. Adsorption
One of the easiest methods of immobilization is enzyme adsorption onto a solid support. In this method, the enzyme is dissolved in a solution and a solid support is in contact with the solution for a fixed period of time. The adsorption is based on weak bonds such as van der Waals forces and hydrophobic interactions. The drawback for this method includes desorption of the enzyme if there are changes in temperature, pH and ionic strength [55].
13
1.2.1.4. Affinity
This method provides an immobilization based on enzyme orientation and molecular recognition. It creates an affinity bond between an activated support and a specific group of the enzyme sequence. This technique allows controlling the enzyme orientation in order to reduce enzyme inactivation and site blocking. The limitation of this method is the need for the presence of specific groups on the enzyme. In some cases the affinity tag needs to be attached to the protein sequence by genetic engineering [57], but the most common practice is to covalently bind biotin to the enzyme and have it react strongly with streptavidin that is attached to a solid support.
1.2.2. Immobilization by Glutaraldehyde-Mediated Crosslinking
There is an increasing interest in using carrier-free immobilized enzymes such as crosslinked enzyme crystals (CLECs). These do not lead to extra inactive mass, as a solid carrier does, which decreases the volumetric activity. One of the carrier-free immobilization methods is crosslinked enzyme aggregates or CLEAs [52, 58]. This method includes changing the hydration state of an enzyme or altering the electrostatic constant of the enzyme solution by adding appropriate aggregation agents. The soluble enzyme precipitates as insoluble aggregated enzyme with native confirmation retained. The next step is crosslinking the aggregated enzyme by adding a crosslinking agent. CLEAs need highly purified protein and thus a labour-intensive recrystallization step [48]. Using the glutaraldehyde immobilization technique described in this thesis, the enzyme is immobilized directly by adding the crosslinking agent and without need of crystallization.
In crosslinking techniques, enzymes are immobilized using a bifunctional agent such as glutaraldehyde. This technique is simple and yet provides fairly strong chemical crosslinks between enzyme molecules, depending on the pH. The main drawback however is the loss of enzyme activity due to distortion of the active enzyme’s conformation during crosslinking [40, 53, 57, 59].
In the present study, enzyme immobilization was conducted by using the crosslinking technique. Chymotrypsin, the enzyme used for the study, was immobilized (i.e., insolubilized) using glutaraldehyde as a crosslinking agent. Chymotrypsin has been immobilized on several sorbents according to the literature [60-65]. Using an immobilized protease overcomes the previously discussed drawbacks. Additionally, this method improves the stability of the enzyme and offers the benefit of reusability. Since the enzyme stability is promoted in this method, a highier enzyme-to-substrate ratio can be used and it diminishes the autoproteolysis significantly [41, 53, 66-71]. One of these methods, glutaraldehyde (GA)-mediated crosslinking, has been used for the research described in the present thesis and is thus discussed further.
Glutaraldehyde is one of the most common protein crosslinking agents. It is an inexpensive and commercially available agent. GA exists in several forms (monomerique and oligomerique) in aqueous solution which can all react with lysine residues (the ε-amino group) of proteins. Most proteins contain several lysine residues that are usually located on the protein surface because of the polar nature of the amine group. The lysine residues in chymotrypsin are not involved in its catalytic site, which allows GA crosslinking to maintain the enzyme’s conformation and therefore its biological activity. One of the common mechanisms proposed for crosslinking is between an aldehyde group of GA and an ε-amino group of lysine in the enzyme (Figure 1.5) [50]. In the present study, we used GA-mediated crosslinking of chymotrypsin. The exact mechanism of GA reaction with a protein’s amino groups is not clearly understood and a large number of mechanisms have been reported in the literature [50]. It seems that more than one mechanism could be responsible for GA crosslinking with chymotrypsin, leading to a range of conjugates, but this aspect was not studied in the current work.
15
Figure 1.5. One of the common crosslinking reactions between glutaraldehyde and an
enzyme, were Enz-N represents a lysine ε-amino group of the enzyme[50].
Although we expect a partial enzyme inactivation because of the crosslinking, sufficient enzyme activity was retained in most of our experiments. Additionally, our GA-crosslinked enzyme generally shows a good stability and can be recovered and reused, as despcribed in Chapters 3 to 6.
Immobilized enzyme can be used in batch form or in flow systems such as immobilized-enzyme reactors (IMERs). An immobilized enzyme reactor (IMER), usually in the format of a flow-through cartridge, can be prepared from various stationary phases and offers reduced cost of solvent and solution in the case of expensive enzymes or low amounts of substrate [72]. Since IMERs can operate in a fluidic style, they can be coupled with micro-column protein purification upstream and with high sensitivity peptide mapping methods downstream for protein characterization. Using the IMER also makes automation of digestion easier. The IMER is usually coupled with other instruments such as capillary electrophoresis [32, 73-76], HPLC [77, 78] or mass spectrometry [27, 72, 79, 80].
The on-line digestion of proteins can be automated and therefore faster protein identification made. By using this method, manual sample handling can be greatly reduced because the reactor can also be coupled on-line to separation and detection schemes, with the advantage of automation being especially important in microfluidic systems.
1.2.3. Immobilized Enzyme Reactor (IMER)
Miniaturising devices for chemical analysis has been a rapidly growing trend in recent years [81-83]. Small sized immobilized enzyme reactors (IMERs) are not exceptions. Several studies have been conducted on IMERs for proteomics studies. Since the analytical
performance of an IMER is directly affected by the immobilization process, many studies have been done to develop successful immobilization strategies to advance sensitivity and stability of IMERs. The best method for enzyme immobilization depends on whether higher sensitivity or more stability is desired for each application. Other factors such as reproducibility, cost and difficulty of the immobilization process need to be considered [56].
Several IMER preparation techniques have been reported in the literature, using most often either a packed column or by derivatizing the enzyme on the inner wall of an open tube capillary. Bonneil et al.[40, 84] used enzyme-bound beads which is one of the popular methods because of its simplicity. They used CPG-Trypsin packed inside the IMER and digested β-casein and insulin chain B as substrate. Although the separation efficiency was poor because of valve design for the on-line method, the system was reproducible in terms of migration time [40, 84, 85].
One of the first studies on trypin immobilization coupled to CE separation was performed by Kuhr’s group [86]. They demonstrated that trypsin can be immobilized onto the inner wall of a fused-silica capillary to produce an open tubular heterogeneous enzyme reactor. Shan et al. [87] used δ-gluconolactone as an enzyme to prepare an IMER. Their preparation method took about 10 h and needed high temperature (180 °C) and nitrogen gas. Although they prepared the IMER, they only used it to separate peptides and DNA markers and not to digest substrate. Another IMER was described by Krenkova et al. [88] using TPCK-treated trypsin and pepsin A as the enzymes. They attached the enzyme on the inner wall of a capillary. The IMER preparation method they used needed more than 30 h, 100 °C and nitrogen gas where cytochrome C and β-casein as substrates were passed through the IMER using pressurized nitrogen. They only used the native protein and not denatured substrate. Another study was conducted by Wood et al. [89] who also used TPCK-trypsin and had a long IMER preparation time of about 35 h and needed an oven to reach 110 °C. They digested Nα-benzoyl-L-arginine ethyl ester (BAEE) and measured the ratio of benzoyl-L-arginine (B-Arg) peptide from substrate to internal standard of Nα-Z-L-arginine (Z-Arg) in order to calculate the enzyme activity. The above studies only represent a fraction of those reported for proteolytic IMERs in the past 20 years.
17
In the methods mentioned above, the IMER preparation took a long time and needed instruments other than the CE itself, such as an oven and nitrogen gas. In our study, we attempted to simplify these steps and used only a common CE system with the standard injection and flushing pressures. We used a temperature as high as was possible in the CE itself, and not a complementary oven for IMER preparation. The simplified technique helps to achieve automation with less complexity and fewer steps. Additionaly, we used denatured substrate as well as the native forms to study the effect of denaturing agents on the IMER digestion by GA-crosslinked chymotrypsin.
1.3. Chymotrypsin as the Protease
In principle, any enzyme can be immobilized for a vast range of applications. Since the current study is focused on application to proteomics, only the proteases trypsin and chymotrypsin are discussed below.
Several immobilized proteases have been reported for proteomics studies, ed such as pepsin [90], trypsin [42, 72, 86, 91-94], and chymotrypsin [53, 64]. Although the Waldron research group had used trypsin for previous studies, chymotrypsin has been used in the past few years for reasons described below. The highly specific cleavage of peptide bonds by trypsin at the C-terminal side of residues lysine and arginine in a substrate [72] indicates that these two amino acids must be “available” in their native state to be recognized by the enzyme’s active site. On the other hand, our group was interested in using the ultra-high sensitivity of CE-LIF-based peptide mapping as a means to characterize the efficiency of glutaraldehyde (GA)-crosslinked enzyme for low substrate concentrations. Since many fluorescently labeled proteins have been derivatized at the ɛ-amine group of lysine residues, trypsin will not cleave the protein here. [95-100]. Therefore, trypsin cleaves the labeled substrate only at its arginine sites,, which is a less abundant residue in many proteins. Because of this drawback for using trypsin, chymotrypsin was selected as an alternative to allow characterization of immobilized enzyme to benefit from using CE-LIF for peptide mapping.
Chymotrypsin cleaves the substrate on the C-terminus of phenylalanine (Phe), tyrosine (Tyr), and tryptophan (Trp) residues [101, 102]. An advantage of this is that all chymotryptic peptides contain one aromatic amino acid which allows their detection by UV-absorbance, although the molar absorptivity of the peptide is low. Chymotrypsin is a 25 kDa protease with a single polypeptidic chain of 245 amino acid residues. It has been used in food industry and exerts pharmaceutical properties [103, 104]. For example, protein hydrolysis using chymotrypsin enhances nutritional characteristics in food products and reduces allergic properties and bitterness. Since large amounts of this enzyme are required for industrial purposes, its recovery and reuse is documented [105]
In the present study chymotrypsin was immobilized using GA with a similar procedure developed previously in our lab for trypsin [51, 106].
1.4. Research Objectives and Thesis Structure
A key step in obtaining proteomics information includes enzymatic digestion of protein into smaller peptides, which is the “bottom-up” approach [107]. The enzyme can be used in immobilized form, which offers several benefits including its reusability, reducing its autoproteolysis and, therefore, the possibility of using higher enzyme-to-substrate ratios [36]. Immobilized enzymes can be used batch-wise or in flow systems such as IMERs [85] and various studies have been conducted for both formats [36, 49, 51, 84]. Nevertheless, there is a need for additional investigation on immobilizing enzymes by GA, especially in micro-reactors, and studying their effectiveness in digesting different sizes of substrates.
Therefore, the general hypothesis that guided the current work was to develop and characterize a simple and rapid in situ enzyme immobilization procedure for GA-crosslinked enzymes to make a microreactor (IMER) compatible with microcolumn separations and mass spectrometry (MS). The novelties of this approach includes using chymotrypsin, which provides cleavage sites different of those trypsin and facilitating digestion of fluorescently labeled proteins, making an in-situ IMER using chymotrypsin, and digesting different substrates and separating the digests. The objectives of the present study include the short term goal of making carrier-free immobilized enzyme preparations

![Figure 1.4. General workflow for bottom-up and top-down proteomics [19].](https://thumb-eu.123doks.com/thumbv2/123doknet/7514606.226274/35.918.149.839.140.863/figure-general-workflow-proteomics.webp)