Climate and Energy Policy for U.S. Passenger Vehicles:
A Technology-Rich Economic Modeling and Policy Analysis
by
Valerie Jean Karplus
M.S. Technology and Policy and Civil and Environmental Engineering, Massachusetts Institute of Technology, 2008
B.S. Molecular Biophysics and Biochemistry and Political Science Yale University, 2002
Submitted to the Engineering Systems Division
ARCHIVES
in Partial Fulfillment of the Requirements for the Degree of MASSACHUSETTSINSTITUTE
OF TECHNOLOLGY Doctor of Philosophy
at the
MAR
10 2015
Massachusetts Institute of Technology
February 23, 2011
LIBRARIES
@2011 Massachusetts Institute of Technology. All rights reserved.
Sig
nature redacted
Signature of Author...Signat. . ... .
Engine ring Systems Division
Signature redacted February 23, 2011
C ertified by ... ... Dr. John B. Heywood Professor, Mechanical Engineering
Signature redacted
Committee MemberC ertified by ... .... ... . .. . .o. - -.--- --. ---. .. .. .. .. Dr. Henry D. Jacoby
Professor, Sloan School of Management
Signature redacted
Committee MemberC ertified by... .... ...
/
.
*;.A
ei
1
.O Professor, Political Science and Engineering SystemsCertified by...Signature redacted mmittee Member
;r. John M. Reilly
, enior Lecture;, Sloan School of Management
Signature redacted
Committee MemberC ertified by ... ...
Dr. Mort D. Webster
ProfessorsEngineering Systems
Accepted by ...
Signature redacted
Committee ChairAccepted~~~~9 by... ...
Dr. Nancy Leveson Professor, Aeronautics and Astronautics and Engineering Systems Chair, Engineering Systems Division Education Committee
Climate and Energy Policy for U.S. Passenger Vehicles:
A Technology-Rich Economic Modeling and Policy Analysis
by
Valerie Jean Karplus
Submitted to the Engineering Systems Division
on February 23, 2011 in Partial Fulfillment of the Requirements for the Degree of Doctor of Philosophy in Engineering Systems
Abstract
Climate and energy security concerns have prompted policy action in the United States and abroad to reduce petroleum use and greenhouse gas (GHG) emissions from passenger vehicles. Policy affects the decisions of firms and households, which inevitably react to changing constraints and incentives. Developing and applying models that capture the technological and behavioral richness of the policy response, and combining model insights with analysis of political feasibility, are important agendas for both research and policy. This work makes four distinct contributions to these agendas, focusing on the case of climate and energy policy for passenger vehicles in the United States.
First, this work contributes to econometric studies of the household response to gasoline prices by investigating whether or not U.S. households alter their reliance on higher fuel economy vehicles in response to gasoline price changes. Using micro-level household vehicle usage data collected during a period of gasoline price fluctuations in 2008 to 2009, the econometric analysis shows that this short-run vehicle switching response, while modest, is more pronounced for low income than high income households, and occurs on both a total distance
and per trip basis.
Second, this work makes a methodological contribution that advances the state of empirical modeling of passenger vehicle transport in economy-wide macroeconomic models. The model developments include introducing an empirically-based relationship between income growth and travel demand, turnover of the vehicle stock, and cost-driven investment both in reduction of internal combustion engine (ICE) vehicle fuel consumption as well as in adoption of
alternative fuel vehicles and fuels. These developments offer a parsimonious way of capturing important physical detail and allow for analysis of technology-specific policies such as a fuel economy standard (FES) and renewable fuel standard (RFS), implemented individually or in combination with an economy-wide cap-and-trade (CAT) policy. The new developments within the model structure are essential to capturing physical system constraints, interactions among policies, and unintended effects on non-covered sectors.
Third, the model was applied to identify cost-effective policy approaches in terms of both energy and climate goals. The RFS and FES policies were shown to be at least six to fourteen times as costly as a gasoline tax on a discounted basis in achieving a 20% reduction in cumulative motor gasoline use. Each of these policies was shown to have only a modest effect on economy-wide carbon dioxide emissions. Combining a fuel economy standard and a renewable fuel standard produced a gasoline reduction around 20% lower than the sum of forecasted reductions under each of the policies individually. Under an economy-wide CAT policy that targets GHG emissions reduction at least cost, obtaining additional reductions in passenger
vehicle gasoline use with RFS or FES policy increases the total policy cost, and does not result in additional reductions in GHG emissions. The analysis shows the importance of integrated assessments of multiple policies that act on separate parts of a system to achieve a single goal, or on the same system to achieve distinct goals.
Fourth, a political analysis shows how, in the case of climate and energy policy for passenger vehicles, sharp trade-offs exist between economic efficiency and political feasibility. These tensions are shown to exist at the level of policy justification, policy type, and design choices within policies. The pervasiveness of these tensions suggests that economically-preferred policies will face the greatest barriers to implementation.
This work concludes by integrating the findings from each of the individual parts to make recommendations for policy. Recognizing the heterogeneity of household responses, the prescriptions of the economic analysis, and the tensions between these prescriptions and politics, policy options should be evaluated not only based on cost effectiveness, but also on their ability to serve as stepping stones toward desirable end states by providing incentives to revisit and increase policy cost effectiveness over time.
Thesis Supervisor: Dr. John B. Heywood
Professor of Mechanical Engineering
Thesis Supervisor: Dr. Henry D. Jacoby
Professor of Management at the Sloan School of Management
Committee Member: Dr. Kenneth A. Oye
Associate Professor of Political Science and Engineering Systems
Committee Member: Dr. John M. Rerly
Senior Lecturer at the Sloan School of Management
Committee Chair: Dr. Mort D. Webster
Acknowledgements
"...es sprechen viele Anzeichen dafur, da3 die Zukunft in solcher Weise in uns eintritt, um sich in
uns zu verwandeln, lange bevor sie geschieht."
Rainer Maria Rilke (1904)
Individual pursuits such as a doctoral thesis rely enormously on the support of colleagues, instructors, classmates, family, and friends. For support in this research I am deeply indebted to the members of my Doctoral Thesis Committee, the Joint Program on the Science and Policy of Global Change, the Sloan Automotive Laboratory, the BP Advanced Conversion Research Project, the MIT Energy Initiative, the Martin Family Society of Fellows for Sustainability, the
EPA STAR Graduate Fellowship, and the Engineering Systems Division. For a lifetime of love
and support I am grateful to my family. For creative inspiration, hours of laughter, encouragement, and intellectual challenge I am grateful to the dear friends with whom I have shared adventures at Yale, Caltech, MIT, and beyond.
Valerie Jean Karplus
Figures
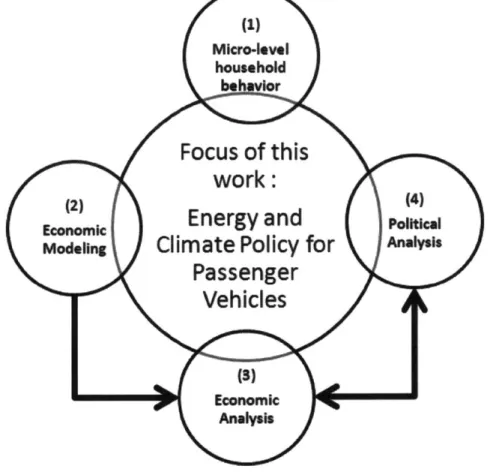
Fig. 2.1 Fuel economy targets set by the CAFE program, 1978 to 2010. ... 32 Fig. 2.2 A map of the present project as it relates to different aspects of the question of how to
design an integrated energy and climate policy for passenger vehicles. ... 38
Fig. 3.1 U.S. monthly gasoline prices in 2008 and 2009... 42 Fig. 3.2 Distribution of household vehicle ownership in the sample. ... 47
Fig. 4.1 Schematic overview of the passenger vehicle transport sector incorporated into the
representative consumer's utility function of the MIT EPPA model. ... 68
Fig. 4.2 Long-run trends in the growth of expenditures on vehicle transport, VMT, vehicle
ownership, gasoline usage, and miles-traveled per vehicle in the United States... 72
Fig. 4.3 The share of real household expenditures on passenger vehicle transport over the past 15
y ears... 72 Fig. 4.4 The effect of changing the specified income elasticity of demand in the United States in
the MIT EPPA model from 1 to 0.70 in the reference (No Policy) case on a) expenditures share for passenger vehicle transport and b) growth rates for VMT, vehicles, refined oil
demand, and per capita income through 2030. ... 77
Fig. 4.5 Structure of the passenger vehicle transport sector, illustrating the separation of VMT provided by new and used passenger vehicles and the underlying sector structure... 79
Fig. 4.6 Marginal abatement cost curves for passenger vehicles in 2011, with a) marginal cost of
reducing fuel use through application of technology graphed against cumulative fuel use reduction, b) the table of cost-effectiveness values from EPA (201 Ob) used to parameterize the curve, and c) estimated values of the substitution elasticity and related variables for each
curve... 83
Fig. 4.7 Simulated improvement in the vehicle fleet fuel economy (both new and used vehicles) and total fuel use using alternative elasticities of substitution (ptelas) between fuel and
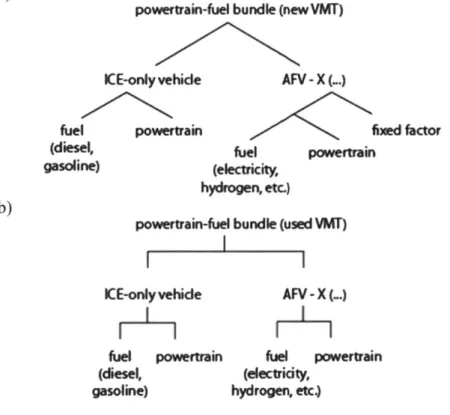
powertrain capital in the MIT EPPA model in a reference (no policy) scenario... 84 Fig. 4.8 The inclusion of alternative powertrain types (denoted by AFV-X, where X could be a
PHEV, EV, CNGV, and/or FCEV) in the a) new and b) used passenger vehicle transport sectors in the M IT EPPA m odel. ... 86
Fig. 5.1 Adjusted new vehicle fuel economy by model year in miles per gallon... 93
Fig. 5.2 EPPA5-HTRN model projection of the total number of registered passenger vehicles in
the U nited States, 2010-2050... 95
Fig. 5.3 EPPA5-HTRN model projection of the total vehicle-miles traveled by new (0-5 year
old) and used (5-25 year old) vehicles in the United States, 2010-2050... 95
Fig. 5.4 EPPA model projection of a) on-road adjusted fuel economy for new and used passenger vehicles, 2010-2050, and b) adoption of PHEVs in the baseline scenario. ... 96
Fig. 5.5 Simulated relationship between per capita income and household-owned passenger
vehicles per 1,000 capita in the United States in the EPPA5-HTRN model. ... 97
Fig. 5.6 Projected passenger vehicle a) refined oil demand and b) tailpipe CO2 emissions. ... 97
Fig. 5.7 Vehicle ownership projections used for sensitivity analysis at reference, high, and low elasticity values... 99
Fig. 5.8 Projected a) gasoline use and b) GHG emissions through 2050 under different vehicle
transport demand assumptions (PHEV is available)... 100
Fig. 5.9 The effect of changing the income elasticity on gasoline use in the absence of policy when the PHEV is available at a 10% premium over the ICE-only vehicle. Gasoline demand in the reference case with the PHEV available at a 30% premium is shown by the dashed black lin e... 10 2 Fig. 5.10 Projected a) gasoline use and b) GHG emissions through 2050 under different
assumptions about the cost of ICE vehicle efficiency improvements. ... 103 Fig. 5.11 Projected a) gasoline use and b) GHG emissions through 2050 under different
assumptions about the cost of ICE vehicle efficiency improvements for the best and worst case
scenarios... ... 105
Fig. 6.1 Adjusted (on-road) fuel consumption trajectories for three alternative FES policies shown a) graphically and b) num erically... 110 Fig. 6.2 The targeted biofuels blending percentages under two representative RFS policies that
achieve the same cumulative gasoline use reduction... 111 Fig. 6.3 Gasoline reduction trajectories for a) the fuel economy standard, b) the renewable fuel
standard, and c) the gasoline tax (with and without biofuels) that achieves a total cumulative reduction in gasoline use of 20% relative the reference (No Policy) case... 114
Fig. 6.4 A comparison of the cumulative change in total fossil CO2 emissions and household consumption in a) graphical and b) tabular form from 2005 to 2050 for the two FES policies, the RFS policy, and the gasoline tax that achieve the same level of cumulative gasoline
reduction from passenger vehicles... 116
Fig. 6.5 Changes in VMT relative to the reference case when policies are applied... 118 Fig. 6.6 The ICE-only vehicle fuel consumption trajectories under different policy scenarios. 119
Fig. 6.7 PHEV adoption trajectories that result from applying policies... 120 Fig. 6.8 CO2-equivalent emissions path under the CAT policy considered in this analysis. ... 124 Fig. 6.9 Total primary energy use by type in the United States under the CAT policy. ... 125
Fig. 6.10 A comparison of the cumulative change in gasoline use, total fossil CO2 emissions, and household consumption from 2005 to 2050 under a FES and CAT policy with and without advanced biofuels available... 127
Fig. 6.11 A comparison of the cumulative change in gasoline use, total fossil CO2 emissions, and
household consumption from 2005 to 2050 under a RFS-sharp and CAT policy... 128
Fig. 7.1 The inverse relationship between political considerations and policy support (which
depends on political feasibility considerations) as shown for the case of a) biofuels producers,
b) automotive manufacturers, and c) electric sector suppliers... 160 Fig. 8.1 Tensions between economic efficiency and political feasibility when it comes to climate
Tables
Table 2.1 List of policies and primary target(s)... 30
Table 2.2 A comparison of models used to evaluate the impact of policies on passenger vehicle energy use and GH G em issions ... 37
Table 3.1 Summary of several studies on the elasticity of demand for a) gasoline and b) VMT w ith respect to gasoline price... 42
Table 3.2 Aggregate gasoline price elasticity of demand for VMT and gasoline. Log indicates natural log. ... 50
Table 3.3 Elasticities by incom e level... 51
Table 3.4 Elasticities by degree of urbanization. ... 52
Table 3.5 Gasoline price elasticity of demand for VMT and gasoline for a) one-vehicle, b) two-vehicle, and c) three-vehicle households ... 53
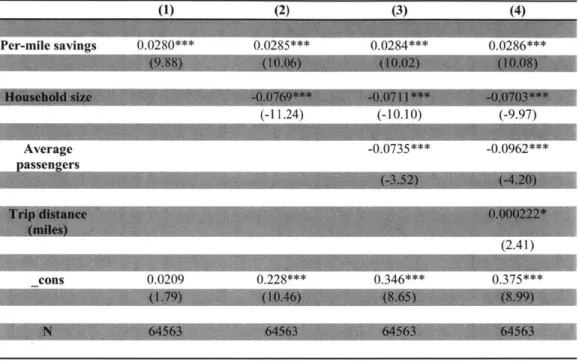
Table 3.6 Effect of per-mile savings on switching behavior in the aggregate sample with a) GLM coefficients and z-statistics shown in columns (1) through (6) and OLS coefficients and statistics shown in (7) and b) predictive margins and marginal effects for the GLM model. .. 56
Table 3.7 Predictive margins and marginal effects of per-mile savings on fraction of miles traveled in higher efficiency vehicle by income category. ... 57
Table 3.8 Predictive margins and marginal effects of per-mile savings on fraction of miles traveled in higher efficiency vehicle by degree of urbanization... 58
Table 3.9 Effect of per-mile savings on the choice of a high efficiency vehicle by trip for the aggregate sam ple... 59
Table 3.10 The effect of per-mile cost savings by trip purpose... 60
Table 4.1 Comparison of several computable general equilibrium (CGE) models applied to energy and environmental policy analysis... 70
Table 5.1 Parameter description and expected effect on outcomes of interest. ... 92
Table 5.2 Observed and extrapolated values for the passenger vehicle fleet in the benchmark year 2004 ... 93
Table 5.3 List of the parameter values used in the United States in the reference case run. ... 95
Table 5.4 The effect of changing assumptions about the relationship between per capita income and vehicle ownership in the United States through 2050 on cumulative fuel use, total fossil CO2 emissions, and household consumption... 100
Table 5.5 Effect of changing the PT elasticity on cumulative passenger vehicle fuel use, total CO 2 em issions, and consum ption. ... 103
Table 5.6 Sensitivity of outcomes to "best" and "worst" case assumptions... 105
Table 6.1 Summary of forecasted travel demand and technology response under policies... 122
Table 6.2 A comparison of cumulative change in gasoline use, total fossil CO2 emissions, and household consumption from 2005 to 2050 for the four RFS and FES policy combinations. 123 Table 6.3 The impact of a CAT policy on passenger vehicle gasoline use, total CO2 emissions, and the new VMT driven by PHEVs in 2050... 126
Table 7.1 Role of political considerations at different levels of the policy process. ... 138
Table 7.2 Attempts to change the Federal Excise Tax on gasoline and justifications... 140
Table 7.3 Gasoline and diesel fuel taxes in cents per gallon... 157
Table 7.4 Short-run price elasticities of gasoline demand in the U.S... 160 Table 7.5 Tensions between economic efficiency and political feasibility for passenger vehicle
p olicy ... 16 5 9 of 223
Acronyms
ADAGE BEA BLS CAFE CAT CGE CNGV CO2 EIA EPA EPPA EPPA5-HTRN EU EV FCEV FES FFV GAMS GHGs GTAP ICE IEA LCFS LES MPSGE NHTS NHTSA PHEV RECS RFS SAL TCD U.S. VMTApplied Dynamic Analysis of the Global Economy (model) Bureau of Economic Analysis
Bureau of Labor Statistics
Corporate Average Fuel Economy (Standards) Cap-and-trade
Computable general equilibrium Compressed natural gas vehicle Carbon dioxide
United States Energy Information Administration United States Environmental Protection Agency
Emissions Prediction and Policy Analysis (model)
EPPA model version 5 with household transportation detail European Union
Electric vehicle
Fuel cell electric vehicle Fuel Economy Standard Flex-fuel vehicle
General Algebraic Modeling System Greenhouse gases
Global Trade Analysis Project Internal combustion engine International Energy Agency Low Carbon Fuel Standard Linear Expenditure System
Mathematical Programming System for General Equilibrium Analysis National Household Transportation Survey
National Highway Traffic Safety Administration Plug-in hybrid electric vehicle
Residential Energy Consumption Survey Renewable Fuel Standard
Sloan Automotive Laboratory Turbo charging and downsizing United States
Table of Contents
Chapter 1: Introduction... 13
1.1 Background ... 13
1.2 Contributions of this Research... 16
1.3 Detailed Research Questions ... 17
1.4 Conclusions... 21
Chapter 2: Background on U.S. Passenger Vehicle Transport and Policy ... 23
2.1 U.S. Passenger Vehicle Transport in a Global Context... 23
2.2 Components of Vehicle Petroleum-based Fuel Use and GHG Emissions ... 25
2.3 Options for Reducing Petroleum Use and GHG Emissions ... 28
2.4 Policy Designs: A Review ... 31
2.5 M odels used for policy assessment... 37
2.6 W hat gaps does this work seek to fill?... 40
Chapter 3: Do U.S. Households Favor High Fuel Economy Vehicles When Gasoline Prices Increase? A Discrete Choice Analysis... 42
3.1 Context and Background... 42
3.2 Literature Review... 45
3.3 Data Set and Descriptive Statistics ... 47
3.4 M odel Description and Results... 50
3.5 Conclusions and Extensions ... 62
Chapter 4: A New Approach to Modeling Passenger Vehicles in Computable General Equilibrium (CGE) M odels... 64
4.1 Introduction... 64
4.2 Bottom-Up Technology in Top-Down Models: Issues and Previous Work... 65
4.3 Modeling Approach ... 72
4.4 Summary and Extensions... 91
Chapter 5: New M odel Reference Case and Sensitivity Analysis... 92
5.1 Introduction... 92
5.2 Reference Case Development for the United States... 93
5.3 U.S. Reference Case Projection ... 95
5.4 Sensitivity Analysis ... 100
5.5 Conclusions... 108
Chapter 6: An Analysis of Climate and Energy Policies for Passenger Vehicles ... 109
6.1 Introduction ... 109
6.2 Modeling a Fuel Economy Standard (FES) and a Renewable Fuel Standard (RFS) 110 6.3 Transport-focused Energy Policy Analysis ... 114
6.4 Combining a Renewable Fuel Standard and a Fuel Economy Standard ... 123
6.5 Combining Transport-focused Energy Policies with an Economy-wide Cap and Trade (CA T) Policy...5... 125
6.6 Conclusions... ... 130
Chapter 7: Political Analysis... 132
7.1 Introduction... ... ... 132
7.2 D efining Political Feasibility ... 134
7.3 Tensions between Economic Efficiency and Political Feasibility... 138
7.4 Politics in Passenger Vehicle Policy: International Context and Path Dependency. 157 7.5 Trade-offs Inherent in Climate and Energy Policy for Passenger Vehicles: Policy Im plications... ... .... ... 165
Chapter 8: Conclusions ... 169
8.1 Micro-level Studies of Household Response... 170
8.2 Technology-rich Macroeconomic Models of Passenger Vehicle Transport... 172
8.3 Energy and Environmental Policy Design for Passenger Vehicles ... 175
8.4 Political A nalysis ... 177
8.5 Synthesis ... 178
References...---... 186
Appendix A: Parameterization of the Passenger Vehicle Transport Sector in the EPPA Model: Methods and Data... 198
A.1 Detailed Description of the MIT Emissions Prediction and Policy Analysis (EPPA) M odel... . . --... 198
A.2 Development 1: Demand for Transport Services: Methods and Data ... 201
A.3 Development 2: Representing Engineering Detail and Abatement Opportunities in the Existing Vehicle Fleet - Methods and Data... 208
A.4 Development 3: Alternative Fuel Vehicles... 216
A.5 Modeling Constraints on Market Adoption ... 219
Appendix B: EPPA and SAL Fleet Model Projections... 220
B.1 Comparison of EPPA U.S. Fleet Projections with the Sloan Automotive Laboratory (SA L) Fleet M odel... .... .. ... 220
Chapter 1: Introduction
"The civilized man has built a coach, but has lost the use of his feet."Ralph Waldo Emersoni
This chapter introduces the main topic of this thesis-how should policymakers address the growing contribution of passenger vehicles to petroleum use and greenhouse gas emissions in the United States? After providing brief background on the issue, this chapter discusses the methodologies applied to analyze several important considerations for policy design, including cost effectiveness, the distribution of impacts, and political feasibility. The methodologies include econometric techniques to measure the effects of fuel price changes on micro-level household decisions, a technology-rich modeling approach to compare the cost-effectiveness of alternative passenger vehicle policy designs, and political analysis to understand how considerations that arise in the policy process beyond cost effectiveness influence the choice of policy. This chapter concludes by describing the main findings of the individual analyses, as well
as the integrated conclusions.
1.1 Background
Passenger vehicles have grown in importance as a means of transport for the members of private households in the United States since the early twentieth century. As vehicle ownership and use have increased, so too have the required volumes of petroleum and the environmental impact of driving. Public concern about petroleum supply disruptions and climate change has prompted vigorous debate over the appropriate role of public policy, particularly for passenger vehicles, in mitigating these threats. As many developing countries seem prepared to follow a similar road toward motorization, designing and demonstrating effective policy approaches will have not only national, but global, import.
Consider for a moment the extent of the global passenger vehicle system. In 2010 light-duty vehicles (most of them owned by private households) were driven around seven trillion miles and account for around 20% of manmade carbon dioxide (C02) emissions in the United
States, 12% in Europe, and about 5% of emissions worldwide (GMID, 2010; EPA, 2010c; IEA, 2010).2 Trends of increasing vehicle ownership and use suggest that additional policy intervention will be required to reduce the contribution of passenger vehicles to greenhouse gas
(GHG) emissions. Households are adding vehicles and driving ever greater total distances each 1In Emerson (1841).
2 CO2 accounts for 94-95% of the greenhouse gas (GHG) emissions associated with a passenger vehicle, calculated
on the basis of global warming potential. The remaining 5-6% of emissions is comprised of CH4, N20, and HFC
emissions (EPA, 2005).
year (Davis et al., 2009). While engine efficiency has improved markedly over the past few decades, these gains have been offset by increases in horsepower, size, and vehicle weight over the same period, resulting in more modest improvements in on-road fuel economy (An & DeCicco, 2007).
Designing a policy approach to reduce GHG emissions from household-owned vehicles involves several decisions. First, policymakers must define a regulatory goal or goals-for instance, reducing petroleum use, GHG emissions, or both. Second, policymakers must identify an appropriate regulatory target and level of coverage. The target may be several steps removed from the controlled substance or pollutant, and focused on a single part of an interconnected system. For instance, regulators may choose to target new vehicle fuel economy or fuel consumption (the volume of fuel required per unit distance traveled), which affects only a limited portion of total fuel used by passenger vehicles each year. Third, for a given policy, decision makers face choices about which sources of fuel use or GHG emissions to cover, the timing of reduction targets under a policy, and other policy design variables. The way that vehicles, fuels, and associated GHG emissions are treated by the regulation may have a large impact on the cost effectiveness of the policy, as well as the distribution of impacts across households and sectors. Support for policies is influenced by affected stakeholders, and so these distributional impacts will affect political feasibility to the extent that the policy harms or rewards powerful influences.
One approach to policy analysis is the development and application of models, or simplified representations of the world that can simulate the relationships between the assumptions and outcomes of interest. To simulate the costs and impacts of policies, models must include both broad sectoral coverage as well as an appropriate amount of system detail that resolves key variables and the relationships among them as they evolve over time. Few models used for policy analysis attempt to address both needs, whether for the case of passenger vehicles or for other sectors, and indeed the nature of the detail required depends on the question being asked. This thesis is partially about introducing new capability into one class of economic models-computable general equilibrium (CGE) models-to represent better the consumer response to energy and environmental policy focused on passenger vehicles. An economy-wide economic model is important in this analysis because it captures how prices change
to capturing the effects of policies on demand for passenger vehicle ownership and use, which accounts for a large share of household expenditures, petroleum use, and GHG emissions. Moreover, the primary fuels presently used (or proposed for use) in passenger vehicles are used in other sectors beyond household vehicle transportation. Capturing how policies affect primary fuel use across sectors through changes in underlying prices helps to identify interactions or unintended consequences that may erode or alter the expected benefits of a policy.
However, models alone cannot, due to their deliberately simplified nature, capture the richness of factors that could influence a policy's political feasibility or effectiveness once on the books. Thus I have structured this dissertation to include both empirical modeling as well as political analysis components. Considering household heterogeneity is important when assessing the impacts of policies. As a complement to the modeling work, I begin with a detailed econometric study using micro-level household data to investigate the household response to the fuel price fluctuations that occurred over a thirteen-month period in 2008 and 2009.
I then develop a new modeling capability that involves a richer description of key economic and physical system variables in the passenger vehicle transportation sector of a macroeconomic model, the MIT Emissions Prediction and Policy Analysis model. The goal is to represent long term global trends in demand for passenger vehicle transport, new versus used vehicle stock, and both incremental as well as radical changes to vehicle technologies that could be adopted in response to policies. With the new modeling capability in hand, I am able to compare several policies and policy combinations in terms of their effects on travel demand and technology outcomes, impact on energy use and the environment, as well as cost and its distribution across sectors.
Finally, I focus on the relationship between policy designs that emerge as cost effective from the economic modeling analysis and the traction these policies have achieved in the political arena, past and present. Sector impacts identified in the modeling analysis suggest that stakeholder interests often do not overlap. A comparison between the United States and several other advanced industrialized nations helps to suggest additional factors that may have contributed to low rates of motor vehicle fuel taxation in the United States relative to other regions. The work concludes by suggesting some possible paths for incentivizing a transition to more cost-effective policy approaches over time.
1.2 Contributions of this Research
This dissertation is structured as follows. Chapter 2 frames the topic of climate and energy policy for passenger vehicles, providing essential background for the analysis presented in the following chapters. I then study the short-run household response to gasoline prices, undertaking an econometric study to examine the effect of fuel price on vehicle use decisions within household-owned fleets, both in the aggregate as well as by income category, degree of urbanization, and level of vehicle ownership (Chapter 3). This analysis relies on a detailed data set that captures the daily driving patterns by U.S. households and spans a period of gasoline price fluctuations during 2008 and 2009 in order to investigate whether U.S. households switch to rely on vehicles with higher fuel economy when gasoline prices increase.
Second, I develop a richer description of household vehicle transportation in a macroeconomic model, using historical data on vehicle ownership and expenditure trends, technologically-based bottom-up estimates of the responsiveness of internal combustion engine
(ICE) vehicle fuel economy to fuel price signals, and detailed technology cost estimates for
advanced low carbon vehicles and fuels (Chapter 4).
Third, I use this modeling capability to conduct an economic analysis of climate and energy policies, implemented individually and in combination (Chapters 5 and 6). The effects of policies that target a fixed reduction in cumulative fuel use are compared, considering sensitivity to assumptions about the cost and availability of advanced vehicle and fuel options. I then consider the consequences of combining policies that bear separately on either vehicle efficiency or the fuel supply, and identify the costs and outcomes in terms of fuel demand, GHG emissions, and technology adoption. Finally, I consider the effects of combining an economy-wide cap-and-trade (CAT) policy aimed at reducing GHG emissions at least cost with several policies aimed at reducing petroleum-based fuel use from passenger vehicles.
Fourth, this analysis is followed in Chapter 7 by a discussion of the relationship between the prescriptions for policy that emerge from the economic modeling analysis and considerations of political feasibility.
Finally, the contribution of this dissertation and its implications are summarized in
1.3 Detailed Research Questions
The studies in Chapters 3 through 7 focus on distinct yet complementary research questions. Here I briefly introduce these questions, the motivation for inquiry, and the choice of methodology used to address each.
1.3.1 Part 1: Do Households Switch Vehicles to Minimize the Effects of a Fuel Price Shock?
The first part of this work involves an investigation of the short-run household response to a fuel price increase, focusing specifically on the role of vehicle switching (the ability of the household to reallocate its miles across household-owned vehicles, which may differ in terms of their fuel economy). I will examine how this response varies in the aggregate sample, as well as conditional on household income, degree of urbanization, and vehicle ownership. Using a large and detailed data set from the 2009 U.S. National Household Transportation Survey, I am able to estimate the extent of switching both in terms of total distance traveled and by trip. My hypothesis is that vehicle switching will differ depending on household characteristics. For instance, I expect that the most cash-constrained households in the sample will show the highest propensity to switch to their higher fuel economy vehicles when gasoline prices increase, given that potential savings are likely to constitute a larger share of their household budgets.
I first investigate whether households reduce fuel use more than they reduce VMT in
response to a fuel price increase, which would be consistent with switching behavior. Elasticities of demand for fuel and VMT with respect to fuel price are calculated both for the aggregate sample and conditional on household characteristics. Specifically, I ask:
Question 1.1: Are the short-run gasoline price elasticities of demand for VMT and gasoline
significantly different at the level of the aggregate sample, and do they vary by income level, degree of urbanization, or the number of vehicles a household owns?
Second, I estimate a generalized linear model with logit link and a conditional logit model to evaluate the effect of changes in the per-mile fuel savings available to the household on the choice to drive a high efficiency vehicle, both in terms of the fraction of total miles-traveled and on a per-trip basis. The household response depends on both the fuel economy of the vehicles owned by the household (assumed to be fixed in the short run for households that have
not purchased a new vehicle or scrapped a used vehicle) and fuel price (the independent variable of interest). The two main questions of interest are:
Question 1.2: How does an increase in the per-mile savings from switching affect the fraction of
miles-traveled in the high efficiency vehicle? Does this response vary significantly by income category and by degree of urbanization?
Question 1.3: Does an increase in per-mile savings from switching affect the choice of a high
efficiency vehicle by trip? Does this effect vary by trip purpose?
This analysis provides insight into the role of within-fleet differences fuel economy in offering households short-run flexibility to reduce fuel use in response to a fuel price increase. Understanding the role of vehicle switching may grow more important if households adopt vehicles that use little or no gasoline, creating conditions under which full switching to an alternative fuel vehicle could offer large potential savings by displacing gasoline fuel use entirely.
1.3.2 Part 2: Representing Passenger Vehicle Transport in a Macroeconomic Model
The goal of the second part of this work is to introduce technological and fleet detail into a macroeconomic model to explicitly capture relationships among household income, fuel prices, demand for VMT, fuel use, and resulting GHG emissions as they evolve over time. The modeling work is guided by the need to explicitly represent the major levers by which policy can influence vehicle and fuel technology, fuel use, and GHG emissions outcomes in the context of the larger energy system. This model development is performed in the Emissions Prediction and Policy Analysis model, a CGE model with energy system detail developed by the MIT Joint Program on the Science and Policy of Global Change (Paltsev et al., 2005).
This part of the work involves three main model developments. First, I introduce into the structure of the model a variant of the Linear Expenditure System (LES) for consumer demand with quasi-homothetic preferences. This approach allows the specification of empirically-based income elasticities of demand with respect to particular classes of consumption. Here I use observed empirical trends and econometric estimates to calibrate the relationship between income and demand for VMT over the period 2010 to 2050. Income elasticities of demand for
ownership saturation level, and other regional characteristics such as urban density (Dargay et al., 2007). In this analysis I focus on per capita income as the main driver of rising vehicle ownership, calibrating elasticities to reflect underlying demographic and vehicle ownership and use projections as they vary by world region. With this addition, the model now captures the expectations of more rapid growth in vehicle transport demand in developing regions as a first vehicle purchase becomes affordable for an ever-greater fraction of the population, while reflecting slower growth as a function of income in developed regions.
Second, I develop a new, more disaggregated structure of the household transportation sector in the EPPA model that explicitly represents a new (less than five-year-old) vehicle fleet and a used (more than five-year-old) vehicle fleet in each of the sixteen world regions. I also develop a production structure for household vehicle transport services that represents technological substitution between fuel and investment in vehicle efficiency in response to changes in their relative prices. For each powertrain type, I estimate an elasticity of substitution that determines investment in vehicle efficiency in response to gasoline price changes, based on technology cost and effectiveness data (EPA, 20 1Ob).
Third, I represent advanced vehicle and fuel technologies in the model. Constraints on the adoption of these technologies are also explicitly represented. These constraints include the turnover of the vehicle fleet, learning that reduces the cost of a pre-competitive technology over time, and constraints on technology adoption in the market, once that technology becomes cost competitive. Opportunities for increasing the on-road fuel economy of today's dominant ICE vehicles are also represented using engineering-cost data.
With the new model in hand, I develop and explore the sensitivities of model outputs to the underlying inputs in a reference (No Policy) scenario, which is compared against, and informed by, external analyses. The main question of interest here is:
Question 2: What does the baseline scenario and sensitivity analysis suggest about the ability of
the United States to reach aggressive petroleum use or GHG emissions reduction targets in the absence of policy intervention through 2050?
This work lays the foundation for the analysis in Part 3, which focuses on the effects of policies, alone and in combination.
1.3.3 Part 3: Economic Analysis of Climate and Energy Policies for Passenger Vehicles
The model is applied to compare existing or proposed policies aimed primarily at reducing petroleum use (as well as GHG emissions) by passenger vehicles. In 2009, the Obama Administration announced an increase in the vehicle fuel economy standard to 34.1 mpg by 2016 (a harmonized standard that is consistent with vehicle per-mile GHG emissions of 250 grams of carbon dioxide per mile), and has suggested that this standard will be tightened through 2050
(EPA, 2010a; EPA, 201 Ob). Meanwhile, a renewable fuel standard that mandates fixed volumes
of biofuels be blended into the fuel supply has been implemented under the Energy Independence and Security Act of 2007. An important question for national policymakers is, how do alternative policy designs compare in terms of the cost effectiveness of achieving petroleum-based fuel use or GHG emissions reductions, and what are the associated vehicle technology, energy, and environmental outcomes? Do the outcomes of the policy change if, as some scholars have described, consumers only consider the first several years of fuel costs when deciding which vehicle to purchase? This section explores these themes by investigating four questions:
Question 3.1: How do the costs and technologies employed compare under a fuel economy (FES) standard and a renewable fuel standard (RFS)? How do these outcomes compare to a
gasoline tax designed to achieve the same cumulative reduction in gasoline use?
Question 3.2: What is the impact of combining an FES and an RFS in terms of the cost, fuel use,
and GHG emissions outcomes?
Question 3.3: What is the impact of combining either an FES or RFS with an economy-wide
carbon constraint?
1.3.4 Part 4: Political Analysis of Climate and Energy Policies for Passenger Vehicles
This thesis then moves on to a discussion of the relationship between economic prescriptions and considerations of political feasibility. In particular, the political analysis
focuses on the following four questions:
Question 4.1: What is the relationship between the policy prescriptions that emerge from the
Question 4.2: How do any tensions between the economics and politics play out at the levels of
policy justification, policy type, and policy design choices for policies considered in the economic analysis?
Question 4.3: What can be learned from cross-national comparisons and the results of the modeling analysis about the underlying reasons why policies might gain more or less traction in the United States?
Question 4.4: What policy approach should the U.S. pursue today in order to increase the likelihood of moving to more cost-effective policies in the future?
1.4 Conclusions
This dissertation concludes by integrating the findings of the individual sections to highlight implications for research and policy. The main findings from each section are briefly described here, followed by a description of the overall conclusions.
First, the econometric analysis of the household vehicle use response to gasoline prices shows that the vehicle switching response, while modest, is employed by households to reduce gasoline costs on both a total distance and per trip basis. This response is found to be more pronounced for low income than high income households.
Second, this work develops a method of representing passenger vehicles in an economy-wide CGE model, advancing the state-of-the-art of modeling tools available to support energy and environmental policy decisions. This method offers a parsimonious way of representing key physical details that allows analysis of technology-specific policies such as a fuel economy standard (FES) and renewable fuel standard (RFS), individually or in combination with an economy-wide cap-and-trade system. The model structure is essential to capturing interactions among policies and unintended effects on non-covered sectors.
Third, the modeling analysis indicates, consistent with other studies, that a tax on petroleum-based fuel is most the cost-effective policy approach for displacing its use in passenger vehicle transportation (Goldberg, 1998; Austin & Dinan, 2005). Achieving the same reduction using a FES or RFS policy was found to be at least six to fourteen times as costly. Combining FES and RFS policies produces a reduction in petroleum-based fuel use that is around 20% lower than the sum of the reductions achieved when the policies are implemented individually, while costs remain close to additive. Finally, when an FES or RFS policy is combined with a CAT policy, two possible situations result. In cases where the FES or RFS
policy binds and the amount of gasoline displaced from passenger vehicles increases relative to the CAT policy alone, the combination also raises the total policy cost, while having no effect on
GHG emissions. In cases where the FES or RFS policy does not bind, there is no effect on the
cost, fuel use, or GHG emissions under the CAT policy. Taken together, this multi-part analysis shows the importance of evaluating simultaneously the cost and effectiveness of multiple policies that act on separate parts of a system to achieve a single goal, or on the same system to
achieve distinct goals.
Fourth, a political analysis shows how, in the case of climate and energy policy for passenger vehicles, sharp trade-offs exist between economic efficiency and political feasibility. These tensions are shown to exist at the level of policy justification, policy type, and design choices within policies. The pervasiveness of these tensions suggests that economically-preferred policies to address passenger vehicle energy use and GHG emissions will face the greatest hurdles to implementation. This argument is supported by an analysis of the predicted sectoral impacts of policies in the United States as well as a cross-national comparison of policy choices and their interaction with the evolution of passenger vehicle transport systems over time.
This work concludes by integrating the findings from each of the individual parts to make recommendations for policy. Recognizing the heterogeneity of household responses, the prescriptions of the economic analysis, and the tensions between these prescriptions and political feasibility, this analysis suggests that policies should be evaluated based not only on cost-effectiveness, but also on their ability to serve as stepping stones toward desirable end states by lowering political barriers to legislating more cost-effective policies over time.
Chapter 2: Background on U.S. Passenger Vehicle Transport and Policy
Every time I reduce the price of the car by one dollar I get one thousand new buyers. Henry Ford3
This chapter describes the motivations for reducing petroleum use and greenhouse gas (GHG) emissions from passenger vehicles in the United States and around the world. It discusses the rationales often given for public policy intervention, and describes the range of policy instruments that have been proposed or implemented. Finally, it describes the range of analysis tools used to evaluate the impact of policies, and cites some of the advantages and limitations of different approaches.
This chapter draws on previous studies to provide the context and motivation for the work in this thesis on climate and energy policy for passenger vehicles in the United States. Given the diversity of topics covered in this work, I focus here on providing essential background common to all chapters. At the beginning of each subsequent chapter I discuss previous studies relevant to specific work in this thesis. This chapter serves primarily to set the stage.
Section 1 begins with an overview of the issue and the physical system of interest,
including a description of U.S. passenger vehicle transport in a global context and its energy and climate impacts. Section 2 briefly describes the policy designs that have been considered for reducing petroleum use and GHG emissions of passenger vehicles. Section 3 describes the range of modeling methodologies that have been used to forecast future vehicle petroleum use and
GHG emissions under alternative policy scenarios. It discusses the differences in how the models
are used to generate policy insights, and potential blind spots associated with different modeling approaches. Section 4 concludes by identifying the gaps in previous studies that this work seeks to fill.
2.1 U.S. Passenger Vehicle Transport in a Global Context
The transportation sector is responsible for a large fraction of both petroleum use and
GHG emissions in the United States. Transportation accounts for 28% of U.S. end-use GHG
emissions, while cars and light trucks, which together comprise the light-duty vehicle fleet, account for 16% of total GHG emissions in the United States, or 62% of total transport GHG
23 of 223 3 In Halberstam (2003).
emissions, nearly all of which is in the form of carbon dioxide (EPA, 2010c). Most of these light-duty passenger vehicles are owned and operated by private households.4 Globally, light-duty vehicles account for around 5% of total GHG emissions, and this share is expected to grow
significantly over the next several decades (IEA, 2010).
Privately-owned vehicles have become the dominant form of personal mobility and an important enabler of economic activity in the United States and around the world. A U.S. household owns around two vehicles on average and spends around 10% of its annual income on
vehicle transport (FHWA, 2009c; U.S. Census Bureau, 2009).5 Annual growth in the number of private vehicles has averaged about 2.3% per year since 1970, while miles-traveled per vehicle has trended slowly upward at 0.4% per year (Davis et al., 2009). This trend has prompted increasing concern about the externalities associated with passenger vehicles. Light-duty vehicles account for 47% of petroleum use in the United States, and petroleum-based fuels supply over 90% of the energy required by vehicles (Davis et al., 2009; Heywood et al., 2009). Recent U.S. federal energy legislation has targeted reductions in petroleum use, given concerns over the vulnerability of the U.S. to global oil price shocks and its associated national security implications (Energy Policy Act of 2005; EISA, 2007). In addition to energy and climate concerns, which are the focus of this thesis, public policy has targeted many other externalities associated with vehicle transport. For instance, legislation at both the federal and state levels has addressed health and environmental concerns by limiting allowable emissions of air pollutants from vehicle tailpipes.6 These pollutants include NOx and volatile organic carbon, which contribute to ozone formation and its associated human health impacts. Promoting vehicle and traffic safety as well as limiting road congestion have also long appeared on the list of national, state, and municipal policy priorities.
These problems have long persisted-and been largely tolerated-because private automobiles have enabled greater personal mobility and economic activity in many parts of the country. The 37% growth in vehicle-miles traveled between 1990 and 2008 has been tightly interlinked with economic and population growth, the persistence of low gasoline prices, the
4 In addition to passenger vehicles, the light-duty vehicle fleet is comprised of cars and light-duty trucks owned by commercial businesses and government. U.S. federal regulations consider a light-duty truck to be any motor vehicle having a gross vehicle weight rating (curb weight plus payload) of no more than 8,500 pounds (3,855.5 kg).
5 This percentage is much lower for households that do not own a vehicle.
growth of a vast road network, and the low density of urban and suburban development in many parts of the country (EPA, 2010c).
Although currently the vast majority of GHG emissions from passenger vehicles occur in industrialized nations, passenger vehicle use is rising rapidly in many rapidly developing countries. This growth will contribute significantly to future transport-related GHG emissions, despite uncertainty over the future fleet size and usage habits, as well as the role that public transport could play in offsetting this growth. As per capita income rises, history has shown that people shift to more rapid forms of transportation (Schafer, 2006). If this trend holds, it will result in a steady increase in VMT in these emerging countries for the foreseeable future.
2.2 Components of Vehicle Petroleum-based Fuel Use and GHG Emissions
The life-cycle petroleum use and GHG emissions of an individual passenger vehicle depend on both technological and behavioral factors. Impacts at the fleet level depend on both the rate at which technology and behavioral changes can be introduced into the fleet over time, as well as the composition of the fuel supply. The cost and timescales associated with undertaking different types of changes may vary widely. In this section, I work from the level of the individual vehicle to the level of the passenger vehicle fleet, discussing first the components of petroleum-based fuel use and GHG emissions, as well as associated reduction opportunities, at the vehicle level. I then discuss issues related to realizing reductions in fuel use and GHG emissions at the level of the passenger vehicle fleet, which depends on the rate of turnover of the vehicle fleet, the rate of new sales growth, the contribution of vehicles of different ages to total miles traveled, vehicle utilization patterns, and other factors.
2.2.1 Vehicle Level
At the level of the individual vehicle, fuel use can be decomposed into the product of the
life-cycle fuel requirement per mile,7 the average number of miles driven in the vehicle each year, and the number of years a vehicle is owned. GHG emissions depend on the same set of factors multiplied by the GHG emissions intensity per unit of fuel used. It is important to note
7 The total life-cycle fuel required per mile includes any energy requirement associated with the extraction and
refining of fuel (well-to-tank), as well as the actual fuel consumed in the engine to move the vehicle forward (tank-to-wheels). The tank-to-wheels fuel use is typically expressed either as fuel economy in miles per gallon or as fuel
consumption in liters per 100 km.
that the quantities on the right-hand side of the equation are not independent of each other. A potential concern is that reducing one term in the equation may lead to unintentional increases in one or more of the other terms. One well-studied example is the rebound effect, in which a decrease in vehicle fuel consumption per unit distance is accompanied by an offsetting increase in vehicle-miles traveled per year in response to a decrease in the cost of per mile of travel
(Small & Van Dender, 2007; Greene et al., 1999).
Total vehicle fuel use = Fl x M x Years in use (2.1)
Cie Yarn Fe Mis
Total vehicle GHG emissions = Carbon x x M x Years in use (2.2)
Looking at Equations 2.1 and 2.2, it is easy to see why a coordinated approach to the regulation of vehicle petroleum use and GHG emissions is needed.8 Regulations that focus exclusively on vehicle fuel efficiency do not constrain the VMT response, which could offset the effectiveness of the regulation. This effect is likewise very important at the fleet level, as substitution of mileage across vehicle types occurs. Meanwhile, regulations that target the addition of more expensive, low carbon fuels to the fuel supply, if not subsidized, would likely result in an increase in fuel prices at the pump, inducing consumers to invest in fuel efficiency. The length of vehicle ownership in years is also related to average annual miles traveled.9 Thus providing incentives to scrap older, less efficient vehicles, which are typically used less, may be less effective at reducing GHG emissions than policies focused new vehicles, which are used more.
2.2.2 Fleet Level
The previous section focused on contributions to fuel use and GHG emissions at the level of the individual vehicle. The relationships between the components become even more complex once the analysis is expanded to include two or more vehicles, especially if their usage patterns
8 Carbon dioxide (CC2) accounts for 94-95% of the GHG emissions associated with a passenger vehicle, calculated
on the basis of global warming potential. The remaining 5-6% of emissions is comprised of CH4, N20, and HFC
are not independent. Taking a fleet-level view of the issue is important because it helps to understand how the contributions of each component could change due to household decision-making involving multiple vehicles, or due to the timescales involved in changing characteristics of vehicles or of the fuel supply.
As mentioned above, most private households in the United States own two or more vehicles, and decisions about which vehicles to buy and drive are made by the members of the household. The decisions of what vehicles to purchase and how far to drive them are mutually dependent (Mannering & Train, 1985; Mannering, 1986). These decisions depend in turn on the opportunities and limitations imposed by the vehicles the household (already) owns and the household's driving needs.
At the level of the entire passenger vehicle fleet, the contributions of individual vehicles of various ages and fuel economies to total vehicle-miles traveled over a period of interest determine the aggregate petroleum use and GHG emissions impact. Again here dependencies among variables are important, and some of the variables may be easier and less costly to change than others. For instance, it may take many years for new, more efficient vehicle technologies to enter into the fleet and contribute to reductions in gasoline use. By contrast, changing the composition of the fuel supply would displace petroleum use and GHG emissions in a given year, assuming that the alternative fuel could be used in a large fraction of existing vehicles. In order for alternative fuels not compatible with existing vehicles to displace petroleum use on a large scale, vehicle technology must be changed simultaneously through the introduction of alternative fuel vehicles, which is limited by fleet turnover.
As a result of these dependencies, policy instruments that target different parts of the vehicle-fuel-user system will differ in the costs they impose. A policy intervention-for example, a gasoline tax-would incentivize a multi-faceted household response that includes reducing miles-traveled, investing in more efficient vehicles, relying less on vehicles with low fuel economy, or driving vehicles less aggressively. By contrast, regulations that focus on reducing fuel use by providing incentives for earlier scrappage of less efficient vehicles might lead households to purchase new vehicles, which, even if more efficient, would likely also be driven greater total distances, reducing the cost effectiveness of the scrappage policy.
2.3 Options for Reducing Petroleum Use and GHG Emissions
The impact of technological and behavioral opportunities to reduce petroleum use and
GHG emissions will depend on both the ease of implementing changes at the vehicle level and
propagating these changes through the vehicle fleet. Here I describe these technological and behavioral opportunities, along with factors that affect the associated cost and ease of achieving scale. The first two options are related to vehicles, the next two options are related to the fuel supply, and the final two options are related to vehicle usage and driver behavior.
2.3.1 Improving the Efficiency of New ICE Vehicles
Many engineering and economic studies suggest that there is still a large opportunity to improve the on-road fuel economy of existing internal combustion engine (ICE) vehicles. Improvements could be accomplished both by adding new, efficiency-improving technology to vehicles, as well as by scaling back energy-intensive vehicle attributes such as horsepower, vehicle weight, and features that trade off with on-road fuel economy (DeCicco, 2010; Knittel,
2009; MacKenzie, 2009). The former approach includes both incremental changes to the vehicle
such as low rolling resistance tires, weight reduction, improving aerodynamics, or transmission tuning, as well as more significant changes including hybridization, turbo-charging, or dieselization. While impossible to pursue all changes simultaneously, combinations of technologies are estimated to have the potential to increase fuel economy of the ICE vehicle
significantly (for instance, to 50 mpg for conventional gasoline vehicles and 75 mpg for hybrid vehicles) (Greene & Plotkin, 2011). Since these technologies can only be introduced through the sales of new vehicles, the impact of incremental changes in ICE vehicle efficiency at the fleet level will be limited by fleet turnover.
2.3.2 Increasing the Adoption of Alternative Fuel Vehicles
As an alternative to vehicles that can run on existing petroleum-based fuels, alternative fuel vehicles involve introducing both a new vehicle and its dedicated fuel (or energy carrier, in the case of electricity or hydrogen) into the vehicle fleet. Examples of such vehicle-fuel pairs include electric vehicles or EVs (electricity), hydrogen fuel cell vehicles or FCEVs (hydrogen), compressed natural gas vehicles or CNGVs (natural gas), and flex-fuel vehicles or FFVs
such as the plug-in hybrid electric vehicle or PHEV (which can run on both gasoline and electricity). Adoption of these vehicles requires overcoming a number of hurdles, including cost, limitations on range, and limited or nonexistent refueling infrastructure. Indeed, changing the vehicle fleet and the fuel supply at the same time-especially when the viability of one goal depends on progress towards the other-is an additional challenge involved in the scale up of alternative fuel vehicles (Struben & Sterman, 2008). Discussion of these issues as they relate to alternative fuel vehicles is included in Chapter 4 and Appendix A.
2.3.3 Reducing Upstream Petroleum-based Fuel Use and GHG Emissions
Life-cycle assessment draws particular attention to the contribution of upstream fuel and related emissions to the petroleum-based fuel use and GHG emissions footprint of passenger vehicles. Indeed, as petroleum supply evolves to tap reserves that are more energy-intensive to extract and refine, the energy and GHG emissions penalty associated with conventional fuels will increase (Chan et al., 2010). This well-to-tank contribution to energy use and GHG emissions is not only an issue for petroleum-based fuels. If vehicles in the future rely on energy carriers such as electricity or hydrogen, the upstream processes used to produce the fuels will be the primary contributor to energy and environmental impact. Cultivation of land to produce biomass feedstocks likewise can make large contributions to the total energy use and GHG emissions impact of biofuels, especially if dense carbon sinks such as rainforests are displaced in the process (Searchinger et al., 2009). Thus the upstream component of fuel production can significantly affect life-cycle estimates of the per-mile fuel requirement or the per-mile GHG emissions footprint associated with a particular fuel.
2.3.4 Displace Petroleum-based Fuels in the Fuel Supply
The displacement of petroleum-based fuels (preferably with low carbon substitutes) is another way to reduce the petroleum use and GHG emissions from passenger vehicles. Petroleum use reduction depends on the life-cycle impact of the newly introduced fuel relative to the fuel it displaces. If petroleum products are used in the production of the alternative fuel (for instance, in the case of petroleum inputs to fertilizer production when growing corn), it will offset the overall impact on petroleum use. Ensuring that petroleum-based fuel is reduced may be easier than achieving reductions in GHG emissions, given the contribution of upstream processes