READ THESE TERMS AND CONDITIONS CAREFULLY BEFORE USING THIS WEBSITE. https://nrc-publications.canada.ca/eng/copyright
Vous avez des questions? Nous pouvons vous aider. Pour communiquer directement avec un auteur, consultez la première page de la revue dans laquelle son article a été publié afin de trouver ses coordonnées. Si vous n’arrivez pas à les repérer, communiquez avec nous à PublicationsArchive-ArchivesPublications@nrc-cnrc.gc.ca.
Questions? Contact the NRC Publications Archive team at
PublicationsArchive-ArchivesPublications@nrc-cnrc.gc.ca. If you wish to email the authors directly, please see the first page of the publication for their contact information.
NRC Publications Archive
Archives des publications du CNRC
This publication could be one of several versions: author’s original, accepted manuscript or the publisher’s version. / La version de cette publication peut être l’une des suivantes : la version prépublication de l’auteur, la version acceptée du manuscrit ou la version de l’éditeur.
Access and use of this website and the material on it are subject to the Terms and Conditions set forth at
Adhesion strength of piles in saline ice
Inoue, M.; Frederking, R. M. W.
https://publications-cnrc.canada.ca/fra/droits
L’accès à ce site Web et l’utilisation de son contenu sont assujettis aux conditions présentées dans le site LISEZ CES CONDITIONS ATTENTIVEMENT AVANT D’UTILISER CE SITE WEB.
NRC Publications Record / Notice d'Archives des publications de CNRC: https://nrc-publications.canada.ca/eng/view/object/?id=a490ff8f-e18f-47f1-87db-61ccd0f2a77e https://publications-cnrc.canada.ca/fra/voir/objet/?id=a490ff8f-e18f-47f1-87db-61ccd0f2a77e
L A Y
N21d National Resegrch Consell national
no. 1502
1*
1
W n c i l Canada de recherches Canada c. 2BLDG Institute for lnstitut de
Research in recherche en
-
Construction construction
Adhesion Strength of Piles in Saline Ice
by M. lnoue and R. Frederking
A N A L Y Z E D
Appeared in
Proceedings 8th International IAHR Symposium on Ice
lowa City, lowa, August 18 - 22, 1986 Vol. Ill, p. 89-104
(IRC Paper No. 1502)
Reprinted with permission
Price $3.00 NRCC 28603
On a effectuC des essais en labratoire pour Ctudier les effets de la vitesse de deplacement,
de 1'Cpaisseur de glace et du diam5tre des pieux sur l'adherence d'une couche de glace
saline sur des pieux de his.
La glace utilisk Ctait repdsentative de la glace de mer
B
grains
prismatiques forrnCe naturellement. Des pieux cylindriques de diam6tre variant entre
30
et
145
mm ont CtC extraits
B
des vitesses de deplacement nominales constantes se situant entre
1.5 x
10-4et 7.8
x
10-2
d s ,ltCpaisseur de la glace allant de
58
h 170
rnm.
On a constate que le mode de rupture, soit par cisaillement
B
Itinterface pieu-glace, soit par
flexion de la glace, dCpendait des param5tres des essais. La force #adherence augmentait
de fagon proportionnelle au deplacement des pieux et
B
1'Cpaisseur de la glace, et de fagon
inversement proportionnelle au diam5tre des pieux. On a observC que I'adhCrence de la
glace saline Ctait au moins
3.5fois moins grande que celle, mesur6e antkrieurement dans
des conditions semblables,
*
la -I- A'M1m h.,-m h m h~ m m i a u e s .
lA
HR Ice Symposium 1986
lowu City, Iowu
ADHESION STRENGTH OF PILES I N SALINE I C E
I
I
M. Inoue I c e Engineering Lab. ,Tsu Research Center, Japan Nippon Kokan K.K.!
R. Frederking I n s t i t u t e f o r Research i n Construction, Canadai
N a t i o n a l Research Counci 1! ABSTRACT
Laboratory t e s t s were conducted t o i n v e s t i g a t e t h e e f f e c t s o f displacement r a t e , i c e t h i c k n e s s and p i l e diameter on t h e adhesion of a s a l i n e i c e sheet t o wooden p i l e s . The i c e used was represen- t a t i ve o f n a t u r a l l y formed columnar-grai ned sea i c e . C y l i n d r i c a l p i l e s having diameters between 30 and 145 mn were p u l l e d up a t constant nominal displacement r a t e s between 1
. ~ x I o - ~
and 7.8~10-' m/sec, f o r i c e thicknesses from 58 t o 170 mm.I
The f a i l u r e mode, e i t h e r shear a t t h e p i l e - i c e i n t e r f a c e o r f l e x u r a l i n t h e i c e was observed t o depend upon t h e t e s t
parameters. The adhesion s t r e n g t h was observed t o increase w i t h i n c r e a s i n g p i l e dispalcement r a t e , i n c r e a s i n g i c e thickness and decreasing p i l e diameter. The adhesion s t r e n g t h of s a l i n e i c e was found t o be smaller by a f a c t o r o f a t l e a s t 3.5 t h a n t h a t of fresh- water c o l umnar-grai ned i c e measured e a r l i e r under simi 1 a r
I . I N I ~ I ~ U N
A f l o a t i n g i c e cover develops s u b s t a n t i a l v e r t i c a l loads on a
, s t r u c t u r e t o which i t i s f r o z e n due t o changes i n water l e v e l . This type 'of load i s an impotant f a c t o r i n design and c o n s t r u c t i o n o f a r c t i c
I
! o f f s h o r e s t r u c t u r e s used i n petroleum e x p l o r a t i o n and production. It i s ,
therefore, necessary t o evaluate such v e r t i c a l i c e loads a c t i n g on a s t r u c t u r e surrounded by sea ice, i n r e l a t i o n t o adfreeze bond between m a t e r i a l and i c e .
Sackinger and Sackinger (1977) subjected a s t e e l c y l i n d e r embeded i n sea i c e t o an a p p l i e d torque and measured t h e adhesion s t r e n g t h as a
f u n c t i o n of s a l i n i t y and temperature. Saeki e t a l . (1981) conducted
push-out t e s t s on p i l e s w i t h various m a t e r i a l s i n sea ice, and measured t h e adhesion s t r e n g t h as a f u n c t i o n o f p i l e displacement r a t e , diameter
and m a t e r i a l as w e l l as i c e thickness and temperature. Oksanen (1982)
measured adhesive shear s t r e n g t h between s a l i n e i c e and s t e e l p l a t e s under
varying s a l i n i t i e s and r e l a t i v e l y low temperatures. These i n v e s t i g a t i o n s
were r e l a t e d t o the case where shear between the m a t e r i a l and i c e
predominates. Under n a t u r a l conditions, however, t h e i c e cover could f a i l
i n bending as w e l l as shear. On t h e o t h e r hand, t h e o r e t i c a l treatments of
v e r t i c a l i c e loads on p i l e s have been based on t h e bending theory of a p l a t e on an e l a s t i c foundation ( f o r example, L o f q u i s t , 1951). Recently Vershinin e t a l . (1983) conducted f i e l d t e s t s t o determine v e r t i c a l loads
on 1 m diameter p i l e f r o z e n i n t o n a t u r a l sea i c e o f 1.15111 thickness. Thej
found t h a t the measured value o f 70 tons was several times greater than the value computed according t o t h e recommendations i n t h e Construction Norms and Regulations (1975).
The purpose o f t h e present work was t o o b t a i n data on t h e adhesion s t r e n g t h of p i l e s i n s a l i n e i c e under c o n d i t i o n s s i m i l a r t o those i n
nature. The t e s t s were conducted using a r e l a t i v e l y small tank. P i l e s
frozen i n t o s a l i n e i c e were p u l l e d upwards r e l a t i v e t o the i c e cover. Wooden p i l e s were used t o minimize t h e i c e t h i c k e n i n g e f f e c t around p i l e s .
I
This paper r e p o r t s t h e t e s t r e s u l t s o f adhesion s t r e n g t h measured as aI f u n c t i o n o f p i l e displacement rate, i c e thickness and p i l e diameter. An
1
e m p i r i c a l equation t o p r e d i c t t h e adhesion s t r e n g t h i s a l s o proposed.I
/ 2 . DESCRIPTION OF TEST APPARATUS
i
Tests were conducted using a small i n s u l a t e d tank, 660mm
i n diameterQppl ied Load
Fig.1
Scheme o f load and d e f l e c t i o n measurements
I
-
100 mm~ b 0 t t O m and sides so t h a t t h e water temperature and i c e growth r a t e could
1
be c o n t r o l led. A thermocouple probe was used t o moni t o r i c e and water temperatures.! A loading apparatus s e t up over t h e tank p u l l e d t h e p i l e upwards Z
] r e l a t i v e t o the i c e cover. The outer perimeter o f t h e i c e cover adhered
y t o the tank w a l l l i n e r made o f galvanized s t e e l . Load was a p p l i e d w i t h a screw jack d r i v e n by a v a r i a b l e speed motor. Loading speed could be v a r i e d between 7 ~ 1 0 - ~ mm/sec and 8 ~ 1 0 - ~ nmnlsec. A schematic of t h e
arrangement f o r measuring load and d e f l e c t i o n o f t h e i c e cover i s shown i Fig.1. Loads were measured by a load c e l l mounted between t h e p i l e and
i
the screw jack. Displacement o f t h e p i l e and d e f l e c t i o n s of t h e i c e cove
1
a t r a d i i o f 100 mm and 250 nmn from the center o f t h e p i le, were measuredI
i r e l a t i v e t o t h e i c e surface a t a distance o f about 25 mm from t h e w a l l of
the tank, using f i v e displacement transducers ( d i r e c t c u r r e n t d i f f e r e n t i a
I
transformers1,
mounted on a reference arm. Load and displacement s i g n a l s1
were recorded on a s t r i p c h a r t recorder as we1 1 as i n a d i g i t a l i z e d form.I
The p i le s were made o f B. C. fir, t h e same as those used e a r l i e r byI
Frederking (1979) f o r t e s t s i n freshwater i c e . They were shaped on a
I
l a t h e and f i n i s h e d by emery paper: A r o d threaded through t h e center of1
I the p i l e connected i t t o t h e load c e l l .
I
1
3. TEST PROCEDUREI
The loading system was set over t h e water-f i 1 le d tank. The p i l e was soaked and then attached t o t h e system, c a r e f u l l y a l i g n i n g i t v e r t i c a l l y ,1
before i c e growth was i n i t i a t e d . A l l t e s t s were done i n s a l i n e i c e grown t o simulate n a t u r a l sea i c e . The tank which was fi 1 le d w i t h water ofI
! Time (hour) Grain Size (mm), Salinity (7..)
1
Fig.2 I c e growth as a f u n c t i o n Fig.3 Grain s i z e and s a l i n i t y
I
o f time p r o f i le s o f i c e covero f -15
"C.
The water was mixed w h i l e c o o l i n g u n t i 1 t h e e n t i r e depth reached i t s f r e e z i n g p o i n t . When t h e water temperature near t h e surface decreased s l i g h t l y below the f r e e z i n g p o i n t , t h e tank was seeded by s i e v i n g f i n e - g r a i n e d snow u n i f o r m l y over t h e water surface. Side and bottom heaters helped t o m a i n t a i n uniform i c e thickness and t o prevent any i c e p a r t i c l e s from forming a t t h e bottom o f the tank d u r i n g i c e growth.F i g .2 shows i c e thicknesses measured w i t h a r e s i s t a n c e w i r e thickness gauge as a f u n c t i o n o f time. The growth r a t e v a r i e d from 40 t o 20 mm/day w i t h elapsed time. The s a l i n i t y p r o f i l e o f t h e i c e cover grown i n t h i s manner i s shown i n Fig.3, together w i t h g r a i n s i z e p r o f i l e . The average s a l i n i t y o f the i c e was 5.5%0 which i s q u i t e s i m i l a r t o t h a t of n a t u r a l sea ice, as observed by Nakawo and Sinha (1981). The g r a i n s i z e increased l i n e a r l y w i t h depth, which i s a l s o s i m i l a r t o n a t u r a l c o n d i t i o n s observed by Weeks and Hamilton (1962). The i c e consisted of a 7 mn seeded l a y e r at the t o p w i t h a columnar-grained s t r u c t u r e extending below i t . Therefore, the i c e grown i n the l a b o r a t o r y was very s i m i l a r t o n a t u r a l l y formed sea i c e .
When t h e i c e cover reached t h e desired thickness, t h e reference arm was placed onto the i c e surface and displacement transducers were
c a r e f u l l y s e t up. A f t e r s t a b i l i z i n g t h e transducers f o r about one hour, t e s t s were s t a r t e d . Most o f t h e t e s t s were conducted a t a thickness o f about 90 mm and a t a p i l e diameter o f 50 mn. Nominal p i l e displacement r a t e s were v a r i e d from 1
. ~ x I o - ~
t o 7 . 8 ~ 1 0 ~ ~ mm/sec.I
r
'
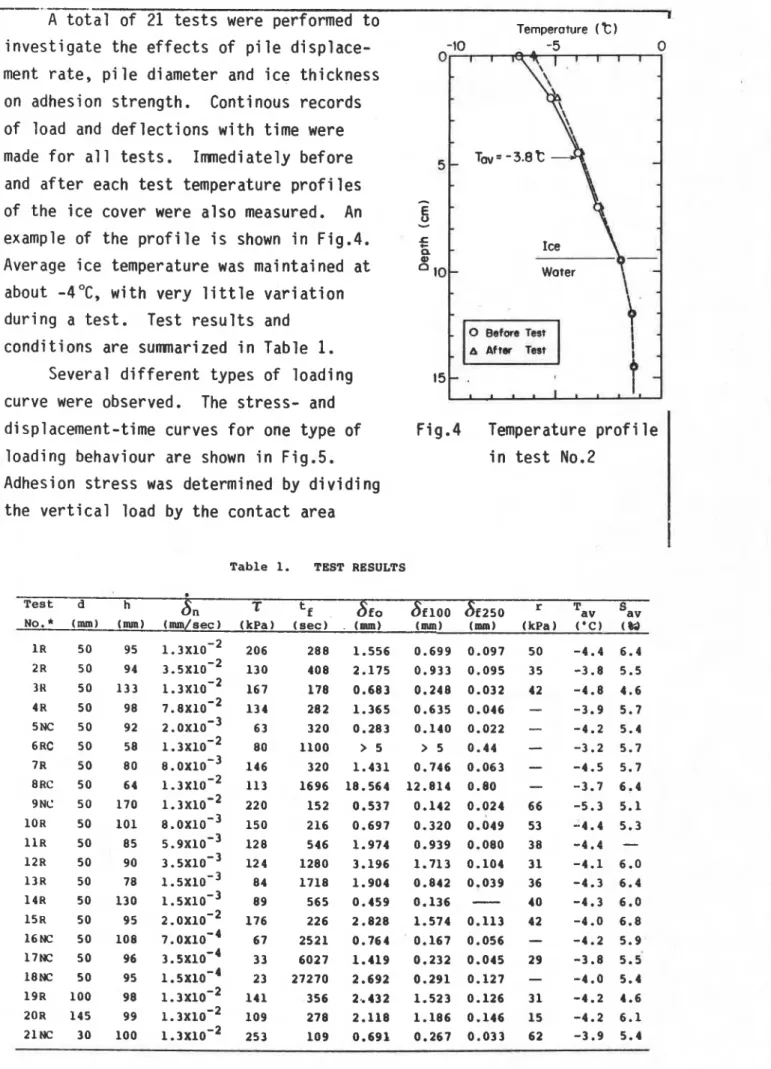
E t a 1 o f 21 t e s t s were performed t o ii Temperature (
i n v e s t i g a t e the e f f e c t s o f p i l e displace- ment r a t e , p i l e diameter and i c e thickness on adhesion strength. Continous records / o f load and d e f l e c t i o n s w i t h time were
1
made f o r a1 1 t e s t s . Immediately before land a f t e r each t e s t temperature p r o f i l e s Ib
1
of the i c e cover were a1 so measured. An-
6
jexample of the p r o f i l e i s shown i n Fig.4. 5a
i
Average i c e temperature was mai n t a i ned a tgto
Ice
- Water
about -4"C, w i t h very l i t t l e v a r i a t i o n d u r i n g a t e s t . Test r e s u l t s and
c o n d i t i o n s are summarized i n Table 1.
Several d i f f e r e n t types of loading 1 5 -
.
\.
curve were observed. The s t r e s s - and 1 1 1 . 1 1 .
I,
~-
1
displacement -time curves f o r one type o f Fig.4 Temperature prof i l eI
1
loading behaviour are shown i n Fig.5. i n t e s t No.2(
~ d h e s i o n s t r e s s was determined by d i v i d i n gf
the v e r t i c a l load by t h e contact areaI
L
Table 1 . TEST RESULTS
.
Test d h
n
z
tf S f o 8 ~ 1 0 0 8f250 Tav 'avIce th~ckness : 10 1 cm. Plle d~ameter : 5 . 0 cm. Fig.5 Records of t e s t No.10 1 i T ~ m e (set) ( a ) stress-time curve
Ice th~ckness : 10.1 cm. ( b ) displacement
-time curve
T ~ m e (sec)
between p i l e and i c e cover. Note t h a t t h e actual p i l e displcement r a t e increases w i t h time u n t i l t h e s t r e s s reaches a peak, and then remains constant i n t h e post y i e l d r e g i o n (Fig.5 ( b ) ) . The constant r a t e i s equal t o the nominal r a t e , which corresponds t o the r a t e o f t h e loading
1
apparatus operated under no load resistance. A s i m i l a r v a r i a t i o n i n r a t e was observed by Sinha (1981)f o r
i c e under u n i a x i a l compression a tconstant nominal cross-head r a t e s on a conventional t e s t machine. The d e f l e c t i o n s
measured
a t r a d i i of 100 mn and 250 m from t h e p i l e center also i n d i c a t e d t h e same t r e n d u n t i l t h e s t r e s s reached a peak. I n t h e present t e s t s , the displacement and d e f l e c t i o n s were measured w i t h a referencearm
whose end p o i n t s r e s t e d on the i c e surf ace 25 mn from t h e i n n e r w a l l o f the tank. The d e f l e c t i o n a t the end p o i n t was a l s o measured by a d i a l gauge attached t o the tank w a l l , which showed t h a t t h e end p o i n tk,
i-tu-t !if a v , i t s d ~ f l ~ c t i n n w a z a t l e a s t an a r d P ~i
0.t5!
1 Ice thickness
: 6.4 cm. circumferential
0.12 Nom~nol rote : Pile diameter : 1.3~ 5.0cm. 10~mn/sec
!
1 2
1 I f-
0.0s Fig.61 -
I t
Stress-time curve,
G o f t e s t No.8 0.06!
-51
Ifi
! 0.03j
1
o.m!
0 400 1600 2000o f magnitude smaller than a t 250 mn radius.
Fig.5 ( a ) shows t h a t as t h e p i l e i s displaced upward, t h e s t r e s s increases monotoni c a l l y reaching a maximum, and then gradual l y decreases t o an almost constant value. Four r a d i a l cracks, c i r c l e d saw-tooth-like peaks, are noted on t h e s t r e s s - t i m e curve. Although no cracks were seen f o r the f i r s t t h r e e peaks, t h e sounds were heard c l e a r l y . The f o u r t h peak corresponded t o a r a d i a l crack which was v i s i b l e i n t h e i c e immediately adjacent t o t h e p i l e . At t h e maximum stress, a few a d d i t i o n a l r a d i a l cracks appeared which developed t o depths l i m i t e d t o about 5 mm from t h e
i c e surface. Frederking (1979) has r e p o r t e d t h e development of m i c r o cracks and a c o n i c a l f a i l u r e surface a t a maximum load f o r freshwater i c e t e s t s . Such a c o n i c a l f a i l u r e surface was n o t apparent i n t h e present t e s t s . A f t e r t h e maximum stress, t h e adhesion between the p i l e and t h e i c e was g r e a t l y dimi n i shed and f r i c t i o n between them became predominant
.
This f r i c t i o n a l r e s i s t a n c e was observed t o be l e s s than t h e peak value by a f a c t o r o f 2 t o 4. I n t h e case o f t e s t No.10 the maximum s t r e s s was associated w i t h t h e occurrence o f r a d i a l cracks. This i s designated as R t( i n Table 1. I n some cases, r a d i a l cracks could n o t be seen even a t a
!
:maximum stress, although they c o u l d be heard. This case i s designated as
INC,
but t h e f a i l u r e process c o u l d be s i m i l a r t o t h e case designated R. I t /was d i f f i c u l t t o see t h e v i s i b l e cracks i n t h e cloudy s a l i n e i c e .I
Fig.6 represents the stress-time curve f o r t e s t No.8, which i s1
F
I
c h a r a c t e r i zed by r a d i a1 cracks and subsequent c i r c u m f e r e n t i a1 crack. TheI
peak s t r e s s corresponded t o the f o r m a t i on o f a c i rcumferenti a1 crack.7-- I " ' ' 1
I
1 1 " * ' I I ' " ' 1
Pile Diameter : 50 mm
Ice Thickness :80-100mm
i
l o o 0 Fresh Woter Ice by FrederkingI
A ( 1979)g
---
; P *I
-
= 500 h = 90mm A-
i (.1.
!
5 0 i c i ? 100i
I
.- C 0 m Ig
5 0 -l
a I.r
11
I 1 1 l 1 1 1 t l I I I l l l l l I I I 1 1 1 1 1 1i
10'
" I " 5 5 lo-z 5 16'I
Pile Displacement Rate,
S,,
8 ,
( -/set)I Fig.7 Adhesion s t r e n g t h as a f u n c t i o n o f p i l e displacement r a t e
' P i l e displacement r a t e e f f e c t s
!
i
I n F i g . 7 the values o f adhesion strength,7
,
determined from t h e)maximum s t r e s s from curves such as Fig.5 ( a ) are p l o t t e d against the
j
nominal p i l e displacement rates,in,
f o r a p i l e diameter of 50 rm and i ci thickness o f around 90
rrm,
a t an average i c e temperature of -4"C.
The1
s t r e n g t h increases w i t h increase i n nominal r a t e up t o 1.5~10-' mm/sec,!
then decreases s i g h t l y and remains constant. The t r e n d i s almost t h e sam1
as t h a t observed f o r freshwater i c e by Frederking (19791, shown i n t h eI
i
f i g u r e f o r comparison purposes. The adhesion s t r e n g t h i n s a l i n e i c e i s1 smaller than t h a t i n freshwater ice, by a f a c t o r o f 3.5 a t higher r a t e s
I
/corresponding t o t h e maximum strengths. The d i f f e r e n c e becomes g r e a t e r a
1
the nominal r a t e decreases.I
Regression a n a l y s i s o f t h e data f o r nominal r a t e s l e s s than1
! 1 . 5 ~ 1 0 ' ~ min/sec gave the f o l lowing equation:
i
i
whereT
i s i n kPa and6,
i s i n mn/sec.As seen i n Fig.5 (b), a constant displacement r a t e i s not achieved
before y i e l d i n g , so t h a t i t i s more appropriate t o use an average
1
displacement r a t e ,laV,
determined by d i v i d i n g t h e p i l e displacement a t I f a i l u r e , 6f0, by the time t o f a i lure, tf. These data are p l o t t e d ast r ' r l I ' ' " I Ice Thickness : 80-100rnrn Pile Diameter : 50mm 1 'ill 10-~ I I L l t I l l ) I 1 l l l l l l l I 1 I I I l l 1 1 5 lo* 5 1 6 ' 5 ld'
Loading stress Rate, t kPa/sec)
I Fig.8 Adhesion s t r e n g t h as a f u n c t i o n o f average s t r e s s r a t e
r a t e s l i e s t o t h e l e f t as compared t o t h e p r e v i o u s l y determined r e g r e s s i o
l i n e , on a nominal-rate basis. I t i s i n t e r e s t i n g t o note t h a t t h e data
p o i n t s o f nominal r a t e s higher than 2 ~ 1 0 - ~ m / s e c s h i f t t o t h e l e f t
s i g n i f i c a n t l y . This c o u l d be due t o t h e l i m i t a t i o n o f t h e loading system employed i n the present t e s t s e r i e s .
The r a t e s e n s t i v i t y o f s t r e n g t h o f ice, i s o f t e n expressed i n terms
o f s t r e s s r a t e f o r engineering purposes. Fig.8 shows t h e v a r i a t i o n o f t h
average s t r e s s r a t e ,
$
,
( d e f i n e d as adhesion s t r e n g t h , T , d i v i d e d by t h etime t o f a i l u r e , t f ) f o r t h e same c o n d i t i o n s as shown i n Fig.7. The
adhesion s t r e n g t h increases l i n e a r l y w i t h i n c r e a s i n g average s t r e s s r a t e ,
on a log-log scale. The f o l l o w i n g regression l i n e was obtained,
where
7
i s i n kPa and i s i n kPa/sec.I c e thickness e f f e c t s
The dependence o f adhesion s t r e n g t h on i c e thickness was s t u d i e d
using the 50 mn diameter p i l e data a t nominal p i
l e
displacement r a t e s o f1 . 3 ~ 1 0 ' ~ m l s e c and 1
. ~ x I o - ~
mn/sec. The r e s u l t s are given i n Fig.9.'Most o f these t e s t s were conducted a t 1 . 3 ~ 1 0 - ~ nun/sec since a maximum
adhesion s t r e n g t h appeared a t t h i s r a t e . Although t h e data are small i n number and s c a t t e r g r e a t l y , a r e g r e s s i o n a n a l y s i s gives t h e f o l l o w i n g bes f i t equation t o the data
I I I 1 I i r r t 1 1 1 1 1 1 1 1 1
lo00 Fresh M t e r Iee
t
1 1 1 1 1 1 1 1 1 I L w 1 t m r a l10 50 100 500
Ice Thickness, h (mrn)
10 50 100 500
Pile Diameter
,
d ( mmI
Fig.9 Adhesion s t r e n g t h versus Fig.10 Adhesion s t r e n g t h versusI c e thickness. p i l e d i ameter
RC i n d i c a t e s f a i l u r e
F followed by c i r c u m f e r e n t i a l crack
i
The value of the exponent i n t h e equation i s t w i c e t h a t obtained f o r :freshwater i c e w i t h the same p i l e diameter, but a t a r a t e o f 2 . 4 ~ 1 0 - ~ ?
tmn/sec which a l s o corresponds t o a maximum adhesion s t r e n g t h of freshwater
/ i c e (Frederking, 1979). The f a i l u r e process f o r a l l freshwater i c e t e s t s
lwas associated w i t h t h e occurrence o f r a d i a l cracks and formation of I
i c o n i c a l f a i l u r e surface around t h e p i l e , whereas i n some of t h e present ' t e s t s w i t h s a l i n e ice, f a i l u r e was f o l l o w e d by t h e f o r m a t i o n o f
I
t
c i r c u m f e r e n t i a l cracks. Thus t h e d i f f e r e n c e i n t h e values of t h e exponentlbetween the two types o f i c e c o u l d be associated w i t h the two d i f f e r e n t
i f a i lu r e processes. Saeki e t a l . (1981) conducted p i l e push-out t e s t s i n
j n a t u r a l l y formed sea i c e a t a temperature range o f -1.5 "C t o -4
"C
and!obtained an exponent o f 0.2. D i f f e r e n c e s i n t e s t i n g method a l s o a f f e c t
1
r e s u l t s of adhesion s t r e n g t h measurements considerably.i I n c o n t r a s t t o the above described r e s u l t s , Frederking and K a r r i
3
(1983) found no c l e a r dependence o f adhesion s t r e n g t h on i c e thicknessl o v e r the range o f thickness between 50 m and 120 mm, u s i n g freshwater i c e
1
I and 100 mn diameter p i l e s o f several d i f f e r e n t m a t e r i a l s i n c l u d i n g wood.!Recently Saeki e t a l . (1986) have c a r r i e d out extensive push-out t e s t s
I
;using 100 mn diameter p i l e s and observed t h a t t h e adhesion s t r e n g t h
I
approaches a constant when t h e i c e thickness exceeds 60 mm.
I
I
p i l e d i ameter e f f e c t sThe adhesion s t r e n g t h o f s a l i n e i c e was p l o t t e d against t h e p i l e
diameter a t a nominal p i l e displacement r a t e o f 1 . 3 ~ 1 0 - ~ mmlsec w i t h an
i c e thickness o f about 100
mm
i n Fig.10. Comparable t e s t r e s u l t s f o rfreshwater i c e (Frederki ng, 1979) are a l s o shown i n F i g
.lo.
The adhesion s t r e n g t h i s i n v e r s e l y p r o p o r t i o n a l t o approximately the square r o o t o f t h e p i l e diameter. A regression a n a l y s i s gives t h e
f o l l o w i n g best f i t equation:
I where
T
i s i n kPa and d i s i n m. The exponent i n t h e equation i sd i f f e r e n t from t h a t obtained f o r freshwater ice, namely -0.79, which i s
s i m i l a r t o Saeki's r e s u l t s (1981). D e f l e c t i o n shape
Attempts were made t o r e l a t e t h e measured d e f l e c t i o n s of t h e i c e cover t o shear and f l e x u r e i n t h e i c e . For t h e present t e s t conditions, the d e f l e c t i o n a t the p i l e i s evaluated from p l a t e bending theory
1 (Timoshenko and Woi nowsky-Krieger, 1959),
where P i s a p p l i e d load, E i s e l a s t i c modulus, v i s Poisson's r a t i o , h i s
i c e thickness, a i s r a d i u s o f t h e tank, and b i s r a d i u s of t h e p i l e . A
shear deformation c o r r e c t i o n , Ws, can be c a l c u l a t e d from
where r i s distance from t h e p i l e center, G i s shear modulous and
G = E/2(1+ v ).
The d e f l e c t i o n s o f t h e i c e cover c a l c u l a t e d
,
using equation(5)
andreasonable values o f e l a s t i c p r o p e r t i e s o f t h e ice, were a t l e a s t one
order of magnitude smal l e r than t h e measured values. Even though a
reduced e f f e c t i v e e l a s t i c modulus and t h e shear deformation c o r r e c t i o n , W,
were applied, the d i f f e r e n c e from t h e measured values was s t i 11 large. I t
was, therefore, decided t o c a l c u l a t e d e f l e c t i o n curves o f t h e i c e cover
u s i n g equation ( 5 ) and equation ( 6 ) independently. This procedure was
I
2---
Flexural modal-
Sheor model-
.5 - 1 I 0 Fig.11 D e f l e c t i o n shapeI
(a) t e s t ~ o . 1I
Distance from Pile Center
I
--
Flexural model-
Shear model-''
-
10( b ) t e s t No.8
Distonct tram Pile Center (mm)
----
Flexural model-
Sheor modelDistance from Pile Cenrer (mm)
-
( c ) t e s t No.17
( d l
t e s t No.19t h e measured d e f l e c t i o n curves on simply supported c i r c u l a r p l a t e s composed of s i m i l a r s a l i n e ice, w i t h a constant load a p p l i e d a t t h e center.
Fig.11 shows t h e d e f l e c t i o n curves c a l c u l a t e d i n such a manner t h a t
Wf and Ws a t the p i l e were made equal t o t h e corresponding measured
d e f l e c t i o n s both a t h a l f t h e peak load and a t peak load. Agreement
between c a l c u l a t e d and measured values a t h a l f t h e peak load i s remarkablj good f o r e i t h e r f l e x u r a l model o r shear model, b u t t h e c a l c u l a t e d values a t peak load d e v i a t e s l i g h t l y from t h e measured values.
For t e s t No.1 (
6,
= 1 . 3 ~ 1 0 - * m / s e c ) , t h e f a i l u r e was characterized by shear f a i l u r e a t t h e p i l e - i c e i n t e r f a c e , f o l l o w e d by a few r a d i a l cracks. This i s c l e a r l y r e f l e c t e d on t h e measured d e f l e c t i o n curves; i .e,t h e shear model a c c u r a t e l y describes the deflections. For a t h i n n e r i c e
cover ( F i g . l l b ) , t h e f a i l u r e was f o l l o w e d by the formation o f
c i r c u m f e r e n t i a l crack. I n t h i s case good agreement between the data and
the c a l c u l a t i o n was given by t h e f l e x u r a l model.
For the slower r a t e s ( F i g . l l c ) , no v i s i b l e cracks were detected a t
a1 1. The measured d e f l e c t i o n curve agrees we1 1 w i t h t h e shear model
applied t o t h e data a t h a l f t h e peak load, but the curve deviates
s i g n i f i c a n t l y f o r t h e data a t peak load. This d i f f e r e n c e could be due t o t h e predominant creep deformation o f t h e i c e around t h e p i le , as observed
by Frederking (1974). This type o f f a i l u r e might be c a l l e d shear creep
f a i l u r e , d i s t i n g u i s h i n g i t from t h e shear f a i l u r e .
For a l a r g e r p i l e diameter ( F i g . l l d ) , t h e f l e x u r e of t h e i c e was expected t o be predominant, since more r a d i a l cracks occurred d u r i n g
loading. This i s confirmed by t h e agreement between t h e measured values and the f l e x u r a l model f o r t h e data a t h a l f t h e peak load. The data measured a t peak load, however, f i t s t h e shear model b e t t e r . This would be associated w i t h more d e t e r i o r a t i o n o f t h e i c e caused by t h e developmenl of several r a d i a l cracks a t f a i l u r e .
Empi r i c a l f ormu 1 a
Based on t h e r e s u l t s presented, combining t h e e f f e c t s of p i l e displacement r a t e , i c e thickness and p i l e diameter on t h e adhesion strength, t h e f o l l o w i n g e m p i r i c a l equation can be formulated,
I 1
I
102
@
f o r the ranges
in
<
1 . 5 ~ 1 0 - ~ mmlsec 30<
d<
145 mn 50<
h<
170 mnFor
in
greater than 1 . 5 ~ 1 0 - ~ mmlsec, a constant value of 1.5~10-* mmlsec should be taken since t h e r e was no f u r t h e r increase i n adhesion strength.Information on measured adhesion strengths o f s a l i n e i c e i n t h e f i e l d i s very l i m i t e d . Recently Vershinin e t a l . (1983) measured an adhesion s t r e n g t h of 194 kPa a t a constant r a t e o f 1 mn/sec f o r a 100 cm diameter p i l e frozen i n t o n a t u r a l sea i c e o f 115 cm thickness i n t h e f i e l d . The mean d a i l y temperature was -14OC, so t h a t t h e average i c e temperature could be estimated as -6"C, which i s s i m i l a r t o t h e present t e s t c o n d i t i o n . Equation ( 7 ) p r e d i c t s an adhesion s t r e n g t h of 300 kPa f o r those conditions. I n f o r m a t i o n on p i l e m a t e r i a l used i n t h e i r t e s t s i s lacking, however, i f t h e m a t e r i a l used i s assumed t o be steel, t h e p r e d i c t e d value could be comparable t o t h e measured value.
5. CONCLUSIONS
The adhesion s t r e n g t h o f wooden p i le s f r o z e n i n t o s a l i n e i c e was measured as a f u n c t i o n o f p i l e displacement rate, i c e thickness and p i l e diameter. The r e s u l t s obtained are as follows;
( 1 ) Two t y p i c a l f a i 1 ure modes were observed; shear f a i 1 ure a t t h e p i le - i c e i n t e r f a c e and f l e x u r a l f a i l u r e i n t h e i c e .
( 2 ) The adhesion s t r e n g t h was observed t o increase w i t h increasing p i l e displacement r a t e , i n c r e a s i n g i c e thickness and decreasing p i l e diameter.
( 3 ) The adhesion s t r e n g t h o f s a l i n e i c e was found t o be less by a f a c t o r o f a t l e a s t 3.5 than t h a t o f freshwater columnar-grained i c e .
( 4 ) A t displacement r a t e s l e s s than
1 0 ' ~
nm/sec t h e adhesion s t r e n g t h measured i s very low, l e s s than 100 kPa.( 5 ) The d e f l e c t i o n curve a n a l y s i s using f l e x u r a l model and shear model was successfully a p p l i e d t o r e l a t e t h e measured d e f l e c t i o n curve t o f l e x u r e and shear i n t h e i c e .
( 6 ) The proposed e m p i r i c a l equation o f adhesion s t r e n g t h was found t o g i v e a comparable value t o the f i e l d data.
ACKNOWLEDGEMENT
The authors wish t o thank J. N e i l , Technical O f f i c e r o f DBR/NRC, f o r
h i s assistance i n performing t h e present t e s t series.
REFERENCES
Construction Norms and Regulations, 1975. SNIP-11-57-75 Loads exerted on
h y d r a u l i c s t r u c t u r e s by waves, i c e and ships. National Research Counci 1
of Canada, Tech. Trans. TT-1968, 1980.
I
I
Frederking, R., 1974. Downdrag loads developed by a f l o a t i n g i c e cover :I f i e l d experiments. Can. Geotech. J., Vol .ll, No.3, p.339-347.
I
Frederki ng, R., 1979. Laboratory t e s t s on downdrag loads developed by
f l o a t i n g i c e covers on v e r t i c a l p i l e s . Proc. 5 t h I n t . Conf. on POAC,
Trondheim, Vol .I I, p.1097-1110.
IFrederking, R. and K a r r i ,
J.,
1983. E f f e c t s o f p i l e m a t e r i a l and loadings t a t e on adhesive s t r e n g t h o f p i l e s i n ice. Can. Geotech. J., Vo1.20, p .673-680.
Lofquist, B., 1951. L i f t i n g f o r c e and bearing c a p a c i t y o f an i c e sheet.
Nat i onal Research Counci 1 o f Canada, Tech. Trans. TT-164.
!
Nakawo, M. and Sinha, N. K., 1981. Growth r a t e and s a l i n i t y p r o f i l e of
f i r s t - y e a r sea i c e i n t h e h i g h A r c t i c . J. Glaciol., Vo1.27, No.96,
p.315-330.
Oksanen, P., 1982. Adhesion s t r e n g t h o f ice. Technical Research Center
of
Finland, Res. Report 123.
Sackinger, W. M. and Sackinger, P. A., 1977. Shear s t r e n g t h of t h e
adfreeze bond o f sea i c e t o s t r u c t u r e s . Proc. 4 t h I n t . Conf. on POAC,
S t . John's, Vol.11, p.607-614.
Saeki
,
H., Ono, T. and Ozaki,
A., 1981. Mechanical p r o p e r t i e s of adhesiors t r e n g t h t o p i l e s t r u c t u r e s . Proc. IAHR I c e Symposi urn, Quebec, Vol .I I,
Saeki, H., Ono, T., Takeuchi, T., Kanie, S. and Nakazawa, N., 1986. I c e forces due t o changes i n water l e v e l and adfreeze bond strength between sea i c e and various material. Proc. 5 t h I n t . Symp. o f OMAE, Tokyo, Vol . I V , p.534-540.
Sinha, N. K., 1981. Rate s e n s i t i v i t y o f compressive strength o f columnar- grained ice. Exp. Mech., Vo1.21, No.6, p.209-218.
Timoshenko, S. and Woinowsky-Krieger, S., 1959. Theory o f p l a t e s and shells. McGraw-Hill Book Co.
Tinawi
,
R. and Gagnon, L., 1984. Behaviour of sea i c e p l a t e s under long term loading. Proc. IAHR I c e Symposium, Hamburg, Vol .I, p.103-112. Vershinin, S. A. e t al., 1983. E f f e c t o f an i c e cover frozen t o thec y l i n d r i c a l support o f offshore o i l w e l l platforms subjected t o water l e v e l f 1 uctuation. National Research Counci 1 o f Canada, Tech. Trans. TT-2041.
Weeks, W. F. and Hami lton, W. L., 1962. Petrographic c h a r a c t e r i s t i c s of
T h i s paper i s being d i s t r i b u t e d i n r e p r i n t form by t h e I n s t i t u t e f o r Research i n Construction. A l i s t of b u i l d i n g p r a c t i c e and r e s e a r c h p u b l i c a t i o n s a v a i l a b l e from t h e I n s t i t u t e may be obtained by w r i t i n g t o t h e P u b l i c a t i o n s S e c t i o n , I n s t i t u t e f o r Research i n C o n s t r u c t i o n , National Research C o u n c i l of Canada, O t t a w a , O n t a r i o ,
KIA
OR6.Ce document est d i s t r i b u g sous forme de t i r e - 8 - p a r t p a r 1' I n s t i t u t de recherche en
c o n s t r u c t l o n . On peut o b t e n i r une l i s t e d e s p u b l i c a t i o n s de 1' I n s t i t u t p o r t a n t s u r l e a techniques ou les recherches e n matisre
d e b l t i m e n t e n Bcrivant B l a S e c t i o n d e s p u b l i c a t i o n s , I n s t i t u t de recherche en c o n s t r u c t i o n , C o n s e i l n a t i o n a l d e r e c h e r c h e s du Canada, Ottawa ( O n t a r i o ) ,