HAL Id: hal-02435001
https://hal-univ-tln.archives-ouvertes.fr/hal-02435001
Submitted on 28 Jan 2020
HAL is a multi-disciplinary open access
archive for the deposit and dissemination of
sci-entific research documents, whether they are
pub-lished or not. The documents may come from
teaching and research institutions in France or
abroad, or from public or private research centers.
L’archive ouverte pluridisciplinaire HAL, est
destinée au dépôt et à la diffusion de documents
scientifiques de niveau recherche, publiés ou non,
émanant des établissements d’enseignement et de
recherche français ou étrangers, des laboratoires
publics ou privés.
biofilm-forming marine bacterium Pseudoalteromonas
lipolytica
Laurie Favre, Annick Ortalo-Magné, Lionel Kerloch, Carole Pichereaux,
Benjamin Misson, Jean-François Briand, Cédric Garnier, Gérald Culioli
To cite this version:
Laurie Favre, Annick Ortalo-Magné, Lionel Kerloch, Carole Pichereaux, Benjamin Misson, et al..
Metabolomic and proteomic changes induced by growth inhibitory concentrations of copper in the
biofilm-forming marine bacterium Pseudoalteromonas lipolytica. Metallomics, Royal Society of
Chem-istry, 2019, 11 (11), pp.1887-1899. �10.1039/C9MT00184K�. �hal-02435001�
PAPER
This journal is © The Royal Society of Chemistry 2019 Metallomics, 2019, 00, 1‐12 | 1Please do not adjust margins
Received 00th July 2019, Accepted 00th 20xx DOI: 10.1039/x0xx00000xMetabolomic and proteomic changes induced by growth
inhibitory concentrations of copper in the biofilmforming marine
bacterium Pseudoalteromonas lipolytica†
Laurie Favre,a Annick Ortalo‐Magné,a,* Lionel Kerloch,a Carole Pichereaux,b,c Benjamin Misson,d Jean‐François Brianda, Cédric Garnierd and Gérald Culiolia,*
Copper is an essential element for living cells but this metal is present in some marine environments at so high concentrations that it can be toxic for numerous organisms. In polluted areas, marine organisms may develop specific adaptive responses to prevent cell damage. To investigate the influence of copper on the metabolism of a single organism, a dual approach combining metabolomics and proteomics was undertaken on the biofilm‐forming bacterial strain Pseudoalteromonas lipolytica TC8. In order to highlight differential adaptation according to the phenotype, the response of P. lipolytica TC8 to copper stress was studied in planktonic and biofilm culture modes under growth inhibitory copper concentrations. As expected, copper exposure led to the induction of defense and detoxification mechanisms. Specific metabolite and protein profiles were thus observed in each condition (planktonic vs biofilm and control vs copper‐treated cultures). Copper exposure seemed to induce drastic changes of the lipid composition of the bacterial cell membrane and to modulate the abundance of proteins functionally known to be involved in copper cell homeostasis in both planktonic and biofilm culture modes. Much more proteins differentially expressed after copper treatment were observed in biofilms than in planktonic cells which could indicate a more heterogeneous response of biofilm cells to this metallic stress.
1. Introduction
Copper (Cu) is a naturally occurring element essential for cellular functions as metal cofactor utilized by a large number of proteins in enzymatic redox reactions and energy production.1 In bacteria, Cu homeostasis depends on a highly
regulated system of transcriptional regulators, soluble chaperones, membrane transporters, and target cuproproteins.2 The subset of these molecules maintaining
beneficial Cu levels varies according to different bacteria.2,3
Recently, Stewart et al. revisited in their review the available evidence related to bacterial trafficking of Cu as nutrient, while Cu is often highlighted for its potential toxicity.4 However, all
organisms need to maintain adequate intracellular levels of Cu due to its high toxicity when present in excess. Cu cell toxicity would be primarily due to inactivation of enzymes with exposed iron‐sulfur clusters, as Cu competes iron for binding sites.5 The
toxic effects of Cu also include the production of reactive oxygen species via the Fenton reaction.6 Both eukaryotic and
prokaryotic cells have thus developed highly balanced mechanisms of Cu homeostasis to prevent cellular damage by maintaining Cu in viable concentrations. In bacteria, these
mechanisms require to provide Cu to cells while preventing its adverse effects: they involve a complex machinery of proteins engaged in various intra‐ and extracellular processes (e.g. sequestration, enzymatic detoxification and active efflux). In Gram‐negative bacteria, the level of Cu in the cytoplasm is regulated through the control of its concentration in the periplasmic space requiring, with the outer membrane, intricate and precisely regulated protein systems interacting with each other.5
Environmentally, Cu is more considered as a pollutant than crucial for cell metabolism because of its widespread presence in aquatic environments contaminated by agricultural, urban7
or mining wastes, industrial discharges or atmospheric deposition,8 especially in coastal areas. Moreover, the recent
expansion of Cu‐based marine antifouling coatings has led to an increase of the threat generated on non‐targeted living organisms and, more broadly, of the overall Cu contamination of marine ecosystems.9,10 Indeed, Cu enrichment factors in
harbours can overpass 50‐fold in the sediment11 and superficial
water.12 The relationship between Cu contamination and boat
traffic was evidenced.13 Therefore, an increase of Cu content
related to the close proximity of marine traffic routes and the peak tourist period was observed in a commercially important bivalve.14 In marine environments, Cu chemical speciation is
known to be strongly controlled by dissolved organic ligands which significantly reduce the Cu bioavailable fraction (and consequently its toxicity) in unpolluted environments such as open seas.15 However, the buffering capacity of organic ligands
can be outreached in Cu contaminated environments, amplifying the impact of this pollutant on marine organisms.16
Consequently, negative effects of Cu have been evidenced on
a. Université de Toulon, MAPIEM EA 4323, Toulon, France. Email adresses :
ortalo@univtln.fr (A. OrtaloMagné), culioli@univtln.fr (G. Culioli).
b. Fédération de Recherche FR3450, Agrobiosciences, Interaction et Biodiversité
(AIB), CNRS, Toulouse, France.
c. Institut de Pharmacologie et de Biologie Structurale, IPBS, Université de Toulouse,
CNRS, UPS, Toulouse, France.
d. Univ de Toulon, Aix Marseille Univ, CNRS, IRD, MIO UM 110, Mediterranean
Institute of Oceanography, La Garde, France.
† Electronic Supplementary Information (ESI) available. See DOI: 10.1039/x0xx00000x
coastal and marine phytoplankton communities at environmentally relevant Cu levels, from observations performed at different spatial scales as well as laboratory experiments in controlled conditions.8,12 Moreover, deleterious
effects have already been shown on marine bacterial communities.17 Their prolonged exposure to Cu can lead to the
selection of Cu‐resistant or ‐tolerant strains.
In this study, a gram‐negative marine bacterium,
Pseudoalteromonas lipolytica TC8, isolated from a natural
biofilm sampled in a Cu‐polluted marine area was selected.18–20
The Pseudoalteromonas genus is well represented in oceans throughout the world and widely studied for its ecological significance or its capacity to biosynthesize extracellular polymeric substances (EPS) and bioactive compounds.21–23 P.
lipolytica TC8 has the ability to form biofilms, what is known for
bacteria to increase their resistance to toxic metals.24,25 In
biofilms, Cu resistance can be multiplied by a factor of 600 in comparison to free‐living cells.26 This increased tolerance was
mainly attributed to metal chelation by EPS, reducing metals bioavailability, and to quorum sensing mediated gene regulation.27
Metabolomics is a powerful tool allowing the visualization in one snapshot of a main part of the metabolome highlighting occurring physiological processes and giving information on “what is happening”. At the same time, analysis of protein expression, function and regulation is a key element to understand “what happened”. A proteomic approach treated with multivariate analysis constitutes a way to overcome the complexity in the whole protein dataset giving a more detailed view of the relationships among samples.28,29
To investigate the influence of Cu on the metabolism and the metabolic pathways of two phenotypes (planktonic cells and biofilms) of P. lipolytica TC8, a global profiling of both metabolites and proteins was done.
2. Experimental
2.1 Reagents
Ethyl acetate for cell extraction was purchased from VWR (Fontenay‐sous‐Bois, France). UPLC‐MS analyses were performed with LC‐MS‐grade acetonitrile (ACN) and water (VWR). Milli‐Q water was generated by a Millipore ultrapure water system (Waters‐Millipore Corporation, Milford, MA, USA). Formic acid of MS grade (99%) and Cu sulfate were purchased from Sigma‐Aldrich (St Quentin‐Fallavier, France).
2.2. Cell growth conditions
P. lipolytica TC8 is a ‐Proteobacteria isolated from a biofilm formed on an artificial surface (PVC) immersed in an anthropized area (Toulon Bay, Mediterranean Sea, 43°06’23’’N‐ 5°57’17’’E).19,20 Cultures were performed at 20°C in three
different media depending on the experiment: Väätänen nine salt solution (VNSS), marine broth (MB) (BD®, Franklin Lakes, NJ, USA) or artificial sea water (ASW) (Sigma‐Aldrich). In Cu exposure experiments, Cu was added to the culture medium from a 1M stock solution of Cu sulfate (CuSO4, 5 H2O) in VNSS
or MB; the volume depending on the desired final concentration. The starter culture of the bacterial strain was done in VNSS or MB at 20°C on a rotator/shaker (120 rpm) until the end of the exponential phase. For planktonic cultures, bacteria from the starter culture were diluted in fresh culture medium at a defined absorbance unit (OD600) for a total volume
of 10 or 50 mL depending on the experiment (dose‐response growth experiments or metabolomic/proteomic analyses, respectively), and incubated until the end of the exponential phase for susceptibility testing and until the stationary phase for metabolomic and proteomic analyses. For biofilms, pre‐ cultured planktonic cells were diluted in fresh culture medium at 0.1 absorbance unit (OD600) in Petri dishes for a total volume
of 10 mL and incubated 48h in static conditions at 20°C.
2.3 Dose response experiments
2.3.1 Determination of bacterial growth inhibition
concentrations (IC50 and IC90). Exponential pre‐cultured
P. lipolytica TC8 cells were suspended in fresh medium at an
OD600 of 0.2 (for a final OD600 seeding of 0.1). A total of sixteen Cu concentrations were tested in a range from 0 to 2000 µM. 100 µL of culture medium enriched with Cu were added in four wells of a 96‐well microtiter plate (sterile transparent PS; Nunc, Fisher Scientific, Illkirch, France). All concentrations were tested in triplicate. The fourth well (in the edge of the microplate) was filled for OD600 control of Cu solutions. Six specific wells were filled with medium without Cu supplement for bacterial growth control (in the center of the microplate). Subsequently, 100 µL of bacterial suspension were inoculated in all wells except the border ones which were only filled with 100 µL of fresh medium. The microplate was incubated under shaking conditions (120 rpm) at 20°C. OD600 was monitored every hour
during 7h using an Infinit 200 microplate reader (Tecan, Lyon, France). The growth rate µ (h‐1) was calculated during the
exponential phase at each Cu concentration according to the equation: N = N0 eµt where “N” is the bacterial density at “t”
time and “N0”, the bacterial density at t0. The percentage of
growth inhibition was then calculated as follows: (µi ‐ µ0 / µ0) x 100 with µi, the growth rate of the bacteria for a
specific Cu concentration and µ0, the growth rate of the bacteria
grown without Cu supplement. After mean and standard deviation calculation per triplicate for each concentration, a sigmoid dose‐response curve [% of growth inhibition = f (log [Cu])] was obtained and the IC50 and IC90
(concentrations that inhibited 50% and 90% of bacterial growth, respectively) were determined using GraphPad Prism (Version 5; GraphPad Software, La Jolla, CA, USA).
2.3.2 Susceptibility testing (determination of LC50 and LC90).
As described above, cultures of P. lipolytica TC8 were done in microplates in MB or VNSS media with a concentration range from 0 to 4500 µM of Cu and incubated at 20°C under shaking (120 rpm). OD600 were measured after 15h. In order to
investigate the bactericidal effect of Cu, 20 µL of suspension from each well where no growth was observed were transferred in the corresponding wells of another microplate
Metallomics Paper
This journal is © The Royal Society of Chemistry 2019 Metallomics, 2019, 00, 1‐13 | 3
Please do not adjust margins
containing each 180 µL of fresh medium. After 15h of shaking incubation (120 rpm, 20°C), OD600 was measured. The LC50 and
LC90 values were determined as the Cu concentrations that
killed 50% and 90% of the bacterial cells, respectively.
2.3.3 Doseresponse adhesion experiments. The starter
culture of P. lipolytica TC8 was grown until the end of exponential phase and then centrifuged (4000 g, 10 min). After removing the supernatant, the pellet was re‐suspended in sterile ASW in order to obtain an OD600 of 0.6 (for a final OD600
seeding of 0.3). Microtiter plates (sterile black PS; Nunc, Fisher Scientific) were then filled as described in part 2.3.1 but with ASW instead of VNSS or MB. After 15h of incubation at 20°C with stirring (120 rpm; to prevent sedimentation), medium and non‐adhered bacteria were eliminated by inversion of the microplate followed by three successive washes (36 g/L sterile NaCl solution, 200 µL per well). The adhered bacteria were stained with Syto 61 red fluorescent dye (Molecular Probes ® Invitrogen; 1 µM, 100 µL per well). After 15 min of incubation in the dark, excess of dye was removed by a washing step (36 g/L sterile NaCl solution, 200 µL per well). Fluorescence intensities were measured with the following parameters: λexc = 620 nm,
λem = 650 nm. The intensity of fluorescence (IF) is proportional
to the quantity of adhered bacteria. Considering an adhesion of 100% for the control wells, adhesion rates were calculated from the fluorescence rates with the following formula: (IFT ‐ IFCu) / (IFBAC ‐ IFB) x 100 with IFT, the mean of fluorescence
intensity of triplicate cultures with Cu at a given concentration (Cu and bacteria in ASW + Syto 61); IFCu, the fluorescence
intensity of the medium with Cu at the same concentration (Cu in ASW + Syto 61); IFBAC, the mean of fluorescence intensity of
the bacterial adhesion control (bacteria in ASW + Syto 61); and IFB, the mean of fluorescence intensity of the medium
(ASW + Syto 61). Then, a sigmoid dose‐response curve [% of inhibition of the adhesion = f (log [Cu])] was obtained and the EC50 (effective concentration inhibiting 50% of adhesion) was
determined.
2.4 Metabolomic analysis
Cultures were done in MB medium with three concentrations of Cu [Ctrl: Control without Cu supplement, Cu‐1000: under IC50
(1000 µM) and Cu‐1400: between IC50 and IC90 (1400 µM)] in
five replicates in planktonic and biofilm modes. Control and Cu‐ treated planktonic cultures were incubated 7h, the time needed to reach the stationary phase without Cu supplement. For control and Cu‐treated biofilm cultures, the incubation was extended to 48h, the time needed to obtain sufficient amounts of biofilm. Such a difference in growth time, and so in exposure time to Cu, was necessary because of the slower cell growth in sessile lifestyle. The aim of this analysis was to obtain the widest information about metabolite (i.e. molecule with a molecular mass < 1500 Da) changes induced by the expression of genes and their protein products in response to Cu stress. The whole metabolomic process (quenching, cell extraction, LC‐MS analysis, data extraction and treatment) was performed as previously described.30,31 Briefly, the extraction step was
performed with ethyl acetate [solvent/bacterial culture, 2:1 (v/v)]. This mixture was shaken (1 min) and sonicated (30 min) at 20°C. The organic phase was collected and dried under N2.
Dried extracts were solubilized in methanol (500 µL) and an aliquot of this solution (5 µL) was analysed by Ultra Performance Liquid Chromatography coupled to Mass Spectrometry (UPLC‐MS). The UPLC‐MS system consisted in a Dionex Ultimate 3000 Rapid Separation (ThermoFisher Scientific, Waltham, MA, USA) chromatographic system coupled to a Q‐ToF MS (Impact II; Bruker Daltonics, Bremen, Germany). Analyses were performed a reversed‐phase column (150 × 2.1 mm, 1.7 μm, Kinetex Phenyl‐Hexyl; Phenomenex, Le Pecq, France) with the following elution gradient: 0‐1 min at 20% of B in A (A: H2O with 0.1% formic acid; B: ACN with 0.1%
formic acid), 1 to 7 min to 100% of B and kept so until 11 min, 11 to 11.5 min to 20% of B and kept so until 13.5 min. Flow rate was set at 0.5 mL/min and the column temperature at 40°C. The electrospray voltage was set at 4500V in positive mode. The sequence of injection followed a specific scheme to allow quality control of data and features filtering. Raw data were pre‐ processed with the XCMS software (version 1.38.0) under R 3.1.0 environment. Redundant signals were suppressed by three successive filtrations thanks to an in‐house script on R. The data were log10 transformed, mean‐centered and analysed
by principal component analysis (PCA) and by partial least‐ square discriminant analyses (PLS‐DA) using the Simca 3.0.3 software. All the supervised models evaluated were tested for over fitting with permutation tests and cross validation of variance (CV‐ANOVA). Identification of compounds was obtained thanks to the analysis of MS/MS data, comparison with MS and MS/MS data available in freely available databases (Metlin, KEGG, PubChem, ChemSpider and LIPID MAPS) and molecular networking (GNPS).
2.5 Proteome analysis in response to Cu stress
P. lipolytica TC8 was cultured in VNSS medium under two Cu
conditions [Ctrl: control without Cu supplement, Cu‐treated: between IC50 and IC90 (700 µM)]. Cultures were performed in
planktonic and biofilm modes in triplicate for each condition. Sample preparation, digestion, nano‐LC‐MS/MS, database search and data analysis were then conducted as previously described.31 Briefly, planktonic and biofilm cultures were
centrifuged two times (4000 g) at 4°C during 15 min. The resulting pellets were then suspended in a lysis buffer [10 mM Tris‐HCl, pH 8.0; buffer/pellet, 5:1 (v/v)] with protease inhibitors (Sigma‐Aldrich, St Quentin‐Fallavier, France). Proteins were extracted by sonication on ice (three cycles of 10s with resting intervals of 10s, 100W). Unbroken cells and aggregated proteins were removed by centrifugation at 14000 g at 4°C for 20 min and protein content was quantified (Bradford based Uptima coo protein assay; Interchim, Montluçon, France). For each sample, a volume containing 100 µg of proteins was precipitated with trichloroacetic acid (final concentration: 10%) and washed with ice‐cold acetone.
Proteome samples were treated with equilibration buffers (dithiothreitol and iodocetamide) and loaded onto a 12% SDS‐ polyacrylamide gel. After staining of the gel (Instant Blue;
Invitrogen), bands were excised, digested in a solution of modified trypsin (60 µL) in 25 mM NH4HCO3 (Promega,
Charbonnières, France) and incubated overnight at 37°C. A Dionex nanoRS UHPLC system coupled to an LTQ‐Orbitrap Velos MS (ThermoFisher Scientific) was used to analyse the peptide mixtures. An aliquot (5 µL) of each sample was injected in a pre‐ column (C18, 300 µm x 5 mm; Dionex) and eluted (2% acetonitrile with 0.05% trifluoroacetic acid) at 20 µL/min during 5 min. The system was then switched on line to an analytical column (C18, 75 µm x 15 cm; in‐house packed) equilibrated with 95% of eluent A (5% acetonitrile with 0.2% formic acid) and 5% of eluent B (80% acetonitrile with 0.2% formic acid). A linear eluent gradient (from 5 to 50% of B) with a flow rate of 300 nL/min was applied during 105 min MS data were obtained using the data‐dependent acquisition mode (Xcalibur software). Survey scan MS spectra were acquired (300‐2000 m/z range, resolution: 60000) and the 20 most intense ions per scan were fragmented and analysed.
MaxQuant software (version 1.5.3) was used to process the resulting MS data. Derived peak lists were submitted to the Andromeda search engine (precursor mass tolerance: 20 ppm for first searches and 4.5 ppm for main Andromeda database searches) and data were searched against Uniprot P. lipolytica (fragment ion mass tolerance: 0.5 Da). The following parameters were used: enzyme: Trypsin/P, missed cleavages: 2, variable modifications: oxidation of methionine and protein N‐ terminal acetylation, fixed modification: carbamidomethylation of cysteine, minimum peptide length: 7, minimum number of unique peptides: 1, maximum false discovery rate: 1%. The label‐free quantification (LFQ) metric was used to perform the relative quantification of proteins. Only proteins quantified in all the replicates in at least one of the biological conditions were considered for further processing and statistical analysis. Statistical analysis was then applied to the LFQ values. Significant proteins were those with a p‐value < 0.01 and a ratio of average normalized area < 0.5 and > 2. Multivariate analyses were performed (Simca software, version 3.0.3, Umetrics AB, Umeå, Sweden) by PCA, PLS‐DA and orthogonal partial least square discriminant‐analysis (OPLS‐DA). Permutation tests and CV‐ANOVA were used to evaluate over fitting of the methods. The gene ontology (GO) database in UniProtKB was used for functional annotation of the differentially expressed proteins.
2.6 Cu chemical speciation
Cu chemical speciation was studied in VNSS and MB media by pseudo‐polarography. A detailed description of the experimental protocol used in this study is provided in SI. Briefly, Cu additions (25 to 2500 nM) were performed in VNSS and MB media 1000‐fold diluted in UV‐irradiated seawater (collected outside the Toulon Bay: ambient Cu concentration of 2.5 nM) at pH 8.0 ± 0.2 (using borate buffer; Suprapur, Merck, Darmstadt, Germany). Pseudopolarograms were recorded in order to distinguish the labile Cu fraction (i.e. corresponding to the most bioavailable fraction) from the dissociable and inert ones, as previously described.32
3. Results and discussion
3.1 Dosedependent effect of Cu on planktonic cell growth and biofilm formation
Bacterial resistance and/or tolerance to heavy metals can be defined as the capacity of bacteria to continue growing, or at least surviving, in the presence of such metallic elements. Cu resistance can be thus considered when the bacterial growth rate is not under 95% of the control growth rate (culture without metal supplementation). Under that level, a decreasing growth rate shows a growth inhibition. Cu effect on P. lipolytica TC8 planktonic cultures was determined thanks to the comparison of its growth rates under a range of Cu concentrations in two culture media, VNSS and MB (Figure S1). Growth inhibition was noticed from 100 µM and increased with levels of Cu in a concentration‐dependent manner. The IC50 and
IC90 values were determined as 660 and 877 µM in VNSS,
respectively and 1313 and 1808 µM in MB, respectively (Table 1, Figure S1). Growth inhibitory concentration values were thus nearly two times higher in MB than in VNSS. These results could be correlated with a higher Cu binding capacity of MB medium components.33
Pseudopolarography analysis of Cu chemical speciation on both media (Figure S2) confirmed this tendency. At low total Cu levels (< 50 nM in 1000‐fold diluted medium), the labile Cu fraction
(i.e. the sum of free Cu ions and inorganically bound Cu, corresponding to the most bioavailable Cu fraction) represented less than 5% in both media: the Cu speciation seemed to be mostly controlled by non‐labile forms (i.e. dissociable and inert complexes), probably not bioavailable for bacteria. These results suggested that, in such conditions, bacterial cells were exposed to 20‐fold lower Cu levels than those initially expected. When increasing the total Cu concentration to µM levels, the labile fraction progressively increased (up to 33% in VNSS) due to a progressive saturation of the organic ligands present in the culture media (Figure S3). However, the increase of labile Cu was less pronounced in MB compared to VNSS, explaining the higher IC50 and IC90 values
determined in this culture medium. Such a difference therefore probably incomed from a change of trace metals speciation in each medium due to the different composition in organic compounds, modulating trace metals bioavailability.
The effect of Cu on the bacterial viability has been analysed and lethal concentrations LC50 and LC90 were determined
(Table 1, Figure S4). Lethal concentration values were again higher in MB than in VNSS but with a smaller gap (around 1.3).These values could not easily be compared with equivalent data found for other bacteria mainly because of huge differences induced by the culture media in Cu speciation. These differences led indeed to various levels of bioavailability, and thus toxicity, of the metal added to the medium.34,35 Medium IC50 (µM) IC90 (µM) LC50 (µM) LC90 (µM) VNSS 660 877 1611 1829 MB 1313 1808 2100 2321 Table 1: P. lipolytica TC8 susceptibility to Cu in planktonic cultures (VNSS and MB media)
Metallomics Paper
This journal is © The Royal Society of Chemistry 2019 Metallomics, 2019, 00, 1‐13 | 5
Please do not adjust margins
Nevertheless, these data obtained with P. lipolytica TC8 gave inhibitory concentration values close to those reported in a previous study for various bacterial species cultured over a range of Cu concentration from 1000 to 3000 µM.34 For
P. lipolytica TC8, it could be pointed out that LC and IC values
were found in a close range in both media with lower LC/IC ratios in MB (LC50/IC50 = 1.60 and LC90/IC90 = 1.28) than in VNSS
(LC50/IC50 = 2.44 and LC90/IC90 = 2.08).
P. lipolytica TC8 was previously shown to form surface‐
adhered biofilms.19 Effect of Cu on the ability of this strain to
adhere to a surface was thus examined. The effective concentration (EC) that inhibited 50% of the adhesion of
P. lipolytica TC8 (EC50) was determined as 707 µM in ASW
medium in static culture conditions (Figure S5). A full adhesion of P. lipolytica TC8 cells was observed at Cu concentrations lower than or equal to 400 µM. Adhesion remained strong until 600 µM and dropped from 700 µM. No adhesion was observed beyond a concentration of 800 µM.
These first steps towards understanding the susceptibility of
P. lipolytica TC8 to Cu were necessary to define the Cu
concentrations relevant to examine, in subsequent studies, the effects of this metal on both the metabolome and the proteome of this bacterial strain.
3.2 Metabolome stress response under Cu exposure
A non‐targeted metabolomic study was conducted on organic extracts of P. lipolytica TC8 grown for 48h in biofilm or 7h in planktonic conditions. Cells were exposed to Cu concentrations of 0 (Ctrl), 1000 (Cu‐1000) and 1400 µM (Cu‐1400).
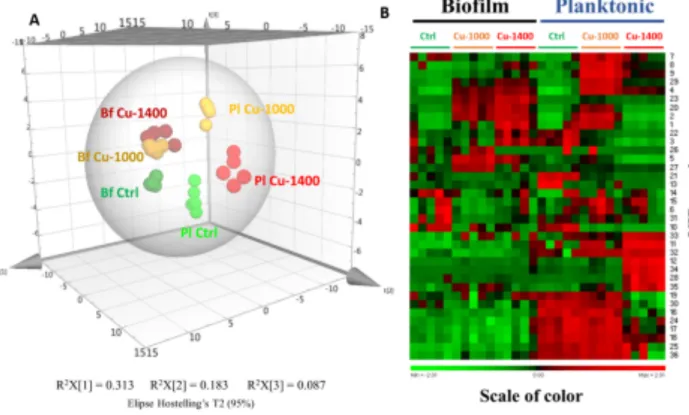
The total dataset obtained after analysis, data extraction and filtration (980 m/z features) was treated by principal component analysis (PCA) in order to assess grouping and trends among samples (Figure S6). Results obtained from the PCA score plot showed a clear discrimination of samples according to: (i) culture conditions (planktonic vs biofilm, first component: 31.3% of the total variance) and (ii) Cu concentrations when bacterial cells were grown in planktonic conditions (control and Cu‐1000 vs Cu‐1400, second component: 18.3%of the total variance). A six‐class partial least squares discriminant analysis (PLS‐DA) model was then built in order to determine the compounds implied in the discrimination between samples (Figure 1A). R2Xcum (0.727) and
R2Ycum (0.960) values showed the goodness of fit of the model
while the Q2Ycum value (0.799) showed its good predictability.
The cross validated analysis of variance (CV‐ANOVA) and permutation test allowed the statistical validation of the model (Table S1). The different samples were discriminated in the same way as observed in the PCA model. It also can be noticed that the third component (8.7% of the total variance) of the PLS‐ DA score plot allowed the discrimination of biofilm samples cultured with or without Cu supplement. Nevertheless, the three classes of biofilm samples were less separated than the planktonic ones. In order to consider all the components of the model, clustering was performed using Hierarchical cluster analysis (HCA) where each component was weighted with its eigenvalue (value that gives the variance of the component)36
(Figure S7). The highest level of discrimination occurred between biofilm and planktonic samples. Then, in planktonic samples, a clear distinction was observed between Cu‐1400
Figure 1: (A) 3D PLS‐DA score plot based on UPLC‐HRMS metabolomics data of planktonic (Pl) and biofilm (Bf) samples of P. lipolytica TC8 cultured without (Control: Ctrl) and with Cu supplement (1000 µM: Cu‐1000, 1400 µM: Cu‐1400). (B) Heatmap of the thirty‐eight differential metabolites (VIP score value > 1) from the PLS‐DA model (#3) of biofilm and planktonic control (Ctrl) or Cu‐treated (1000 µM: Cu‐1000, 1400 µM: Cu‐1400) cultures of P. lipolytica TC8.
cultures and all the others. The discrimination between control and Cu‐1000 planktonic samples was more pronounced than the distinction between biofilm samples obtained with or without Cu supplement. Moreover, no discrimination was observed between metabolomes of Cu‐treated biofilm samples (Cu‐1000 and Cu‐1400 conditions). The metabolic differences observed between planktonic and biofilm cultures of
P. lipolytica TC8 were expected.31 The present results showed
that, in the Cu concentration range tested, the culture mode had more influence on the metabolome than Cu exposure. Moreover, metabolic profiles of biofilm and planktonic cultures did not converge under Cu stress. A similar conclusion was previously reached for Pseudomonas fluorescens.37 However,
for P. fluorescens, the most important metabolic shift was observed in biofilm cultures exposed to Cu and not in planktonic ones as for P. lipolytica TC8.
The importance of each metabolite on the PLS‐DA discrimination was determined thanks to its variable importance in projection (VIP) score value. Metabolites were considered as discriminant when their VIP score value was higher than one. In the first PLS‐DA model (#1), about 300 m/z features were in this case. In order to determine the more relevant compounds, a new PLS‐DA model (#2) was generated keeping only these features (with a VIP score > 1). This step was done two times successively and the third model (#3) was conserved being the more descriptive and predictive (statistic validation presented in Table S1). Going further with a subsequent model decreased these abilities. On the 6‐class PLS‐ DA model (#3), 36 metabolites had a VIP score value greater than one. Thanks to the clustering observed in the heatmap (Figure 1B), 21 of them were considered as characteristic of a phenotype and/or a Cu exposure condition. A molecular formula was determined for 21 of them and eleven were putatively identified thanks to previous works30,31 (Table S2).
Five metabolites were over‐produced in planktonic Cu‐1400 conditions. Three of them were identified as phosphatidylethanolamines (PEs) (VIPs n°11, 12 and 34). In
P. lipolytica TC8, this type of compounds was previously shown
to be more specifically biosynthesized in biofilms than in planktonic cultures.31 Seven metabolites were under‐expressed
in planktonic Cu‐1400 conditions and not expressed in biofilm samples. Almost all were ornithine lipids (OLs) (VIPs n°16 to 19, 24 and 30) and most of them (except VIP n°19) exhibited slightly shorter saturated or mono‐unsaturated acyl chains than the OL (VIP n°35) significantly more produced at the highest Cu concentration (Cu‐1400). The clustering also revealed that three
m/z features were over‐produced in planktonic Cu‐1000
samples (VIPs n°7, 8 and 9), two were over‐produced in biofilms Cu‐1000 condition (VIPs n°5 and 23) and finally, four were over‐ produced in biofilm cells whatever the Cu concentration and in planktonic Cu‐1000 cells (VIPs n°1, 2, 4 and 29). The expression of these last metabolites was not enhanced when Cu concentration was increased in planktonic Cu‐1400 cultures. Two of them, VIPs n°1 and n°2, seemed to be part of the same chemical family. Their molecular formulae were C21H19N4O3 and
C21H19N4O4, respectively, and they both showed a MS2
fragmentation pattern with a neutral loss of m/z 174 [C9H6N2O2].
In presence of Cu (1400 µM: Cu‐1400), the increase of PEs biosynthesis (previously found to be more characteristic of
P. lipolytica TC8 biofilm cells)31 by planktonic cells was
associated with a global decrease of the synthesis of OLs (previously found to be more characteristic of planktonic cells of P. lipolytica TC8)31 with shorter acyl chains. These results
suggested that one of the defence responses of the planktonic cells could be the switch to a similar membrane metabolism than that of sessile cells. This hypothesis was in accordance with a previous study on P. aeruginosa cells showing a slight increase of long chain PEs in sessile organisms as compared with their planktonic counterparts. The promotion of the synthesis of long chain lipids in biofilms can be related to an increase of the stability of the lipid bilayer by increasing lipid‐lipid interactions and thereby reducing the membrane fluidity.38 Such a
modification of the membrane composition in response to Cu can be related to an increased resistance capacity of bacteria at their interface with Cu. Indeed, considering that the metal/bacteria interface is suggested to damage the cell envelope and then makes the cell susceptible to other damages,39 an increase of the membrane stability could be one
of the adaptive defence mechanisms against Cu. Also these type of lipids with small head groups are known to induce the curvature and the destabilization of a bilayer membrane resulting in non‐bilayer arrangement or inverted micelles.40
These types of structure facilitate the insertion of proteins in membranes. However, differences in acyl chain lengths of the identified lipids (over‐ or down biosynthesized) were here not enough to conclude on the modification of the membrane stability of cells under Cu stress.
The augmentation of PEs production induced by metal stress (aluminium) has already been observed in Pseudomonas
fluorescens.41 In this study, the authors suggested that the
bacteria elaborated exocellular PEs in order to help the immobilization of aluminium. A similar hypothesis could be formulated for P. lipolytica TC8 with Cu. Also Jiang et al showed that Cu2+ was reduced to Cu+ when bound with the negatively
charged phosphate group of phospholipids.42 Finally a complex phospholipid‐diCu‐phospholipid was formed and explained the effect of Cu on the membrane fluidity. The distribution of biomarkers between biofilm samples was not as clear as that observed in the case of planktonic ones, but several tendencies could be distinguished. There was no specific metabolite found for the Cu‐1000 and Cu‐1400 cultures, but some metabolites were clearly linked to the presence of Cu, whatever its concentration. This apparent lack of gradual effect of Cu concentrations on the biofilm cell metabolism could be due to the long exposure time and to an heterogeneous metabolic activity within the biofilm.24,43 As previously shown
for P. aeruginosa, such a heterogeneity could come from different cell types (fast‐ and slow‐growers or persisters) living together within a heterogeneous colony. They can be differentially tolerant to Cu but give a non‐differentially metabolic expression when submitted to a Cu exposure for a
Paper Metallomics
This journal is © The Royal Society of Chemistry 2019 Metallomics, 2019, 00, 1‐12 | 7
Please do not adjust margins
Please do not adjust margins
long time.24 This metabolomic study demonstrated the
differential metabolic responses to a Cu stress of planktonic and biofilm cells of P. lipolytica TC8. As a significant metabolic shift could be the result of changes in gene expression or in regulation of transcript levels, in order to study the Cu effect at the protein level, a quantitative proteomic analysis was then performed on a similar set of P. lipolytica TC8 cultures.
3.3 Proteome analysis in response to Cu stress
Quantitative proteomic approaches were applied to study and compare the responses to Cu stress of P. lipolytica TC8 in planktonic and in biofilm cultures. In both cases, cells were grown for 7h and 48h respectively, in VNSS, in absence/presence of a same single sublethal Cu concentration of 700 µM, chosen as the approximate IC50 in this medium and
corresponding to the EC50 determined in the adhesion test in
ASW (Table 1, Figures S1 and S5).
3.3.1 Proteome quantification and profiling. A total of
2 114 proteins were identified in the whole cell lysates. Of this set of proteins, 1 796 (almost 85% of the whole dataset) were identified with at least two unique peptides, and among them, 1 606 with three or more unique peptides. The whole proteome identified for the strain P. lipolytica TC8 was relatively compact (approximately 53%) compared to the complete set of proteins encoded by the sequenced P. lipolytica SCSIO 04301 strain and provided by UniProt (3 974 protein encoding genes).44 When
considering only proteins identified in all replicates of each culture condition, the same number (slightly more than 1 600 proteins per culture condition) was found. Only the proteins common to the three replicates were considered for the subsequent analyses. Most of them (1 395, i.e. ~75%) were shared by the four culture conditions (Venn diagram, Figure S8). The Venn diagram revealed also that 81 (4.3%) proteins were only observed in absence of Cu while 137 (7.3%) proteins were only observed in the Cu‐treated cultures (planktonic and/or biofilm cultures).
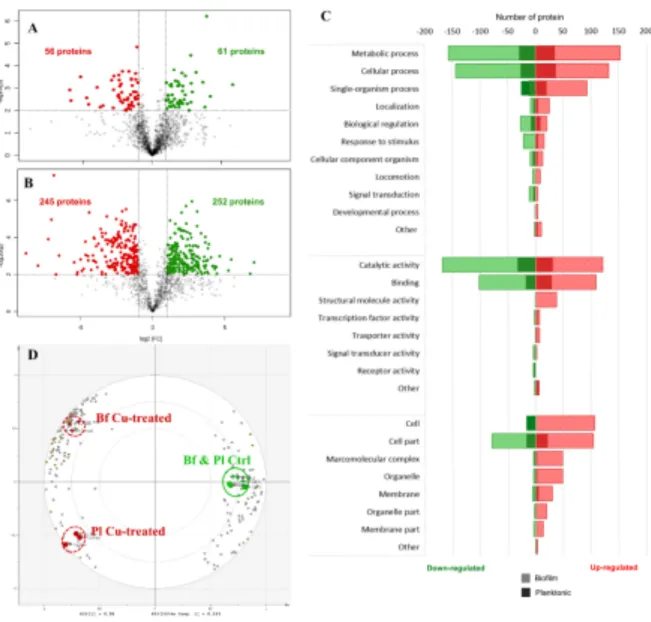
Many proteins were identified as significantly differentially expressed under Cu treatment and this was particularly the case in biofilms. In fact, with the following restrictive criteria, fold change (FC) > 2 and p‐value < 0.01 (using the Student’s t‐test), a total of 56 proteins were identified as up‐regulated and 61 were down‐regulated in planktonic lifestyle in response to Cu exposure (Figure S9) and around four times more proteins were identified as up‐ or down‐regulated in biofilms (245 and 252, respectively). Volcano plots were then used to visualize proteins categorized as up‐ or down‐regulated based on the 2‐FC threshold and to display their statistical significance based on the t‐test with peptide‐level replicates [x‐axis log2 FC (Cu‐ treated/control), y‐axis = ‐log10 p‐value; Figures 2A and 2B]. All these significantly differentially expressed proteins by at least a 2‐FC are listed in Tables S3 and S4 for biofilm and planktonic proteomes, respectively. The highest FC range was exhibited in biofilm cultures with values from ‐131 to +438 since the maximal FC in planktonic culture condition was limited to +64. Common proteins between planktonic and biofilm cells involved in cellular responses to Cu and differentially expressed
were investigated and identified (Table S5 & Figure S9). The resulting distribution in the Venn diagram (Figure S9) showed twenty‐one common up‐regulated proteins while eighteen proteins were commonly down‐regulated. The influence of the culture mode can be analysed with the different FC values of the expression of these proteins in the two culture modes. Generally, the FC values were more dramatic in biofilm cultures.
3.3.2 Functional annotation of proteins. The predicted
global proteome was composed of 16% (335 out of 2 114) of the proteins with unknown function. Among the differentially expressed proteins, 69 (57 in biofilm and 12 in planktonic cultures exposed to Cu) could not be assigned any function. The bioinformatics analysis of the identified and functionally assigned proteins was performed on all differentially expressed proteins by more than 2‐FC in response to Cu (p‐value < 0.01). This allowed to cluster proteins in functional categories based on the Gene Ontology (GO) database (Figure 2C). Proteins from each cell culture condition belonged to over ten functional categories. Biological process profiles and molecular function profiles of planktonic and biofilm proteomes were highly similar in term of GO distribution. Genes influenced by Cu in both culture modes were highly correlated to metabolic and cellular processes with about 65% of the total proteins identified. Most of them were related to catalytic activities and binding. A more detailed analysis of the proteome dataset revealed that the presence of Cu in the culture medium modulated the abundance of specific proteins functionally involved in Cu cell homeostasis in both planktonic and biofilm modes. In Gram‐ negative bacteria, many membrane‐embedded transporters (traversing either one membrane or both inner and outer membranes) participate in metal translocation across cell layers. They include ion gradient‐ (like H+ gradient‐) and ATP‐ driven transport systems belonging to four superfamilies. While ATP‐binding cassette (ABC) transporters mediate the accumulation of specific metal ions in the cytosol of bacterial cells, the export (efflux) of these metal ions is largely carried out by P‐type ATPases, resistance‐nodulation‐cell division (RND) transporters and cation diffusion facilitators (CDFs).5,45 Proteins
of the first three superfamilies cited above have been identified among the differentially expressed proteins by P. lipolytica TC8 in response to Cu exposure. Among all these various related different types of Cu transport proteins, the most ubiquitous ones in bacteria are Cu exporting P‐type ATPase.45 The major P‐
type ATPase Cu exporter is the cytoplasmic CopA efflux pump which transports the excess of Cu from the cytoplasm to the periplasm. Such a transporter was identified in this study (Z5XLJ3) and was similarly up‐regulated in both planktonic and biofilm Cu‐treated cells with a FC of around +16 (Table S5). Two other related Cu‐binding proteins, CopB (Z5XN39) and CopC (Z5XNW4) were also identified. The outer membrane CopB, which has putative roles in Cu translocation, was only present in all the replicates of biofilm Cu‐treated cultures (Table S3).
The periplasmic CopC was found as an over‐expressed protein in both planktonic and biofilm Cu‐treated samples with FC values of +161 and +90 (Table S5), respectively. This protein either sequesters the metal or traffics it to Cu‐binding proteins (e.g. CopD located in the inner membrane, not identified here) or to the extracellular space via a RND‐family Cu efflux system.46
The RND superfamily includes Gram‐negative bacterial efflux transporters of different substrates, such as heavy metals, hydrophobic drugs or lipopolysaccharides.47 They are essential
to the multi‐drug resistance observed in many pathogens and are typically assembled as tripartite efflux complexes ions.48
Hence, RND‐type efflux system can also, like P‐type ATPase, be involved in Cu detoxification by having a specificity for heavy metals and carrying out their export. The assembled subunits of this system span the cellular envelope from the cytoplasmic membrane across the periplasm to the outer membrane, which allows Cu translocation to the cell exterior, and not to the
periplasm. Moreover, the RND transport system is coupled to a different energy source, as it depends on energetically favourable transfer of protons or other ions. Five RND transporters were herein identified (Z5XMF1, Z5XPZ1, A0A0P7E415, Z5XWK7 and Z5XKM1) under this name or as cation transporters. Two of them were up‐regulated in both planktonic and biofilm Cu‐treated cells. Z5XMF1 was quantified with a FC of +32 in biofilms while its ratio was about 2‐fold lower in planktonic cells (FC +17). Z5XPZ1 displayed similar FC of about +5 in both biofilm and planktonic cells (Tables S3, S4 & S5). In Gram‐negative bacteria, the tripartite organization of RND transporters is shared by most of the multidrug transporters. The assembled complex includes a transporter, often referred as the RND “pump” protein and located in the inner membrane, an adapter protein, often referred as the membrane fusion protein (MFP), and an outer membrane factor (OMF).49 In the
well‐known CusCBA efflux system found in E. coli and conferring
Figure 2: Volcano plots representing changes in protein expression with the fold change (x‐axis) against the log2 p‐value (y‐axis) of all quantified proteins in (A) planktonic and (B) biofilm cultures of P. lipolytica TC8. Up‐ and down‐regulated proteins are coloured in red and green, respectively. (C) Function classification (based on gene ontology) of significantly up‐and down‐regulated proteins in P. lipolytica TC8 biofilm and planktonic cells exposed to Cu. (D) Biplot representing distribution of the 200 proteins with a VIP score > 1 of the OPLS‐DA model supervised with 2 classes (Control vs Cu‐treated samples).
Metallomics Paper
This journal is © The Royal Society of Chemistry 2019 Metallomics, 2019, 00, 1‐13 | 9
Please do not adjust margins
resistance to Cu and silver ions, a fourth component of a tetrapartite system is a periplasmic metallochaperone (CusF, 10 kDa). This Cu‐binding protein may play a dual protective role by removing the excess of Cu from the periplasm by sequestration and by delivering this metal to CusCBA, thus enhancing its export.50,51 Here, a Cu chaperone (A0A0P7DXF0)
and an outer membrane channel protein TolC (Z5XTK0) were identified. The last one was up‐regulated in biofilm Cu‐treated cells (FC +2.2). Their presence completed the report of efflux proteins referenced as RND transporters. It must be noted that TolC could also be associated with other efflux pumps. Indeed, TolC, the most widely studied OMF from E. coli, is known to be an RND efflux transporter component. But, as an outer membrane component of Gram‐negative efflux systems (OMF), TolC is interchangeable between various systems and can thus function with different pumps as in the case of the HlyBD‐TolC efflux system.52 This hemolysin export system is known to
secrete hemolysin A by a type I system across both membranes of E. coli and consists of the inner membrane ATPase hemolysin B (HlyB) and the MFP hemolysin D (HlyD).47,52 Thus, TolC could also belong to this other trimeric efflux complex in P. lipolytica TC8. This was consistent with the results showing the presence of hemolysin D (Z5XN79) which was equally over‐expressed in both planktonic and biofilm proteomes under Cu treatment (FC of +37 in each condition) (Table S5). Other hemolysin D proteins were identified (Z5XT90, Z5XRN0 and A0A0P7DX95), the last one being over‐expressed in Cu‐treated biofilms (Table S5).
Through the identification of P‐type ATPase proteins (CopA) and RND transporters (with heavy metal specificity), the most common Cu efflux systems have been highlighted in P. lipolytica TC8 proteome. As indicated above, Cu translocation involves also influx mechanisms, such as that driven by periplasmic binding ABC transporters. These proteins are, as P‐type ATPase transporters, embedded in the inner membrane and use the energy of ATP hydrolysis on the cytoplasmic side. To drive metal influx from the cell exterior to the cytosol, ABC transporters partner with proteins including a periplasm‐spanning complex composed of TonB, ExbB, and ExbD.37 This family of three
cytoplasmic membrane proteins has been termed TonB‐ dependent receptors. Here, various ABC transporters playing different roles have been identified (Z5XVV6: iron ABC transporter substrate‐binding protein, Z5XSK7: ABC transporter ATP‐binding protein, Z5XV11: amino acid ABC transporter substrate‐binding protein, Z5XSK4: phosphate ABC transporter substrate‐binding protein). All these transporters were significantly down‐regulated in biofilm Cu‐treated proteomes.
Moreover, two systems of functionally associated proteins were identified as TonB‐dependent outer membrane receptors (Z5XSX1 and A0A0P7D8Y1). Z5XSX1 was the most down‐ regulated protein in biofilm Cu‐treated proteomes (FC ‐131) while the FC between planktonic Cu‐treated and control proteomes was lower (FC ‐14). A0A0P7D8Y1, a TonB‐dependent receptor expressed in biofilm control cultures but not under Cu conditions, was also highly under‐expressed (FC ‐44). As
expected in this study, while Cu efflux system proteins were determined as up‐regulated, the corresponding influx proteins were down‐regulated. As part of TonB‐dependent receptors, an ExbD protein was also identified (Z5XWD3) in Cu‐treated biofilms without any significant differential expression (Table S3).
Looking more widely at the differentially expressed proteins under Cu treatment, a succinate semi‐aldehyde dehydrogenase (Z5XVI2) with the highest differential expression in biofilm culture conditions (FC biofilm +438 & FC planktonic +2.4) was identified. Another protein (Z5XKL5) with the same function was identified with similar FC (+2.3) in planktonic and biofilm Cu‐treated proteomes. An oxidoreductase activity of these enzymes, and thus a protection against oxidative stress, would be expected. Two other oxidoreductase enzymes, a glyoxalase (Z5XKK6) and a nitrate reductase (Z5XP26), were also over‐ expressed in Cu‐treated biofilms (Table S3). The following highest differentially over‐expressed protein in sessile cells was identified as an ATP‐dependent zinc metalloprotease FtsH (A0A0P7E5B7, FC +247). This cytoplasmic membrane‐bound protease is essential for the viability of bacterial cells through various functions, including a regulatory role in stress responses.53 In addition, when considering the Cu effect on
planktonic proteomes, we identified a RNA polymerase sigma factor RpoS with the highest differential expression (FC +63). This sigma factor is induced as cells enter the stationary phase of growth and is primarily involved in the regulation of stress response systems necessary for their survival under hunger conditions.54 Identification of RpoS in planktonic proteomes (all
replicates concerned) was thus in accordance with the stationary growth phase state of cultures when stopped for the proteomics analysis and its over‐expression in planktonic Cu‐ treated samples could be induced by the presence of Cu. A second transcription factor regulator, belonging to the Fis family transcriptional regulator (Z5XPD5), was over‐expressed in Cu‐treated planktonic cultures. In a wider view of all the proteins differentially expressed in both culture modes in response to Cu treatment, we found several proteins involved in transport, transcription, translation, amino acids metabolism, motility and cell division. In a previous study mainly conducted on the polar metabolome of Pseudomonas fluorescens, the amino acid metabolism was affected in presence of Cu in planktonic and biofilm cells.37 The authors suggested, for
planktonic cells, a link with an increased proteins synthesis in order to replace damaged ones and to synthesize stress proteins. In biofilm, it may be related to an increase of secreted proteins as components of the biofilm matrix.
3.3.3 Multivariate analysis on the proteome data. To have an
additional view on key proteins than through the sole analysis of their FC values, LC‐MS data of the significantly regulated proteins in biofilm and planktonic cultures (up‐ or down‐ expressed by at least 2‐FC with a p‐value lower than 0.01) were analysed with multivariate statistical methods. The score plot of the resulting PCA (Figure S10) showed a clear distinction along
the first component (59.7% of the total variance) between the proteomes of bacteria treated or not with Cu. The second component (18.2% of the total variance) allowed the discrimination of samples according to the culture mode. A supervised PLS discriminant analysis was then conducted assigning two groups of samples (control vs Cu‐treated). Clustering was then performed using HCA where each of the four components of the PLS‐DA was weighted with its eigenvalue (Figure S11). The model allowed the discrimination of samples obtained from the four culture conditions. While in metabolomics the highest discrimination was observed between planktonic and biofilm samples whatever the Cu concentration, the contrary was observed in proteomics since the predominance of the Cu effect beside the culture mode was shown. Analysis of the changes in proteome face to Cu exposure in the two culture modes was achieved separately by focusing on the value of the FC of each protein. Here, in order to focus on the common response of biofilm and planktonic cells to Cu, an orthogonal projection to latent structures‐discriminant analysis (OPLS‐DA) was generated [Model (#1), not shown]. The aim was to maximize the clustering between control and Cu‐treated cultures. This allowed to minimize variations between samples of one condition and thus to highlight differences due to Cu exposure. The 200 proteins with a VIP score value higher than one were only considered to build a second statistical model (#2). Quality parameters of these two OPLS‐DA models were summarized in Table S1. The resulting biplot (Figure 2D) showed
the distribution of these 200 variables within the samples. Such an analysis highlighted differences in the level of proteins expression according to the presence or absence of Cu but also the differential response of planktonic and biofilm cells. The most discriminative proteins were identified using a sigmoid plot (Figure S12). In this representation, the loading plot of each protein was displayed combining covariance and correlation coefficients. To be more selective, the twenty most discriminant proteins of model (#2) were selected (listed in Table 2). It appeared firstly that, on some given discriminative proteins, Cu effect was the same in terms of up‐ or down‐regulation in both biofilm and planktonic proteomes. Among the twenty first VIPs, only four corresponded to down‐regulated proteins, all others being up‐regulated in response to Cu treatment. Cu resistance proteins, CopA and CopC previously mentioned and specific of cell response to Cu, have been recovered (VIPs n°2 and n°5, respectively). An argininosuccinate synthase (Z5XR77, VIP n°3) was also highlighted. This enzyme, involved in arginine biosynthesis from citrulline and aspartate in the urea cycle, was down‐regulated in biofilm (FC ‐5) and planktonic (FC ‐11) samples under Cu treatment. This result was in agreement with a previous study on Bacillus subtilis which shows such a strongly down‐regulation of arginine biosynthesis during Cu stress.55 An
arginine decarboxylase (Z5XKU5) and an arginase (Z5XPB5) linked to arginine metabolism and specifically its catabolism, have also been identified (Table S3). They were significantly down‐regulated in biofilm Cu‐treated samples compared to controls (FC ‐2.7 and ‐25, respectively). Table 2: List of the common and most significant proteins (VIP score value > 1.5) up‐ or down‐regulated in biofilm (Bf) and planktonic (Pl) Cu‐treated cultures in comparison with controls (Ctrl). VIP number Protein IDa Protein name Molecular weight (kDa) Fold change Bf Cutreated/ Bf Ctrl Fold change Pl Cutreated/ Pl Ctrl 1 Z5XLV1 Uncharacterized protein 17.8 21.1 24.5 2 Z5XLJ3 Copper resistance protein CopA 67.6 16.9 16.1 3 Z5XR77 Argininosuccinate synthase 43.6 ‐5.0 ‐11.1 4 Z5XMZ8 ATP synthase subunit beta 49.7 5.8 2.3 5 Z5XNW4 Copper resistance protein CopC 15.1 89.6 161.0 6 Z5XQI4 Polyribonucleotide nucleotidyltransferase 76.2 21.1 24.5 7 Z5XM39 60 kDa chaperonin 57.3 6.1 2.7 8 A0A0P7EE38 Flagellin 33.5 ‐2.4 ‐4.3 9 Z5XN54 Trigger factor 47.7 5.3 1.6 10 Z5XQ72 50S ribosomal protein L1 24.8 6.3 1.6 11 Z5XP56 Long‐chain fatty acid‐‐CoA ligase 79.7 6.4 1.5 12 Z5XYN4 CTP synthase 60.2 ‐8.3 ‐1.7 13 Z5XKE6 Alkyl hydroperoxide reductase 22.6 3.3 7.7 14 Z5XKT4 50S ribosomal protein L5 20.2 7.1 1.4 15 Z5XW52 6,7‐dimethyl‐8‐ribityllumazine synthase 16.1 9.0 1.8 16 Z5XN71 Phosphate transport regulator 26.0 17.4 1.6 17 Z5XSH6 Protein GrpE 22.6 5.8 2.1 18 Z5XL47 ATP‐dependent protease ATPase subunit HslU 49.9 12.1 4.2 19 Z5XKY3 50S ribosomal protein L2 29.9 5.1 1.7 20 A0A0P7DQX9 Flagellin 33.5 ‐1.8 ‐3.7 a According to Uniprot ID.