HAL Id: hal-01627389
https://hal.archives-ouvertes.fr/hal-01627389
Submitted on 1 Nov 2017
HAL is a multi-disciplinary open access
archive for the deposit and dissemination of
sci-entific research documents, whether they are
pub-lished or not. The documents may come from
teaching and research institutions in France or
abroad, or from public or private research centers.
L’archive ouverte pluridisciplinaire HAL, est
destinée au dépôt et à la diffusion de documents
scientifiques de niveau recherche, publiés ou non,
émanant des établissements d’enseignement et de
recherche français ou étrangers, des laboratoires
publics ou privés.
North-south asymmetries in the thermosphere during
the Last Maximum of the solar cycle
F. Barlier, Pierre Bauer, C. Jaeck, Gérard Thuillier, G. Kockarts
To cite this version:
F. Barlier, Pierre Bauer, C. Jaeck, Gérard Thuillier, G. Kockarts. North-south asymmetries in the
thermosphere during the Last Maximum of the solar cycle. Journal of Geophysical Research Space
Physics, American Geophysical Union/Wiley, 1974, 79, pp. 5273-5285. �10.1029/JA079i034p05273�.
�hal-01627389�
VOL. 79, NO. 34 JOURNAL OF GEOPHYSICAL RESEARCH DECEMBER 1, 1974
North-South Asymmetries in the Thermosphere During
the Last Maximum of the Solar Cycle
F. BARLIER, x P. BAUER, 9' C. JAECK, x G. THUILLIER, a AND G. KOCKARTS 4 A large volume of data (temperatures, densities, concentrations, winds, etc.) has been accumulated showing that in addition to seasonal changes in the thermosphere, annual variations are present and have a component that is a function of latitude. It appears that the helium concentrations have much larger, variations in the southern hemisphere than in the northern hemisphere; the same holds true for the ex- ospheric temperatures deduced from Ogo 6 data. Similarly, satellite drag data in the 250- to 400-km range indicate that the bulge of density tends to stay over the southern hemisphere, whereas winds deduced from Ogo 4 and 6 data show a tendency to blow northward across the equator. If part of the explanation of these asymmetries can be found in a latitude independent component induced by the changing sun-earth distance between solstices (Volland et al., 1972; Ching and Chiu, 1972, 1973), the fact that an asymmetry is •till present at the equinoxes suggests that this is not the sole cause: more energy seems to be available for the thermosphere in the southern hemisphere during the equinoxes; this may be the result of an asymmetry in the geomagnetic field or an asymmetrical dissipation of tidal waves induced by an asymmetrical worldwide ozone distribution.
An asymmetry between the two hemispheres became ap- parent very early in the study of the semiannual variations of the thermospheric density. The density minimum is systematically deeper in July than in January [Paetzold and
Zschbrner, 196I; Roeruer, 1963; Jacchia, 1965]. For the same local season the mean density is not the same in both hemispheres. New evidence of asymmetries in the thermo-
spheric parameters between the two hemispheres has recently _.been pointed out by Keating et al. [1973], Barlier et al.
[1973],
and
Blamont
and
Luton
[1972].
A major
feature
of these
asymmetries is the nonpermutability of the values of ther-
mospheric parameters of the northern hemisphere for a
solstice with those of the southern hemisphere for the other solstice. Furthermore, systematic differences exist between the
two hemispheres at the time of equinox, and these differences have the same sign for spring and fall conditions. Neutral
temperature, density, concentration, and wind data have been
gathered in order to study their hemispherical asymmetries. The first part of the present paper is devoted to an analysis of experimental data characterized by asymmetrical properties during the last maximum of solar activity. The second part is
designed to show that most of the observed asymmetries can
be considered as resulting from a unique cause, namely, an asymmetrical thermospheric heating of the two hemispheres for identical solar conditions. Finally, possible energetic
mechanisms are considered, namely, heating linked to
geomagnetic activity and heating due to dissipation of tidal
waves.
DATA ANALYSIS
Thermospheric temperatures. Temperatures near 270 km
have been deduced from Fabry-Perot interferometric
measurements of the 6300-,/• red line on board the Ogo 6
satellite [Blamont and Luton, 1971]. Reliable data have been
obtained during the daytime over the period June 1969 to
• Groupe'de Recherche de G6od6sie Spatiale, Centre d'Etudes et de Recherches G6odynamiques et Astronomiques, Grasse, France.
:Centre National d'Etudes des T616communications, Issy-les- Moulineaux, France.
:Centre National de la Recherche Scientifique, Service d'A6ro- nomie, Verri•res le Buisson, France.
4 Institut d'A6ronomie SpatiMe de Belgique, Brussels, Belgium. Copyright ¸ 1974 by the American Geophysical Union.
August 1970. The orbital characteristics were such that 24
hours
of local time was covered
over a period
of 90 days.
The data available for this study were limited to low andmiddle latitudes (up to 60ø). These data are in a sense a natural
choice, since a previous study [Blamont and Luton, 1972] has
shown
that the high-latitude
behavior
is largely
determined
by
geomagnetic activity. The data were averaged over latitudinal
strips 30 ø wide.
Figure I gives variations of the temperature differences between northern and southern mid-latitudes (45øN-45øS and 25øN-25øS) as a function of the calendar day. A 90-day run-
ning mean of the data was performed to eliminate diurnal
variations. The reason for considering the difference in temperature for corresponding geographical latitudes in the
two hemispheres is to eliminate the effects of solar flux and geomagnetic activity. The observed residuals should therefore characterize essentially the seasonal variations. Two different
features can be seen in Figure 1:
1. For 25 ø latitude the temperature difference is practically
always
negative
or equal
to zero;
i.e., the southern
hemisphere
in this latitude range appears generally to be warmer than the northern hemisphere. This is a clear indication of the presenceof an asymmetry of the temperature behavior in these two
regions, since a purely seasonal effect would tend to give an os-
cillation centered around zero. It must be noted that at
equinox
the southern
temperature
is still significantly
higher
than the northern one: August 26, 1969, to April 1, 1970, is a period of continuously higher southern temperatures.2. The situation is different at 45 ø, where a seasonal effect
can be clearly
seen.
It will be noticed,
however,
that equal
temperatures are observed around September 16, 1969, and
March 26, 1970, which tends to enhance the period when the southern hemisphere is warmer: the temperature difference
seems to be larger for the December solstice than for the June
solstice. Although the seasonal variation dominates at 45 ø, it is still possible to detect the asymmetry noted for 25 ø.
In order to ascertain the reality of the effect it is useful to
look at the variation of the 80-day mean solar flux over the
period
of interest
(Figure
2). Rather
small
variations
(+7%)
around the mean value are observed, and their residual effect on the temperature differences should be very small.A comparison
has been made with WaMteufel's
[1971]
model of temperature based on incoherent scatter data
2OO- 1OO- e -lOO- -200- i JUL .... •
1969
1970J
200 lee, e- -lOO- -200-ß T'"SEP. NOV. JAN. MAY •
Fig. 1. Difference between northern hemisphere and southern hemisphere temperatures deduced from Ogo 6 measurements averaged over one revolution of the node for the zone of geographical latitudes centered on +45 ø
and +25 ø
gathered at Arecibo (18øN) and St. Santin (45øN). The ratio of the observed temperature Togo 6 to the value given by this
temperature model, Twa•, is plotted in Figure 3 as a function of
time for three latitudinal regions. Our purpose here is not to
discuss the different details, but the main feature must be
pointed out. Although no significant trend seems to be present
_
in the behavior of the temperature ratio at 45øN, the
equatorial, and particularly the southern, data indicate that the observed temperatures are lower than the model values in July and August and higher between September and February.
Since Waldteufel's model is based only on temperature
observations made in the northern hemisphere, it is normal to find a rough agreement in the northern hemisphere. However,
the systematic effect observed at 45øS, when it is taken into ac-
count that the model is symmetrical by construction for the two hemispheres, indicates that the amplitude of the winter to
summer variation in the south is larger than that in the north. To a lesser extent the same feature is observed at the equator, and this shows that an annual, rather than a seasonal, effect is involved. This annual effect is similar to the annual component .
of the 'semiannual variation' deduced by Jacchia [1971a] from
an analysis of satellite drag data, and it constitutes an asymmetry in the thermospheric behavior.
Waldteufel's model can be adjusted to the Ogo 6
temperature data by varying only the 'seasonal' coefficient Ca
for each range of latitudes considered. In this way, annual
effects may appear as seasonal ones. The results are presented
together in Figure 4. If only seasonal variations were present, positive values would be observed in the north, and negative values in the south. It appears, however, that the reversal oc- curs near 30øN instead of near the equator. The absolute value
is much larger at 45øS than at 45øN; this confirms that an an-
nual effect exists. This annual effect is in phase with the seasonal effect in the south and is out of phase with that in the
north. The region where the coefficient Ca vanishes is shifted northward.
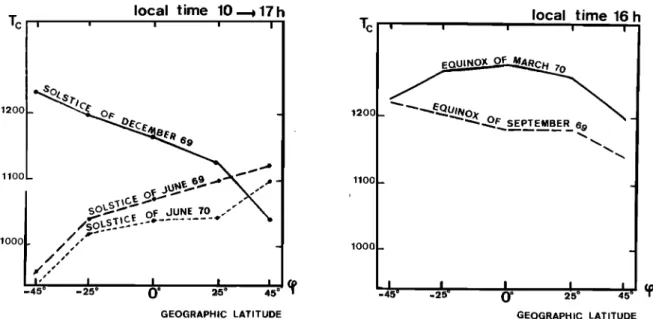
The nature of the asymmetry is further established by the latitudinal variation of the temperature for a given local time. Figure 5 shows the Ogo 6 temperatures versus latitude for different solstices and equinoxes and for local time varying
170-
150-
130-
i JUL.
Is,
SEP.
I ,
I NOV'I
L
JAN
[MAn.
1969 1970
BARLIER ET AL.: NORTH-SOUTH ASYMMETRIES IN THE THERMOSPHERE 5275 1.2 1.0
0'81
• =
+45
ø
TOGO-6
/ TWAL
ß
v'Nv, ,ov.,¾
'
' 'V TM"
1.2 1.00'81
•=0 ø
1.2 1.00'81
. SEP. NOV. JAN. MAR.
Fig. 3. Ratio of the observed
temperatures
Togo
6 and the temperatures
obtained
by using
the Waldtcufel
model,
twal-
between 1000 and 1700 hours. The data were, however, nor- malized to a 10.7-cm solar flux of 150 X 10 -•"' W m -•' HzT • and
a geomagnetic activity corresponding to a mean Kp of 2 by use
of the Jacchia 1971 model formulation [Jacchia, 1971b]. The solstice data indicate that the amplitude of the variation
between the June and the December solstice is much larger in
the south than in the north. The global average temperature is
therefore higher in December than in June. This kind of asymmetry is also observed with the equinox data, which in-
dicate that irrespective of the equinox considered, the temperature tends to be higher in the south.
Concentrations and total densities. The exospheric helium concentrations were deduced by Keating et al. [1973] from
drag data of Explorer 9, 19, 24, and 39 between 1961 and 1971.
.051
(•3
!I
,4- - 45 •5 i i ! i / ! ! !WALDTEuFEL S MODEL VALUES ... CORRECTED VALUES
Fig. 4. Seasonal
coefficient
Ca of the Waldteufel
temperature
model as a function of latitude, and adjusted values with Ogo 6measurements.
By taking advantage
of the complementarity
of the orbits
of
these satellites Keating et al. [1973] evaluated the heliumseasonal variation in the northern and southern hemispheres.
Such a statistical analysis is, however, not available from the mass spectrometric data presented by Hedin et al. [1974].
The asymmetrical behavior of helium deduced by Keating et
al. [1973] is presented in Figure 6. Although the helium con- centration generally seems to be higher in the north than in the south, it appears that the most significant feature is a much larger seasonal variation in the south than in the north, the net result being equivalent concentrations for local winter in the
north and the south and much lower concentrations for the southern summer than for the northern summer. This kind of
asymmetry is not detectable in the Ogo 6 data [Hedin et al., 1974]: the measurements can be made only when the satellite is near perigee, and therefore it is impossible to observe densities
in the southern and northern hemispheres simultaneously.
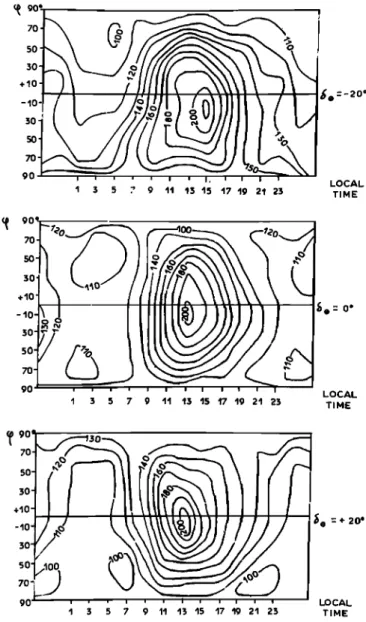
Satellite drag observations compiled by Barlief et al. [1973] and Jaeck-Berger [1973] have been used in several ways. In a first step a statistical treatment of drag data covering the last solar maximum (1967-1970) was performed around 280 km.
Each observation for a given latitude and local time was nor- malized to the worldwide minimum density predicted on the
basis of the Jacchia 1971 model for the same conditions (solar
flux, magnetic activity, and time of the year). The ratios of the
observed
densities
to the computed.
minimum
densities
were
then gathered into maps in Figure 7 corresponding to solstices
and equinoxes.
It is well known [Jacchia, 1971b] that the latitude of the sub- maximum density point undergoes a migration correlated with
the declination of the sun. However, if the latitude of the max-
imum is clearly in the south during the December solstice, it tends to stay close to the equator during the June solstice. The
local time 10 .--• 17 h Tc', ' , ,
_
,
_
,ooo
| /,,'/C," ,
,
,
,
_45 ø .25 ø 00 2.5 ø 45 ø GEOGRAPHIC LATITUDE 1200 1100 1000 local time 16h I I I I I• • •E.•QUiNov
_O.•F__SE
PT
EM
B_.E
R_
6,
9
'
'
,
,
_45
ø _215
ø
0 ø
25
ø
45
ø
GEOGRAPHIC LATITUDEFig. 5. Means for five zones of geographical latitude of observed temperatures corrected for the solar flux and geomagnetic activity by the Jacchia 1971 model for (left) 90 days around the solstices and (right) a few days around the equinoxes.
minimum of the June solstice is much more elongated than that of the December solstice. During the December solstice, density gradients across the equator are present during the sec- ond part of the night; during the June solstice this is not true.
The north-south asymmetry is not a phenomenon limited to solstices, since an asymmetry is still present at the equinox when the solar illumination of both hemispheres is the same (Figure 7). The density is generally higher in the south than in the north: indeed, on the one hand, the density maximum stays in the southern hemisphere, whereas, on the other, there are two density minimums (one in each hemisphere), the one in the northern hemisphere being more pronounced than the one in the southern hemisphere. This fact has also been demonstrated
by Harper [ 1971 ].
The densities at 480 km deduced by Barlier et al. [1973] from satellite drag data for the period covering the Ogo 6 obser-
EXPLORER 9 19 24 39 [2/61-9/71)
o!
O2 0.3 WINTER / / / / / SUMMER dec. june _ -90 s 0 N +90 LATITUDE, DEGREESFig. 6. Seasonal variation of exospheric helium in the northern
and southern
hemispheres
based
on all available
helium
drag
data
(Explorer
9, 19, 24, and
39) from
February
1961
through
September
1971
evaluated
in separate
10
ø latitude
increments
[Keating
et al.,
1973].
vations have also been averaged over 90 days for the purpose of comparison with the temperatures. The density differences between conjugate geographical latitudes have been plotted in Figure 8. The densities in the northern hemisphere appear to be systematically smaller than or equal to the corresponding
values in the southern hemisphere. This is observed at 25 ø as
well as at 45 ø . Such behavior is consistent with generally
higher temperatures observed over the south.
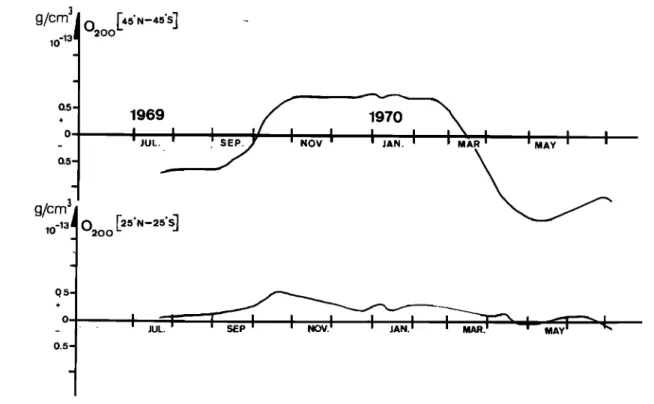
In order to separate thermal expansion effects from changes
in the lower boundary densities the 480-km densities, which
correspond to atomic oxygen, have been reduced to 200 km by making use of the temperature determined by Ogo 6 and by assuming that diffusive equilibrium prevails in this altitude range. The choice of 200 km rather than a lower height is due to the uncertainties concerning both the assumption of diffusive equilibrium and the temperature profile below 200 km [Alcaydb et al., 1974]. Figure 9 shows the result of this procedure in terms of the north-south difference-in oxygen concentration at 200 km. It is clear that the results at 45 ø a. re dominated by seasonal effects essentially showing that the ox- ygen tends to be accumulated over the cold hemisphere (winter). This is in agreement with the results of previous
studies [e.g., Evans et al., 1970; Barlier et al., 1971; Hedin et al., 1974; Alcaydb et al., 1974].
The 25 ø results are quite different and definitely exhibit an asymmetry. Indeed, the 25øN concentrations are always larger
than or equal to the 25øS concentrations. This is to be com-
pared with the asymmetry in temperatures (Figure 1) and also tends to show that the atomic oxygen accumulates over the
colder region.
A second feature can be deduced from the previous com- putations: a higher seasonal variability of the atomic oxygen
concentration in the northern hemisphere than in the southern
hemisphere. For this purpose the concentrations in local winter and local summer have been computed. Figure 10 shows the ratio of the above concentrations at 1700 hours local time for different latitudes. A greater variability appears in the northern hemisphere than in the southern hemisphere, con-
BARLIER ET AL.: NORTH-SOUTH ASYMMETRIES IN THE THERMOSPHERE 5277
I 3 5 7 9 11 1:5 15 17 19 21 23
wind the hmF9. distribution is symmetrical with respect to the magnetic dip equator. An asymmetry arises when a wind is
blowing: in the summer hemisphere the F layer rises in height,
and in the winter hemisphere the F layer falls. The result is the
appearance of a maximum of hmF9. in the summer hemisphere
$.:-2o* and
a minimum
in the
winter
hemisphere.
The Comitfi Consultatif International des Radiotfilficom- munications (CCIR) predictions [Union Internationale des Tklk-
communications, 1967] contain an important volume of
ionospheric data. When the corrections pointed out by J. W. King and G. Thuillier (private communication, 1974) are
COCAL taken into account,
TIMEthe ionospheric
behavior
is obtained
for
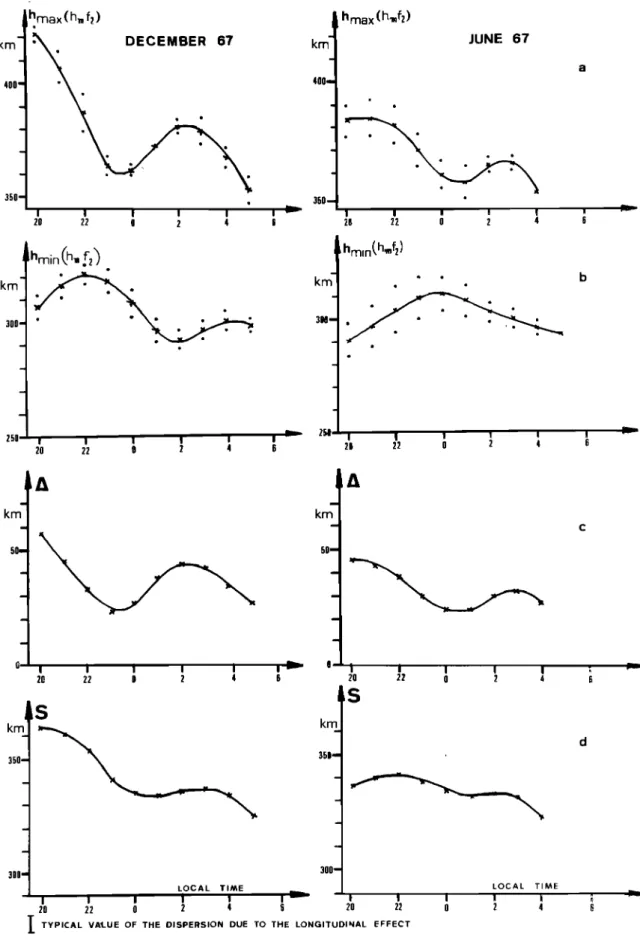
different local times and seasons. Figure 12 shows the two belts of extreme hmF•. obtained for a constant local time from the data of the CCIR predictions. The complete set of those maps leads to the behavior of the minimum and maximum hmF•., designated as hmm(hmF•) and hmax(hmF•.), respectively. Figure
13 compares the results for June and December 1967 and ex- hibits the following characteristics:
1. In Figure 13a, hmax(hmF9) is greater in December than in June.
2. In Figure 13b, hmm(hmF9) is comparable in June and
December. The two local time variations are, however, not similar.
LOCAL 3. In Figure 13c the difference
TIMItA = [hmax(hmF9)
-
hm,•(hmFO]/2 is plotted versus local time. It is seen that A is higher in December than in June and is different in phase.
4. In Figure 13d the sum S = [hmax(hmFO + hm•,•(hmFO]/2 is plotted versus local time; S represents a mean altitude of the
F layer that is higher in December than in June.
According to the theoretical results of Bramley and Young [1968] it appears that the meridional wind blowing from south to north in December is characterized by a higher speed than the wind blowing from north to south in June (property 3).
At the beginning of the night the F layer is higher in
December than in June, and this situation remains throughout
LOCAL the night.
Therefore
during
the daytime
the eastward
electric
T•Mœ field, which causes the F layer to rise, must be larger in
December than in June (property 4). ,
Thus the behavior of the F region is not symmetrical in June and December and exhibits an annual component.
Lower thermosphere sodium concentrations. It is well known that the sodium concentration at 85 km undergoes a seasonal variation [Donahue and Blamont, 1961; Gadsden, 1964; Gault and Rundle, 1969]. Maximums of concentration have been observed during the local winter for both hemispheres. Unfortunately, it is difficult to compare the values obtained by different authors because of intercalibra- tion problems of the photometers. It seems, however, that the concentration of sodium is higher in December over the northern hemisphere and that the variability of the concentra- tion is higher in the north (Table 1). It is still an asymmetrical characteristic. The seasonal behavior is similar to that of atomic oxygen at 200 km (Figure 9): in particular, the variability seems higher in the northern hemisphere than in the
southern hemisphere. 1 3 5 7 9 11 13 15 17 19 21 23 30 X
50
O0
•
70•
)
90
l-'
....
, , • ,
I 3 5 7 9 '11 13 15 17 19 2', 13 •© = + 20 øFig. 7. Values of the ratio of observed densities and the night- time minimum density of the Jacchia 1971 model as a function of local solar time and latitude for time period centered around bs - - 20 ø, 0 ø, and + 20 ø.
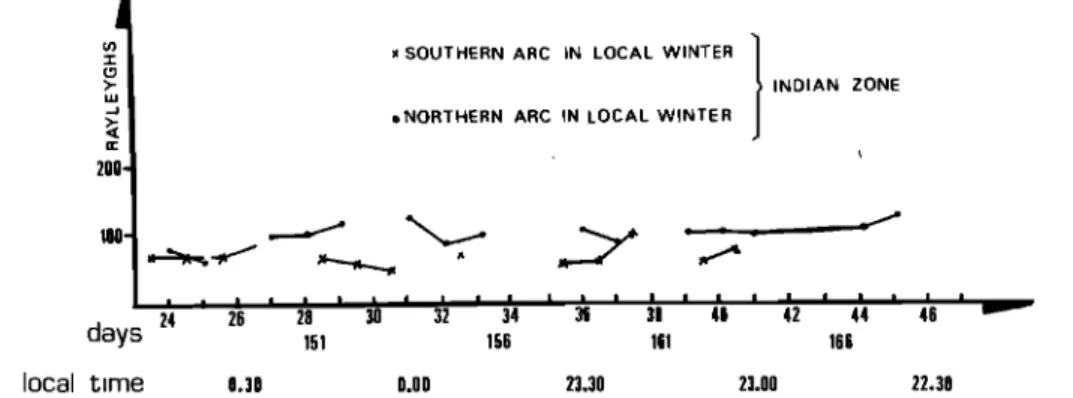
Neutral winds in the F region. Thuillier [1973] and Thuillier
and Blamont [1973] have shown that the nighttime 6300-A emission observed on board Ogo 4 and 6 in the tropical regions can be interpreted in terms of thermospheric winds. Owing to the role of the magnetic field declination it appears that the region 0ø-150øE is convenient for the study of
meridional winds across the equator. The small declination of
the magnetic field in this region renders negligible the effect of
zonal wind in the behavior of the 6300-A emission.
The tropical emission north of the magnetic equator in
January has been compared with the southern data in June (Figure 11). The intensity variation is due to the altitude change of the F layer, and it is possible to conclude that for part of the night the meridional wind blowing from the south
toward the north in January is greater than the one blowing from the north toward the south in June (Figure 11). This ex- perimental result is compatible with the hypotheses used by
Keating et al. [1973] to interpret the helium distribution. A transequatorial wind blowing from the summer to the
winter hemisphere modifies the altitude of the F layer, as has been described by Bramley and Young [1968]. Without the
TENTATIVE INTERPRETATION
The preceding data show that annual variations in addition
to seasonal changes are present in the thermosphere. Two an- nual components must be considered: the first component
is independent of latitude, and the second component re-
sponsible for the asymmetry is a function of latitude. Possible sources of latitude independent components.
g/cm•]
1(• 14' 0.1-- 0 0.1--•E480]
( 4õøN--
4õø$•
•
I
I
I
I
I I •-"'•---,_
I MAY
I
I
JUL.
I ISEP.'-•,,,
• I NOV.•MAR. I •""'•-,.-._•.---"r
JUL
1969 10-14 0.1 +• 0- o.1 .-i
i
.
.
-
I
F
Fig. 8. Difference between northern hemisphere and southern hemisphere densities at 480 km, deduced from statistical analysis, for the same period' and geometrical position as the Ogo 6 temperature measurements.
Several studies of possible sources of latitude independent
components have been made, and several processes can be,
involved' ß
1. Extreme ultraviolet heating in the thermosphere linked
to the changing sun-earth distance [Ching and Chiu, 1972, 1973].
2. Tidal and gravity wave dissipation at thermospheric
heights whose efficiency is also a function of the sun-earth geometry and of the absorption of solar radiation within the ozone layer [Volland et al., 1972].
3. Joule heating
depending
on the geomagnetic
activity
[Ching and Chiu, 1973; Volland et al., 1972].g/cm•j
•o-•3 .0200
[45'
N--45'S
]
1970 ß I JUL.Fig. 9. D!fference between northern hemisphere and southern hemisphere atomic oxygen densities at 200 km deduced
BARLIER ET AL.: NORTH-SOUTH ASYMMETRIES IN THE THERMOSPHERE 5279
0.5-
. /
Fig. 10. Ratio R = [O]•.00 December 1969/[O]•.00 June 1969 for
different latitudes.
Search for a source of asymmetry yielding a latitude depen- dent component. It is important to note that in calculating the
action of the sun on the two hemispheres, account must be
taken of the fact that the asymmetries persist at the equinox. The following hypothesis can be put forward: for comparable
solar conditions (equal and opposite declinations of the sun
and the same solar activity) the southern hemisphere is able to gather more energy than the northern hemisphere (particularly at equin6x).
The effects of the preceding hypothesis are now analyzed in more detail.
Effect of the temperature. The first consequence of an un- balanced efficiency of the solar effect in the thermosphere between the two hemispheres is a generally higher worldwide exospheric temperature for the solstice that corresponds to the highest sun-atmosphere interaction (i.e., the December
solstice).
Thus an annual variation must be added to the seasonal variation: in phase in the south and out of phase in the north. In this instance the small temperature variation observed in the north and the large one observed in the south should be noted (Figure 5). Furthermore, the fact that Waldteufel and Cogger [1971] did not observe any significant seasonal varia- tion of the temperature above Arecibo (18øN) proves that there is an exact cancellation of the seasonal and annual variations at that latitude. The proposed mechanism suggests
mainly. that for both equinoxes the southern hemisphere must
be warmer than the northern hemisphere. This is in agreement
with the features shown in Figure 1.
Effect on the thermospheric density. Owing to the thermal expansion the density bulge is expected to have a tendency to
stay in the southern hemisphere. This tendency is actually
observed (Figure 7). It is also expected that the larger annual
temperature variation of the southern middle-latitude ther- mosphere with respect to the northern one also causes larger annual changes in density, as is observed (Figure 7).
Effect on the circulation. The temperature and density
buildup in the southern hemisphere leads to pressure maps
capable of causing, in addition to the normal seasonal circula- tion, a wind system blowing from south to north that cor- responds to the optical observations (Figure 11) and to the ionospheric data (Figure 12).
Effect on the composition. Johnson and Gottlieb [1970,.
1973], Johnson [1973], and Reber and Hays [1973] have shown that a meridional circulation tends to accumulate the light
constituents (as compared with molecular nitrogen) in the
region of converging winds (pressure minimums) and to
deplete the heavy constituents (as compared with N•) in the
same region. In addition to the seasonal changes resulting for
such a mechanism there will be an accumulation of the light
gases over the northern hemisphere as a result of the south to north wind system. Such behavior is observed in the atomic oxygen concentration reduced at 200 km (Figure 9) as well as
in the helium concentration (Figure 6). There is a puzzling feature that is difficult to describe with the previous mechanism; i.e., the largest seasonal variability appears in the
southern hemisphere for helium (Figure 6), whereas it occurs
in the northern hemisphere for atomic oxygen (Figure 10). This point can be clarified by noting that a winter bulge can also be explained by a latitudinal variation of the eddy diffu-
sion coefficient [Kockarts, 1972]. Furthermore, it has been shown [Kockarts, 1973] that the effect of a wind system on a
vertical distribution can be represented by an appropriate eddy diffusion coefficient or vice versa. Circulation and turbulence should therefore play a simultaneous and complementary role
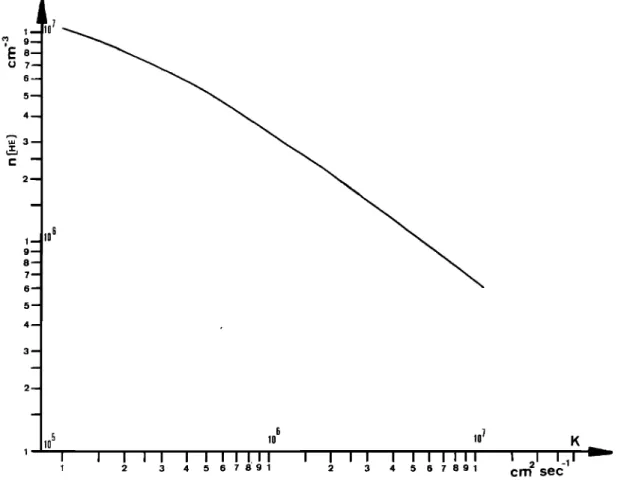
in the structure of the upper atmosphere. An illustration of the possible effect of turbulence is given in Figure 14, where the helium concentration at 400 km is plotted as a function of an altitude independent eddy diffusion coefficient adopted above 90-km height. When the entire variation of helium deduced by
Keating et al. [1973] is assumed to result from tu'rbulence
effects between 90 and 120 km, the required latitudinal and seasonal dependence of the eddy diffusion coefficient is shown in Figure 15. These values should be considered as orders of magnitude, since the vertical structure of the eddy diffusion coefficient has been neglected.
With the available data from chemical tracers on turbulence above 90 km [Lloyd et al., 1972; Philbrick et al., 1973a] it is
Fig. 11.
1
200. 100- days local timex SOUTHERN ARC IN LOCAL WINTER
ß ,NORTHERN ARC IN LOCAL WINTER
INDIAN
ZONE
151
;4 ' ;6'
]8' ;0 '
156 161 ' ' ' ' 4'6 ' 42 44 • 166 0.30 0.00 23.30 23.00 22.30Comparison of the intensity of the northern arc in December (local winter) with that of the southern arc in June (local winter).
+ 90
Magnetic equator
.... Line of Minimum h F2 (mean value 306 km)
, m
... Line of Maximum h F2 (mean value 422 km)
m
- 9O
- 180 W
0
h
december |[}õ]
20
+180 E
Fig. 12. The two belts of maximum and minimum h,•F2 for December 1967.
very difficult to build a global model of the latitudinal and seasonal variations [Roper, 1973]. Radio meteor trails are also
used to measure the atmospheric turbulence [Zimmerman, 1973]. Although the experimental data do not cover
sufficiently well all latitudes and seasons, the theoretical com- putations of Figure 15 indicate that the world average value of the eddy diffusion coefficient is higher during December than
during June.
The similarity in the northern and southern winter helium bulges can now be explained. The wind system (south-north) is
more intense in the northern winter (December) than in the southern winter (June) because of the asymmetry in the
meridional circulation. Therefore the winter helium bulge
should be larger in the north than in the south. But the world average turbulence is higher in December than in June (Figure 15), so that the northern winter bulge is not as large as is predicted from the meridional circulation and finally, the
winter bulges are similar in the two hemispheres.
The situation is not the same for the summer helium deple-
tion. For the southern summer both the higher turbulence in December and the south-north wind produce a reduction of the helium concentration. Therefore the depletion is larger in the south than in the north, explaining the difference in the winter-summer variability between the two hemispheres.
One may wonder then why the same feature is not observed
in the behavior of the atomic oxygen concentration. Keneshea and Zimmerman [1970] showed that an increase in the tur-
bulence has two opposite effects on the atomic oxygen concen- tration: the first is to increase the production of O following
the increase of O•. around 120 km and the second is to in- crease the rate of downward diffusion of O into the region
where it is recombined. The two effects seem to lead to a situa- tion in which for an increased turbulence the atomic oxygen
concentration above the peak remains unchanged, whereas that below it is smaller. The experimental data of Philbrick et al. [1973b] seem to confirm the above theoretical work. Thus
the variability is linked more closely to the winds than to the
turbulence and will be higher in the north than in the south, as has been indicated in Figure 10. It should be mentioned that
any theoretical study of the latitudinal and seasonal variation of atomic oxygen should take into account the variations of the molecular oxygen photodissociation coefficient with the solar
zenith distance. An explanation of this kind may be valuable
for sodium but has not yet been developed.
In conclusion, by assuming that greater energy is kept in the
southern thermosphere than in the northern thermosphere for
the same solar conditions a satisfactory understanding of the
asymmetries described previously can be obtained. We had to
assume, however, that the world average turbulence is higher in December than in June.
POSSIBLE NATURE OF SOURCES
The physical characteristics analyzed in the preceding sec-
tions should be related to thermospheric heat sources that are asymmetrical even during the equinoxes. Therefore the effects linked to the geomagnetic activity will be considered, because the geomagnetic field of the earth exhibits a permanent asymmetry at high latitudes as well as at low latitudes (South Atlantic anomaly). The tidal wave dissipation will also be
studied, since the atmosphere below the thermosphere pre- sents some asymmetrical aspects. Finally, other sources already
BARLIER ET AL.' NORTH-SOUTH ASYMMETRIES IN THE THERMOSPHERE 5281 400- 350- hma x (h, f•) i I I I I 20 ;,2 o ;, 4 km 300- -- hma x (h.,,,f•) krr . 400-- l, ß . ß ß .. .. 350-- 6 20 22 0 JUNE 67
hmin(h•.f•)
250---
I
i
i
I
•
I •
250--
20 22 0 2 4 6 20 22 0 2 4 Akm
krr•
km 350- 300"- 50-- A ø--i I i I I 20 22 0 2 4 6 20 22 0 2 4 s 350 ,300]
LOCAL TIME LOCAL TIME
I i I i i I ----'• I I I I k
20 22 o 2 4 6 20 22 0 2 4
TYPICAL
VAtUE
OF
THE
DISPERSION
DUE
TO
THE
LONGITUDINAL
EFFECT
TABLE 1. Seasonal Variation oœ Sodium Concentrations in the Lower Thermosphere
Na Concentrations, cm -3
Geographical Local
Author Year Location Winter
Local Summer
Gadsden 1962 to 1963
Donahue and Blamont 1958 to 1959
Lauder -45øS, 169øE Haute-Provence Observatory +44øN, 6øE 3 x 10 9 1 x 10 9 14 x 10 9 1.5 x 10 9
ticular, the changing earth-sun distance must be taken into ac-
count.
Effects linked to the geomagnetic activity. The importance of heating processes connected to geomagnetic activity has been pointed out even for quiet periods [Blamont and Luton, 1972]. In a recent paper, Tort and Tort [1973] have also shown the importance of the effects in latitude and longitude linked to geomagnetic activity for an understanding of the winter F region anomaly, which is another aspect of the general asymmetries. These authors conclude that globally, the southern hemisphere receives more energy than the northern hemisphere, and they point out a particular geomagnetic effect in the south. It therefore appears that asymmetries can be in- troduced through the geomagnetic activity even during the equinoxes. However, this sole source could not explain the greater variability of the exospheric temperature in the
southern thermosphere. Other heat sources are important; for
example, EUV heating variations linked to the changing earth-
sun distance must be considered, introducing an annual com- ponent.
Unbalanced excitation of tides. Since the need for a higher worldwide turbulence in December has been noticed and since
turbulence is linked to energy deposited in the mesosphere and
propagating upward, possible tidal effects should be con- sidered.
It has been suggested that the energy dissipation of semidiurnal tides in the thermosphere is sufficient to account for the difference between the observed temperatures and those computed theoretically [Robie and Dickinson, 1973] on the basis of EUV solar fluxes measured by Hinteregger [1970]. Lindzen and Blake [ 1970] give an order of magnitude of 0.3 erg cm -•' s -• deposited above 150 km, compared with the daily average of 0.5 erg cm -•' s -• for the EUV heating. Some support for this theoretical work is given by recent wind measurements in the 100- to 200-km range, exhibiting semidiurnal tides, made by Bernard and Spizzichino [1971], Amayenc [1974], Bet-
0 7• 6-- 5--- 4-- ,,, 3• 2-.-- I I 9• 8-- 7--' 6'- 5-- 4-- 3• 6
5
•o
•o7
K
lOI
I i I I I I I I I, II
I '1 I I I I I IIII
I •1 I_,•i ---
I 2 3 4 5 6 7 891 2 3 4 5 6 7 891 CFR secFig. 14. Helium
concentration
at 400 km as a function
of an altitude
independent
eddy
diffusion
coefficient
BARLIER ET AL.: NORTH-SOUTH ASYMMETRIES IN THE THERMOSPHERE 5283 ß 2 I "--' 6
10
•
I \ \I
I
I
I
I
I
I
I
I
I
I
I
I
I
6•
30
ø
0
30ø
60ø
-S
N
latitude june decemberFig. 15. Latitudinal and seasonal dependence of the eddy diffusion coefficient when the entire variation of helium
deduced by Keating et al. [1973] is assumed to result from the turbulence effect between 90 and 120 km.
nard [1974] at St. Santin, Wand [1972], and Salah and Evans
[1973].
For the St. Santin results it should be noted that the
amplitudes observed for the semidiurnal tide seem to indicate
an annual trend with a maximum centered around December.
One .might
wonder
whether
this characterizes
a local
seasonal
variation or a larger worldwide excitation of the semidiurnal tides during the December solstice. Although all the equip- ment allowing this kind of observation is located in the northern hemisphere, making it impossible to distinguishbetween annual and seasonal variations, the convergence of
the evidence is sufficiently strong to consider an asymmetry in
the semidiurnal tide excitation between the solstices as a possi- ble mechanism.
Before examining the source of the semidiurnal tide it is in- teresting to indicate that the equatorial electrojet [Mayaud,
1967] as observed in Jarvis (160øW, 0ø), where the magnetic
and geographical equators coincide, shows a definite annual
variation with higher intensities in December than in June.
Since the electrojet is driven by tidal motions, this seems also
to confirm the higher tidal intensity in December.
Atmospheric ozone. It is known [Butler and Small, 1963; Lindzen, 1966, 1967; Chapman and Lindzen, 1970] that the
source of semidiurnal tides is to be found in the ozone layer.
Therefore an asymmetrical tidal dissipation should be cor- related with an asymmetry in the ozone distribution between the two hemispheres. Glass [1973] studied the effect of ozone distribution on the energy deposited by tides in the
mesosphere. From these computations it appears that the tidal energy input increases with the ozone concentration. More
specifically,
an increase
of the total ozone
content
leads
to an
increase of the tidal energy dissipation when the absolute value of the vertical ozone gradient is increased in the mesosphere. An analysis of the worldwide effect based on realistic ozone distributions has not yet been made. Such a study would re-quire,
however,
a knowledge
of global
ozone
distributions
up
to mesospheric levels.Numerous studies of tropospheric and stratospheric ozone have been based on the indirect 'Umkehr' m,ethod and on
direct soundings [Diitsch, 1970, 1971]. There exists a definite
latitudinal and seasonal asymmetry between both
hemispheres,
although some details are not completely
doc•umented
owing to the small number
of stations
in the
network in the SOuthern hemisphere. From these data itappears, however, that the seasonal
variation is less
pronounced
in the south
and that the maximum
of the total
content occurs closer to mid-latitudes in the south than in the
north.
During
late
local
summer,
autumn,
and
early
winter
there is more ozone over mid-latitudes in the southern
hemisphere
than
in the northern
hemisphere
[Kulkarni,
1962].
Satellite measurements of the backscattered ultraviolet earth
radiance [Krueger
et al., 1973] as well as infrared in•
terferometric data [Prabhakara et al., 1973] should give abetter
world coverage
between
80øN and 800S'for
the total
ozone content and for the vertical distribution up to ap-
to obtain a global picture of mesospheric ozone, although nighttime profiles can now be obtained from satellite
measurements of the intensity of ultraviolet stars during oc-
cultation by the earth's atmosphere [Hays and Roble, 1973]. Although the asymmetrical behavior of ozone is rather com- plicated, it is worthwhile to investigate its effect on the tidal
energy input in the upper atmosphere. CONCLUSION
An asymmetrical behavior of the northern and southern
thermospheres has been demonstrated with the aid of several
types of experimental data. It seems well established that more energy must be deposited in the southern thermosphere than in the northern thermosphere, even during the equinoxes. The origin of this fact is not completely clear, but two mechanisms
can be considered, namely, the geomagnetic field asymmetry
and the tidal wave dissipation, linked to the asymmetrical worldwide ozone distribution.
Acknowledgments. We would like to thank J. E. Blamont and J. M. Luton for giving us temperature data and P. Waldteufel for giving us his temperature model. We are very grateful to M. Glass for several discussions and to Diane Perret, who started this study and whose results were largely used in this work.
The Editor thanks L. G. Jacchia and another referee for their
assistance in evaluating this paper. REFERENCES
Alcayd6, D., P. Bauer, and J. Fontanari, Long-term variations of the thermospheric temperature and composition, J. Geophys. Res., 79, 629, 1974.
Amayenc, P., Tidal oscillations of the meridional neutral wind at mid- latitudes, Radio Sci., 9, 281, 1974.
Barlier, F., D. Perret, and C. Jaeck, Seasonal variation of the atomic oxygen concentration in the lower thermosphere, J. Geophys. Res., 76, 7797, 1971.
Barlier, F., J. L. Falin, M. Ill, and C. Jaeck, Structure of the neutral at- mosphere between 150 and 500 km, Space Res., 13, 349, 1973. Bernard, R., A comparison between meteoric radar and incoherent
scatter measurements in the lower thermosphere, Radio Sci., 9, 295,
1974.
Bernard, R., and A. Spizzichino, Semi-diurnal wind and temperature oscillations in the E-region observed by the Nancay incoherent scatter experiment, J. Atmos. Terr. Phys., 33, 1345, 1971. Blamont, J. E., and J. M. Luton, Ogo 6 neutral temperature
measurements, Comparison with the temperature models, 114 pp., COSPAR, Seattle, Wash., 1971.
Blamont, J. E., and J. M. Luton, Geomagnetic effect on the neutral temperature of the F region during the magnetic storm of September
1969, J. Geophys. Res., 77, 3534, 1972.
Bramley,
E] N., and
M. Young,
Winds
and
electromagnetic
drifts
in
the equatorial F2 region, J. Atmos. Terr. Phys., 30, 99, 1968. Butler, S. T., and K. A. Small, The excitation of atmospheric os-
cillations, Proc. Roy. Soc. London, Ser. A, 274, 91, 1963. Chapman, S., and R. S. Lindzen, Atmospheric Tides, p. 120, D. Reidel,
Dordrecht, Netherlands, 1970.
Ching, B. K., and Y. T. Chiu, Annual and sub-annual effects of a EUV heating, 1, Harmonic analysis, 2, Comparison with density varia- tions, Planet. Space Sci., 20, 1745, 1972.
Ching, B. K., and Y. T. Chiu, Global distribution of thermospheric heat sources: EUV absorption and Joule dissipation, Planet. Space Sci., 21, 1633, 1973.
Donahue, T. M., and J. E. Blamont, Sodium in the upper atmosphere, Ann. Geophys., 17, 116, 1961.
Diitsch, H. U., Atmospheric ozone, A short review, J. Geophys. Res., 75, 1707, 1970.
Diitsch, H. U., Photochemistry of atmospheric ozone, in Advances in Geophysics, vol. 15, edited by H. E. Landsberg and J. Van Mieghem, pp. 219-322, Academic, New York, 1971.
Evans, J. V., and L. P. Cox, Seasonal variation of the F• region ion composition, J. Geophys. Res., 75, 159, 1970.
Gadsden, M., On the twilight sodium emission, 2, A theoretical model of sodium abundance, Ann. Geophys., 20, 383, 1964.
Gault, W. A., and H. N. Rundle, Twilight observations of upper at- mospheric sodium, potassium and lithium, Can. J. Phys., 47, 85,
1969.
Glass, M., Etude des limites temporelies des ondes de gravit6 observ6es dans la basse thermosph•re, Ph.D. thesis, Univ. de Paris, Paris, 1973.
Harper, R. M., Ph.D. thesis, Rice Univ., Houston, Tex., 1971. Hays, P. B., and R. G. Roble, Observation of mesospheric ozone at
low latitudes, Planet. Space Sci., 21, 273, 1973.
Hedin, A. E., H. G. Mayr, C. A. Reber, N. W. Spencer, and G. R.
Carignan,
Empirical
model
of global
thermospheric
t,
emperature
and composition based on data from the Ogo 6 quadrupole spec- trometer, J. Geophys. Res., 79, 215, 1974. '
Hinteregger, H. E., The extreme ultra violet solar spectrum and its variation during.a solar cycle, Ann. Geophys., 26, 547, 1970. Jacchia, L. G. The temperature above the thermopause, Space Res., 5,
1152, 1965.
Jacchia, L. G., Semiannual variation in the heterosphere, A reap- praisal, J. Geophys. Res., 76, 4602, 19.71a.
Jacchia, L. G., Revised static models of the thermosphere and ex- osphere with empirical te.mPerature profiles, Spec. Rep. 332, 115
pp., Smithson. Astrophys. Observ., Cambridge, Mass., 1971b. Jaeck-Berger, C., ModUle statisticlue de densit• globale entre 180 et
500 km, Ann. Geophys., 29, 547, 1973.
Johnson, F. S., Horizontal variations in thermospheric composition, Rev. Geophys. Space Phys., 3, 741, 1973.
Johnson, F. S., and B. Gottlieb, Eddy mixing and circulation at ionospheric levels, Planet. Space Sci., 18, 1707, 1970.
Johnson, F. S., and B. Gottlieb, Atomic oxygen transport in the ther- mosphere, Planet. Space Sci., 21, 1001, 1973.
Keating, G. M., D. S. McDougal, E. J. Prior, and J. S. Levine, North- south asymmetry of the neutral exosphere, Space Res., 13, 327,
1973.
Keneshea, P. J., and S. P. Zimmerman, The effect of mixing upon atomic and molecular oxygen in the 70-170 km region of the at- mosphere, J. Atmos. Sci., 27, 831, 1970.
Kockarts, G., Distribution of hydrogen and helium in the upper at- mosphere, J. Atmos. Terr. Phys., 34, 1729, 1972.
Kockarts, G., Helium in the terrestrial atmosphere, Space Sci. Rev., 14, 723, 1973.
Krueger, A. J., D. F. Heath, and C. L. Mateer, Variations in the stratospheric ozone field inferred from Nimbus satellite obser- vations, Pure Appl. Geophys., 106-108, 1254, 1973.
Kulkarni, R. N., Comparison of ozone variations and of its distribu- tion with height over middle latitudes of the two hemispheres, Quart. J. Roy. Meteorol. Soc., 88, 522, 1962.
Lindzen, R. S., On the theory of the diurnal tide, Mon. Weather Rev., 94, 295, 1966.
Lindzen, R. S., Thermally driven diurnal tide in the atmosphere, Quart,. J. Roy. Meteorol. Soc., 93, 18, 1967.
Lindzen, R. S., and D. Blake, Mean heating of the thermosphere by tides, J. Geophys. Res., 75, 6868, 1970.
Lloyd, K. H., C. H. Low, B. J. McAvanay, D. Rees, and R. G. Roper, Thermospheric observations combining chemical seeding and ground-based techniques, 1, Winds, turbulence and the parameters of the neutral atmosphere, Planet. Space Sci., 20, 761, 1972. Mayaud, P. N., Correlation entre les variations journali•res du champ
magn•tique terrestr• sous l'61ectrojet •quatorial et dans les r6gions avoisinantes, Ann. Geophys., 23, 387, 1967.
Paetzold, H. K., and H. Zsch/Srner, The structure of the upper at- mosphere and its variations after satellite observation, Space Res., 2, 958, 1961.
Philbrick, C. R., R. S. Narcisi, R. E. Good, H. S. Hoffman, T. J. Keneshea, M. A. Macleod, S. P. Zimmerman, and B. W. Reinisch, The Aladdin experiment, 2, Composition, Space Res., 13, 441,
1973a.
Philbrick, C. R., G. A. Faucher, and E. Trzcinski, Rocket measurements of mesospheric and lower thermospheric composi- tion, Space Res., 13, 255, 1973b.
Prabhakara, C., E. B. Rodgers, and V. V. Salamonson, Remote sens- ing of the •zlobal distribution of total ozone and the inferred upper tropospheric circulation from Nimbus Iris experiments, Pure Appl. Geophys., 106-108, 1226, 1973.
Reber, C. A., and P. B. Hays, Thermospheric wind effects on the dis- tribution of helium and argon in the earth's upper atmosphere, J. Geophys. Res., 78, 2977, 1973.
BARLIER ET AL.: NORTH-SOUTH ASYMMETRIES IN THE THERMOSPHERE 5285 Robie, R. G., and R. E. Dickinson, Is there enough solar extreme ul-
traviolet radiation to maintain the global mean thermospheric temperature?, J. Geophys. Res., 78, 249, 1973.
Roemer, M., Die Dichte der Hochatmosph•ire und ihre Variationen w•ihrend der Phase abklingender Sonnenaktivit•it 1958-1962,
Veroeff. Univ. Sternwarte Bonn 68, 114 pp., 1963.
Roper, R. G., The dynamics of the turbopause, paper presented at General Scientific Assembly, Int. Ass. of Geomagn. and Aeron., Kyoto, Japan, 1973.
Salah, J. E., and J. V. Evans, Measurements of thermospheric temperatures by incoherent scatter radar, Space Res., 13, 267, 1973. Thuillier, G., Explication de l'6mission tropicale X 6300 A de l'ox-
yg•ne atomique: Mesures et th6orie, Ph.D. thesis, Univ. de Paris, Paris, June 1973.
Thuillier, G., and J. E. Blamont, Vertical red line 6300 A distribution and tropical nightglow morphology in quiet magnetic conditions, in Physics and Chemistry of the Upper Atmosphere, edited by B. M. McCormac, pp. 219-231, D. Reidel, Dordrechf, Netherlands, 1973.
Torr, M. R., and D. G. Torr, The seasonal behaviour of the F2 layer of the ionosphere, J. Atmos. Terr. Ph•s., 35, 2237, 1973.
Union Internationale des T616communications, Rep. 340, 117 pp., Com. Consult. Int. des Radiot616communications, Geneva, 1967. Volland, H., C. Wulf-Mathies, and W. Priester, On the annual and semi-annual variations of the thermospheric density, J. A tmos. Terr. Phys., 34, 1053, 1972.
Waldteufel, P., Exospheric temperatures from rockets and incoherent scatter measurements, J. G.eophys. Res., 76, 6990, 1971.
Waldteufel, P., and L. Cogger, Measurements of the neutral temperature at Arecibo, J. Geophys. Res., 76, 5322, 1971. Wand, R. H., Observations of reversible heating by tides in the E
region, 120 pp., Union Radio Sci. Int., 1972.
Zimmerman, S. P., Meteor trails and atmospheric turbulence, J. Geophys. Res., 78, 3927, 1973.
(Received April 1, 1974; accepted August 30, 1974.)