HAL Id: hal-01448329
https://hal.archives-ouvertes.fr/hal-01448329
Submitted on 6 Aug 2020
HAL is a multi-disciplinary open access
archive for the deposit and dissemination of
sci-entific research documents, whether they are
pub-lished or not. The documents may come from
teaching and research institutions in France or
abroad, or from public or private research centers.
L’archive ouverte pluridisciplinaire HAL, est
destinée au dépôt et à la diffusion de documents
scientifiques de niveau recherche, publiés ou non,
émanant des établissements d’enseignement et de
recherche français ou étrangers, des laboratoires
publics ou privés.
Engineering Radio Array
F. Gaté, Pierre Auger Collaboration
To cite this version:
F. Gaté, Pierre Auger Collaboration. Radio detection of cosmic rays with the Auger Engineering Radio
Array. XXV European Cosmic Ray Symposium (ECRS), Sep 2016, Torino, Italy. �hal-01448329�
Radio detection of cosmic rays with the Auger Engineering Radio Array
Florian Gat´e
Subatech, Universit´e de Nantes, ´Ecole des Mines de Nantes, CNRS/IN2P3, Nantes, France
for the Pierre Auger Collaboration
For the complete author list, see http: // www. auger. org/ archive/ authors_ 2016_ 09. html
The very low statistics of cosmic rays above the knee region make their study possible only through the detection of the extensive air showers (EAS) produced by their interaction with the constituents of the atmosphere. The Pierre Auger Observatory located in Argentina is the largest high energy cosmic-ray detection array in the world, composed of fluorescence telescopes, particle detectors on the ground and radio antennas. The Auger Engineering Radio Array (AERA) is composed of 153 autonomous radio stations that sample the radio emission of the extensive air showers in the 30 MHz to 80 MHz frequency range. It covers a surface of 17 km2, has a 2π sensitivity to arrival directions of ultra-high energy cosmic rays (UHECR) and provides a duty cycle close to 100%. The electric field emitted by the secondary particles of an air shower is highly correlated to the primary cosmic ray characteristics like energy and mass, and the emission mechanisms are meanwhile well understood. In this contribution, recent progress on the reconstruction of the mass composition and energy measurements with AERA will be presented.
I. INTRODUCTION
The Pierre Auger Observatory aims at solving the mysteries of the origin of the ultra-high energy cosmic rays (UHECR). Lots of progress have been done in the last 10 years: a clear cutoff is observed in the energy spectrum around 4× 10¹⁹ eV [1–3], as well as a trend
towards a heavier composition at the highest energies, the proton-air cross section is measured at 1018eV,
ex-otic scenarii are disfavored as no photon- or neutrino-like showers were detected... For a recent review of the Auger results, see [4]. The Pierre Auger Collab-oration will upgrade its instruments to increase the mass-discrimination capabilities. One way to achieve this goal is to exploit the radio signal emitted by air showers while developing in the atmosphere.
II. THE AERA EXPERIMENT
The Pierre Auger Observatory [5], the largest UHECR observatory in the world, hosts a large sur-face detector (SD) of 1660 Cherenkov tanks spread over 3000 km2, a fluorescence detector (FD) of 27
tele-scopes at 4 sites around the SD, the AMIGA instru-ment with buried scintillators for the measureinstru-ment of the muonic component of air showers, and the Auger Engineering Radio Array (AERA).
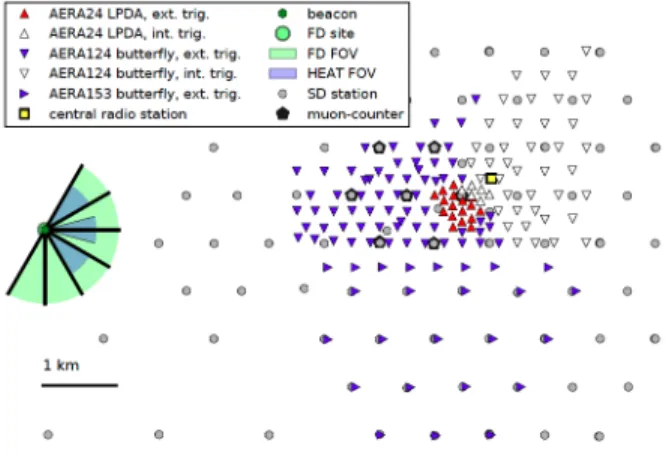
AERA consists today of 153 autonomous radio sta-tions that detect the very fast (10-30 ns) transient radio signal emitted by the secondary electrons and positrons of air showers. The electric field is detected by antennas in the band 30-80 MHz (log-periodic dipoles — LPD — in the case of the first 24 sta-tions in 2011 and butterfly dipoles afterwards) and sampled by ADCs running at 180 MHz or 200 MHz depending on the electronics in use. FIG.1shows the
FIG. 1: Map of the AERA antennas (triangles) together with the other instruments deployed at the Pierre Auger Observatory (water Cherenkov tanks, fluorescence tele-scopes and AMIGA muon counters).
current setup. The stations are powered with solar panels and are used in both self-trigger and external-trigger mode. External external-triggers come from the SD and the FD. We present here the results obtained us-ing the external-trigger data. They are calibrated in time by the usage of GPS receivers together with a beacon emission that allow to correct for clock drifts. We also use the radio transients emitted by airplanes. The overall timing accuracy is better than 2 ns [6].
The amplitude calibration has been studied in de-tail with the LPD antennas using a known calibrated source carried by weather balloons and, more recently, a remotely piloted drone. The final amplitude accu-racy is 9.3% accounting for all kinds of systematic uncertainties [7]. This calibration procedure will be applied on the butterfly antennas.
III. ELECTRIC-FIELD EMISSION MECHANISMS
Secondary charged particles created during air-shower development emit coherent radiation that ex-tends from frequencies of some kHz up to some hun-dreds of MHz. The emission extends up to the GHz domain but it is incoherent, less interesting and aban-doned today. Electrons and positrons experience mul-tiple diffusion, which is a random process, and the Lorentz force due to the geomagnetic field which is systematic. This results in a net current j perpendic-ular to the shower axis and leads to a net electric field. This is called the geomagnetic effect and is the dom-inant source of radio waves from air showers. This electric field is linearly polarized in the direction of a× B where a is the shower axis direction and B is the geomagnetic field direction. An observer detects the same polarization, independently of its position with respect to the shower axis.
The second mechanism of coherent emission is the excess of electrons over positrons. Indeed, positrons annihilate very quickly in air and, in addition to the shower electrons, more electrons are extracted from the medium through Compton, Bhabha and Moeller diffusions. This excess of electrons leads to a net and coherent electric field which is radially polarized with respect to the shower axis. This means that the cor-responding polarization depends on the observer posi-tion with respect to the shower axis. Its amplitude is one order of magnitude smaller than the geomagnetic electric field.
Both mechanisms have been detected in the data of various experiments [8–10], in particular thanks to the strong progress made in the simulation codes.
These two electric fields interfere and the final elec-tric field has a complex structure that cannot be de-scribed by a simple 1D lateral distribution function (LDF). We can use for instance a 2D function taking into account both mechanisms [11], based on the code CoREAS [12] as a model of ground distribution of the electric field. This method has been used in AERA to extract the primary energy from the radio signal. We also used the code SELFAS [13] to construct the 2D ground distribution of the electric field in order to extract the shower Xmax (see sectionIV B).
IV. PRIMARY COSMIC RAY CHARACTERISTICS FROM THE RADIO
SIGNAL
The electric field emitted by air showers is now well understood. We can therefore use the simulation to correlate the data and the model to extract the pri-mary cosmic-ray characteristics: its pripri-mary energy and its nature through the Xmaxof the shower it
cre-ated.
A. Energy
A strong correlation has been established by AERA between the shower energy measured by the FD or the SD and a radio observable, having units of energy. This observable can be interpreted as the fraction of the primary energy that is radiated in the AERA fre-quency band 30-80 MHz. The data recorded by the radio stations are first corrected for the antenna and electronics responses [14]. After this step, we obtain the three components of the electric field as a func-tion of time (together with the corresponding Poynt-ing vector) for each station participatPoynt-ing in an event. We integrate this Poynting vector over time to get the energy fluence (energy per unit area) for each station. This means that we have the energy fluence at each location of a station, i.e. the measured 2D ground distribution of the energy fluence. We fit these points with the 2D LDF. Once the best 2D LDF is obtained, we integrate it over ground coordinates to get the en-ergy radiated in the 30-80 MHz band [15, 16]. We rescale the obtained radiated energy E30−80 MHzAuger by the factor 1/ sin2αto take into account the angular
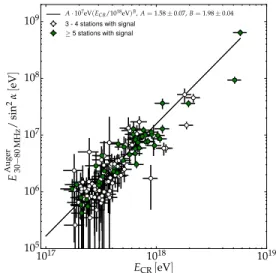
distance α from the geomagnetic field. The corrected radiated energy is quadratically correlated to the pri-mary energy ECR, as expected in the case of a
coher-ent mechanism. The correlation is shown in FIG. 2. From the measurement of the radiated energy in the
1017 1018 1019 ECR[eV] 105 106 107 108 109 E Auger 30− 80 MHz / sin 2α [ eV ] A · 107eV(E CR/1018eV)B, A = 1.58 ± 0.07, B = 1.98 ± 0.04
3 - 4 stations with signal ≥ 5 stations with signal
FIG. 2: Corrected radio energy as a function of the pri-mary energy.
30-80 MHz band, we can invert the formula to extract the primary energy:
ECR 1018eV = E30−80 MHzAuger 107 eV · 1 Asin2α !1/B
with A = 1.58 ± 0.07 and B = 1.98 ± 0.04. For a primary cosmic-ray energy of 1018eV and an angular
separation from the geomagnetic field of 90◦, we have
a radiated energy in 30-80 MHz of 15.8± 0.7 (stat) ± 6.7 (sys) MeV.
B. Xmax estimation
In this section, we explain how we perform the mea-surement of the shower Xmax using directly the
simu-lation (here with SELFAS), not using the 2D LDF as in the previous section. The basic idea is to exploit the fact that the shape of the ground distribution of the electric field depends strongly on the distance between the shower core and the point of maximum emission on the shower axis. This distance in turn strongly depends on the mass of the primary cosmic ray.
At fixed energy and zenith angle, light nuclei are more likely to interact at lower altitudes than heavier nuclei. The electric field emission is highly beamed to-wards the direction of propagation of the shower pro-ducing statistically a narrower LDF in the case of light nuclei compared to heavier nuclei. Thus, the topol-ogy of the electric field at the ground level is highly correlated to the mass of the primary, as depicted in FIG.3.
FIG. 3: Dependence of the footprint of the radio emis-sion on the mass of the primary. Two LDF are simulated with SELFAS: iron nucleus (left) and proton (right). The vertical axis represents the atmospheric depth and the hor-izontal lines account for the typical Xmaxdistributions for
proton-induced showers and iron-induced showers.
The reconstruction method is based on a compari-son of the amplitude of the detected electric field to its simulation. To reconstruct one detected shower, we use a set of simulated events having the measured arrival direction, using an arbitrary energy of 1018eV
and with realistic Xmax depths for showers initiated
by protons and iron nuclei at this energy. The total set is composed of a higher fraction of protons to account for the larger width of the distribution of the first in-teraction depths for the light nuclei. The center of the simulated LDFs is moved to several positions on the surface of the AERA array. For each tested position, the agreement between the data and the simulation
is tested with a χ2 test. This first step permits us to
reconstruct the position of the shower core. During this step the simulated amplitudes are multiplied by a scaling factor defined as the mean amplitude ratio between the data and the simulation. As the elec-tric field amplitude depends linearly on the primary energy, the value of the scaling factor at the core posi-tion allows us to reconstruct the primary energy. The χ2 values obtained with each simulated LDF at the
reconstructed core position allows the reconstruction of the detected shower Xmax as the minimum of the
function χ2= f (X
max) as shown in FIG.4.
FIG. 4: Chi-square for the fit of a detected LDF at AERA and the simulated LDFs as a function of their respective Xmax depths. The values are fitted by a square function
represented by the curve. The Xmax depth reconstructed
by the radio method for this event is given by the minimum of the quadratic function (i.e. the value that gives the best agreement), highlighted on the plot by the vertical line.
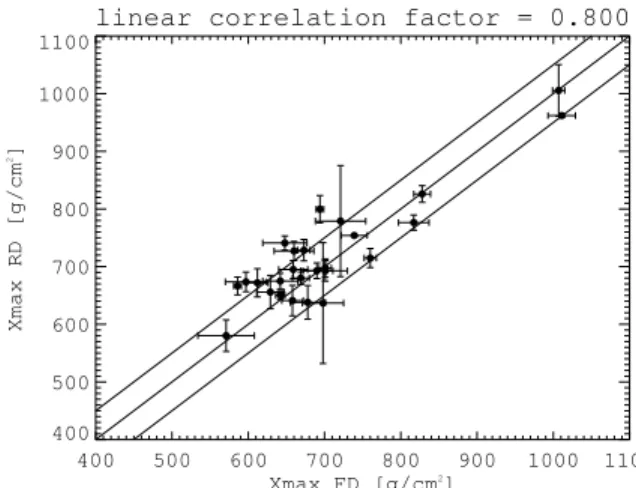
The method is applied on a high quality set of multi-hybrid (radio, FD and SD) showers passing the official FD quality cuts; we also require that at least 5 AERA radio stations participate in the event and that the shower has a zenith angle smaller than 55◦. The
cor-relation between the Xmaxreconstructed by the radio
method and the FD signal is shown in FIG.5. The reconstructed values are in good agreement with the FD measurements and the mean deviation is compatible with zero with a dispersion of 25 g/cm2.
It is important to note that these results are ob-tained using a realistic simulation of the atmosphere in SELFAS. To do so, we used the Global Data As-similation System (GDAS) [17]. It gives information (pressure, temperature and air humidity) that allows the computation of the air density as a function of the altitude on a 3 hour basis, in the neighbourhood of the AERA site. For each detected event, the data sets necessary to perform the radio reconstruction are simulated using the air density and refractivity profiles matching the actual experimental conditions at the
linear correlation factor = 0.800 400 500 600 700 800 900 1000 1100 Xmax FD [g/cm2] 400 500 600 700 800 900 1000 1100 Xmax RD [g/cm 2]
FIG. 5: Reconstructed Xmax with the radio method as a
function of the FD measurements, the middle line accounts for a one-to-one correlation and the others account for a deviation of ±50 g/cm2.
moment of the detection. The use of a stationary and fixed atmosphere description such as the US Standard model leads to a systematic shift of 17 g/cm2between
the FD measurements and the radio method together with a much larger dispersion. Thus the simulation of the atmosphere matching the experimental condi-tions is now mandatory to reach the FD precision. Using this method with a realistic description of the atmosphere, we found the same shower core than the one obtained with the SD and FD: the average differ-ence is smaller than 3 m and the dispersion is smaller than 10 m. The energy is also well reconstructed as the mean relative difference and dispersion to the SD reconstruction are 3% and 25%, respectively.
V. CONCLUSION
The latest results provided by AERA show that the radio signal contains the information needed to reconstruct all characteristics of the primary cosmic ray. The primary energy is estimated using the mea-sured radiated energy in the 30-80 MHz band in use in AERA, from a 2D LDF based on CoREAS simula-tions. The estimation is unbiased and the resolution is of the order of 17%. This radiated energy estimator is the same at any experiment site as it is normalized to the geomagnetic field strength. It is hardly dependent on environmental conditions, contrarily to the fluores-cence method because the atmosphere is transparent to radio waves in our frequency range of interest. Fi-nally, this is a reliable method as it is based on the classical emission of the electromagnetic part of the shower, which is well understood.
A pure radio method (without the need of other detectors), using only the electric field measurements, has been developed using SELFAS simulations. It has been tested on multi-hybrid (radio, SD, FD) events detected in Auger. The energy and core position are accurately reconstructed and the shower Xmax is in
excellent agreement with the FD estimation. This re-sult is obtained when using a realistic description of the atmosphere provided by the GDAS. This is not the case if we use the canonical US Standard model for the atmosphere which is not accurate enough for the level of precision we demand.
We are currently working on providing the compo-sition of ultra-high energy cosmic rays using the radio signal.
[1] J. Abraham et al. (Pierre Auger Collaboration), Phys.Lett. B685, 239 (2010), arXiv:1002.1975. [2] R. U. Abbasi et al. (HiRes), Phys. Rev. Lett. 100,
101101 (2008), astro-ph/0703099.
[3] T. Abu-Zayyad et al. (Telescope Array), Astrophys. J. 768, L1 (2013), arXiv:1205.5067.
[4] P. L. Ghia (Pierre Auger Collaboration), PoS ICRC2015, 034 (2016).
[5] A. Aab et al. (Pierre Auger Collaboration), Nucl. In-strum. Meth. A798, 172 (2015), arXiv:1502.01323. [6] A. Aab et al. (Pierre Auger Collaboration), JINST
11, P01018 (2016), arXiv:1512.02216.
[7] R. Krause and The Pierre Auger Collaboration, in Proceedings of the 14th VCI, Vienna (Elsevier, 2014). [8] V. Marin and the CODALEMA Collaboration, in Proceedings of the 32nd ICRC, Beijing, China, Vol. 1, 291 (ICRC, 2011).
[9] The Pierre Auger Collaboration, Phys. Rev. D 89, 052002 (2014).
[10] A. Bell´etoile, R. Dallier, A. Lecacheux, V. Marin, L. Martin, B. Revenu, and D. Torres Machado, As-tropart. Phys. 69, 50 (2015)
[11] A. Nelles et al., JCAP 1505, 018 (2015), arXiv:1411.7868.
[12] T. Huege and C. James, in Proceedings of the 33rd ICRC, Rio de Janeiro, Brasil (arXiv:1307.7566, 2013), id 548.
[13] V. Marin and B. Revenu, Astropart. Phys. 35, 733 (2012), arXiv:1203.5248.
[14] P. Abreu et al. (Pierre Auger Collaboration), JINST 7, P10011 (2012), arXiv:1209.3840.
[15] A. Aab et al. (Pierre Auger Collaboration), Phys. Rev. D93, 122005 (2016), arXiv:1508.04267.
[16] A. Aab et al. (Pierre Auger Collaboration), Phys. Rev. Lett. 116, 241101 (2016), arXiv:1605.02564. [17] NOAA, GDAS Archive Information