HAL Id: hal-02279855
https://hal.sorbonne-universite.fr/hal-02279855
Submitted on 5 Sep 2019
HAL is a multi-disciplinary open access
archive for the deposit and dissemination of
sci-entific research documents, whether they are
pub-lished or not. The documents may come from
teaching and research institutions in France or
abroad, or from public or private research centers.
L’archive ouverte pluridisciplinaire HAL, est
destinée au dépôt et à la diffusion de documents
scientifiques de niveau recherche, publiés ou non,
émanant des établissements d’enseignement et de
recherche français ou étrangers, des laboratoires
publics ou privés.
CD4+ Th1 immunity and exhausted PD-1+/TIM-3+ T
cells in lung cancer
Caroline Laheurte, Magalie Dosset, Dewi Vernerey, Laura Boullerot, Béatrice
Gaugler, Eléonore Gravelin, Vincent Kaulek, Marion Jacquin, Laurie Cuche,
Guillaume Eberst, et al.
To cite this version:
Caroline Laheurte, Magalie Dosset, Dewi Vernerey, Laura Boullerot, Béatrice Gaugler, et al.. Distinct
prognostic value of circulating anti-telomerase CD4+ Th1 immunity and exhausted PD-1+/TIM-3+
T cells in lung cancer. British Journal of Cancer, Cancer Research UK, 2019, 121 (5), pp.405-416.
�10.1038/s41416-019-0531-5�. �hal-02279855�
ARTICLE
Cellular and Molecular Biology
Distinct prognostic value of circulating anti-telomerase CD4
+
Th1 immunity and exhausted PD-1
+
/TIM-3
+
T cells in lung
cancer
Caroline Laheurte1,2, Magalie Dosset1, Dewi Vernerey1,3, Laura Boullerot1,2, Béatrice Gaugler4, Eléonore Gravelin1,2, Vincent Kaulek5,
Marion Jacquin2, Laurie Cuche5, Guillaume Eberst5, Pascale Jacoulet5, Elizabeth Fabre6, Françoise Le Pimpec-Barthes7, Eric Tartour8,
Marcelo De Carvalho Bittencourt9, Virginie Westeel1,5and Olivier Adotévi1,2,5
BACKGROUND: Despite the critical roles of Th1-polarised CD4+T cells in cancer immunosurveillance, the translation of their
potential to clinical use remains challenging. Here, we investigate the clinical relevance of circulating antitumor Th1 immunity in non-small cell lung cancer (NSCLC).
METHODS: The circulating antitumor Th1 response was assessed by the ELISpot assay in 170 NSCLC patients using a mixture of
HLA class II-restricted peptides from telomerase (TERT). Phenotyping of blood immune cells was performed byflow cytometry.
RESULTS: TERT-reactive CD4 T-cell response was detected in 35% of NSCLC patients before any treatment. Functional analysis
showed that these cells were effector memory and Th1 polarised capable to produce effector cytokines, such as IFN-γ, TNF-α and
IL-2. The presence of anti-TERT Th1 response was inversely correlated with the level of exhausted PD-1+/TIM-3+CD4 T cells. The level
of these two immune parameters differentially affected the survival, so that increased level of anti-TERT Th1 response and low rate
of exhausted PD-1+TIM-3+CD4+T cells were associated with a better prognosis.
CONCLUSIONS: Systemic anti-TERT Th1 response plays a strong antitumor protective role in NSCLC. This study underlines the
potential interest of monitoring circulating antitumor Th1 response for patients’ stratification and therapy decision.
British Journal of Cancer (2019) 121:405–416; https://doi.org/10.1038/s41416-019-0531-5
BACKGROUND
A functional adaptive immune system, in which tumour antigens are recognised as foreign and eliminated, is fundamental for
preventing cancer development and progression.1 Research on
cancer immunity and immunotherapy has mainly focused on the
antitumor activity of cytotoxic CD8+T cells (CTL), but cumulative
data also highlight a major role of CD4+ T cells. Among the
subpopulations of CD4+ helper T cells, CD4+Th1 subset that
produces IFN-γ, TNF-α and interleukin-2 play a well-defined role in
antitumor protection by orchestrating cell-mediated immunity
against cancer cells.2,3 This cell subset shows the capacity to
enhance tumour-specific CD8+ T-cell generation, function and
memory.4–6Tumour-reactive CD4+Th1 T cells also promote the
secretion of chemo attractants that support the entry of effector
cells into the tumour site.7,8Emerging properties of CD4+helper
T cells also indicate their involvement in inhibiting tumour
angiogenesis,9promoting cancer cell senescence,10highly
sensi-tive “neoepitope” recognition11,12 and protecting effector CTLs
from exhaustion.6,8In many human cancers, a Th1-polarised CD4+
T-cell signature within the tumour microenvironment (TME) is
associated with better survival.13,14 Furthermore, evidence
indi-cates that targeting CD4+T cells can significantly increase cancer
immunotherapy efficacy, and may induce more durable tumour
control than targeting CD8+T cells.15,16These properties
under-score the importance offinding ways to better harness the clinical
potential of CD4+helper T cells.
The comprehensive monitoring of tumour-reactive CD4+T cells
is hampered by several hurdles, such as tumour antigen selection, HLA class II polymorphism, low frequencies of antigen-specific
CD4+ T cells and the plasticity of CD4+ helper T cells.17 One
approach to circumventing these obstacles involves the ability of
CD4+ T cells to recognise degenerate HLA class II-restricted
epitopes from relevant shared tumour-associated antigens.18–21
In this study, we investigated the clinical significance of
circulating antitumor CD4+Th1 response in patients with
non-small cell lung cancer (NSCLC). To this end, we quantified
Received: 20 January 2019 Revised: 25 June 2019 Accepted: 3 July 2019 Published online: 30 July 2019
1
University Bourgogne Franche-Comté, INSERM, EFS BFC, UMR1098, Interactions Hôte-Greffon-Tumeur/Ingénierie Cellulaire et Génique, F-25000 Besançon, France;2
INSERM CIC-1431, Clinical Investigation Center in Biotherapy, Plateforme de Biomonitoring, F-25000 Besançon, France;3
Department of medical Oncology, Methodology and Quality of Life Unit in Oncology, University Hospital of Besançon, F-25000 Besançon, France;4UPMC Univ Paris 06, INSERM UMR 938, Centre de Recherche Saint-Antoine, Sorbonne Universités, F-75012 Paris, France;5
Department of Pneumology, University Hospital of Besançon, F-25000 Besançon, France;6
Department of medical Oncology, Assistance Publique-Hôpitaux de Paris, Hôpital Européen Georges Pompidou, Paris, France;7Department of Thoracic surgery, Assistance Publique-Hôpitaux de Paris, Hôpital Européen Georges Pompidou, Paris, France;8
Department of Biological Immuology, Assistance Publique-Hôpitaux de Paris, Hôpital Européen Georges Pompidou, Paris, France and9
University Hospital of Nancy and CECITA team, IMOPA UMR7365 University of Lorraine/CNRS, Laboratory of Immunology, Vandoeuvre-les-Nancy, France
Correspondence: Olivier Adotévi (olivier.adotevi@univ-fcomte.fr)
functional telomerase (TERT)-reactive CD4 T cells as a surrogate marker of antitumor Th1 response by using a mixture of HLA class
II-restricted peptides.22–24 Our results showed an unexpected
relationship between the circulating TERT-reactive CD4+ Th1
response and accumulated exhausted PD-1+/TIM-3+CD4+T cells.
It appears that a robust circulating anti-telomerase CD4+ Th1
response plays a strong protective role in NSCLC patients, while
high level of exhausted PD-1+/TIM-3+CD4 T cells in peripheral
blood is associated with poor prognosis. Thus, the level of
adaptive antitumor CD4+Th1 immunity in peripheral blood could
be used for NSCLC stratification.
METHODS
Patients and study design
The TeloCap01 study is a prospective multicentric
immunomoni-toring study conducted in patients with stage I–IV NSCLC. The
primary objective of this study was to evaluate the landscape of
telomerase-specific CD4+T-cell responses in patients with NSCLC.
Between July 2010 and January 2014, 170 patients with NSCLC were included from the University Hospital of Besançon (Besan-çon) and the European Hospital Georges Pompidou (Paris). Before any therapy, including surgery, we collected and isolated blood lymphocytes, sera and plasma, which were frozen until use. Survival data were collected at 1 and 2 years after inclusion. Blood cells were also collected from anonymous healthy donors from the Etablissement Français du Sang (EFS, Besançon, France), following EFS guidelines. All patients and healthy donors gave their signed informed consent, and the protocol was approved by local ethic committees and the French national drug agency (N°EUDRACT: 2009-A00642-55).
Synthetic tumour antigen-derived peptides
To measure telomerase-specific CD4+ T-cell responses in blood,
we used a mixture of eight highly promiscuous DR and HLA-DP4-binding 15-mer peptides derived from telomerase (TERT),
which has been previously described by our group.24–26In some
experiments, we used mixtures of 15-mer peptides derived from NY-ESO-1 or Wilms tumour (WT-1). To evaluate the antiviral T-cell
responses, we used peptide mixtures derived from influenza virus
(Flu), Epstein Barr virus (EBV) and cytomegalovirus (CMV) (PA-CEF-001), which were purchased from JPT (Germany) or CTL (Cellular Technology Ltd, Germany) at >80% purity.
In vitro stimulation for the detection of tumour-reactive CD4+Th1
responses in blood
Telomerase-specific CD4+ Th1 responses were assessed in
peripheral blood mononuclear cells using a standard IFN-γ ELISpot
assay, following in vitro stimulation, as previously described.24–26
Briefly, PBMCs (3–4 × 10⁶
) were cultured for 6 days in 24-well
plates in the RPMI with 5% human serum and 1%
penicillin–streptomycin, along with the mixture of TERT-derived
peptides (5 µg/mL). Recombinant interleukin 7 (IL-7; 5 ng/mL; Peprotech) was added on day 1, and recombinant interleukin-2
(IL-2; 20 UI/mL; Novartis) was added on day 3. In some patients’
samples, stimulation was performed with a mixture of peptides derived from NY-ESO-1 and WT-1. To assess antiviral T-cell responses, cells were stimulated with a mixture of peptides derived from CMV, EBV and Flu (1 µg/mL), following a similar
procedure. Then, the presence of specific T cells was measured
using IFN-γ ELISpot assay or cytokine intracellular staining.
IFN-γ ELISpot assay
ELISpot assay was performed according to the manufacturer’s
instructions (Diaclone, France). Briefly, lymphocytes from in vitro
stimulation (105per well) were incubated for 18 h at 37 °C in an
ELISpot plate pre-coated with anti-human IFN-γ monoclonal antibody, with or without peptide mixtures in the X-vivo 15
medium (Ozyme, BE04-418). Cells cultured with medium alone or PMA/ionomycin (5 µg/mL; Sigma-Aldrich, L2759) were used as
negative and positive controls, respectively. IFN-γ-secreting T cells,
i.e., spot-forming cells in this assay, were counted using the C.T.L. Immunospot system. After subtracting the negative control values
(background), we calculated the number of IFN-γ spots per 105
cells. A response was considered positive if the number of IFN-γ
spots per 105 cells was both >10 and more than two times the
background.27 The results are presented as a ratio, calculated as
follows: [(number of spots in the TERT-peptide conditions) −(number of spots in the medium conditions)]/(number of spots in the medium conditions). All experiments were conducted in triplicate.
Flow cytometry
Absolute numbers of T cells, B cells and NK cells were determined
in fresh samples using a single-platformflow cytometry approach,
applying the TetraCXP method with Flow-Count fluorospheres
(Beckman Coulter, Villepinte, France) and TetraCHROME antibodies (CD45/CD4/CD8/CD3/CD19/CD56, Beckman Coulter), according to
the manufacturer’s recommendations. Blood immune cells,
includ-ing Tregs(CD3+CD4+CD127−CD25+FOX-P3+) and exhausted T cells
(PD-1+TIM-3+), were measured in thawed PBMCs using flow
cytometry. Briefly, PBMCs were thawed and incubated for 10 min at
4 °C with Fixable viability dye (eBioscience), and then for 30 min at 4 °C with the corresponding surface antibodies. In some experi-ments, Ki-67 staining (Miltenyi) was performed. For intracellular
staining (FOXP-3, Ki-67), cells werefixed and permeabilised using
the Foxp3/Transcription Factor Staining Buffer Set (00-5523-00, eBioscience), following the manufacturer’s protocol.
For intracellular cytokine staining (ICS), cells were incubated
with TERT peptides (5μg/ml) in the X-vivo 15 medium. After 6 h,
BDGolgiPlug™ (BD Biosciences) was added, and cells were stimulated 15 h before staining with antibodies against CD3,
CD4, CD8, IFN-γ, TNF- α, IL-2 and IL-17 using DuraCloneTM IF T
activation or DuraCloneTMIF T helper (Beckman Coulter). In some
ICS experiments, following markers ICOS, CCR7, CD45RA, CXCR3 and CCR6 were used for phenotypic analysis. Cells were acquired
on FACSCanto™ II cytometer (BD Biosciences), and data were
analysed using FACSDiva™ and Kaluza™ softwares. A table in
the Supplementary Methods presents the complete list of monoclonal antibodies used for immune cells characterisation. In vitro blockade of immune checkpoint receptors
PBMC (2 × 10⁶) were cultured in 24-well plates with TERT-derived
class II peptides as above and with the following blocking antibodies: anti-PD-1 (Nivolumab, BMS, Pharmacy unit, University Hospital Besançon), anti-TIM-3 (clone F38-2E2, eBioscience) and anti-PD-L1 (clone MIH1, eBioscience). Blocking antibodies (5 µg/ml) were added in the culture at day 0 and day 3. Cells cultured in
presence of mouse IgG1 κ (clone P3.6.2.8.1, eBioscience) and
human IgG4 (clone ET904, Biolegend) isotypes were used as control for anti-PD-L1/anti-TIM-3 and anti-PD-1 antibodies,
respec-tively. Specific CD4 T-cell responses were measured after 6 days of
in vitro stimulation with IFN-γ-ELISpot and ICS.
Blood cytokines measurement
In the patients’ sera samples, we assessed a panel of cytokines,
including IL1β, IL-5, IL6, Il-8, IL-13, IL17, IL10, TNF-α and TGFβ,
using a Cytometric Bead Array kit, CBA assay (BD Biosciences),
following the manufacturer’s instructions.
Statistics
Descriptive statistics are described as mean or median, with the interquartile range for continuous variables. The non-parametric Student’s t test (Mann–Whitney U-test) was used for two-group comparisons. Categorical variables were expressed as frequency
(percentage). Proportions were compared using the χ2 test or
406
1234567
Fisher’s exact test, as appropriate. We performed hierarchical cluster analysis and constructed dendrograms using the online
Morpheus software and robust Z-score normalisation (https://
software.broadinstitute.org/morpheus/). To explore the
relation-ship between anti-TERT CD4 Th1 response and all blood immune parameters, we used a principal component analysis (PCA) approach, using the dudi.pca module of the ade4 package of R software (version 2.10.1). For survival analysis according to anti-TERT Th1 response, we determined a threshold using the
median ratio (3.7, IQR: 2.6–7.5) of IFN-γ spots between the
TERT-derived peptides stimulation and the negative control. Overall survival (OS) was calculated from the date of study enrolment to the date of death from any cause. Surviving patients were censored at the time of their last follow-up assessment. OS was estimated using the Kaplan–Meier method, described using
median or rate at specific time points and 95% confidence
interval (95% CI), and compared among the groups using the log-rank test. For comparisons among multiple groups, we performed analysis of variance (ANOVA) with Bonferroni correction. Cox proportional hazard models were used to estimate the hazard ratio (HR) and 95% CI for factors associated
with OS. We first performed univariate Cox analysis to assess
the association of parameters with OS. Then parameters with
P-values of <0.05 were entered into thefinal multivariable Cox
regression model. To check the assumption of proportionality,
we plotted log-minus–log-survival curves and constructed
cumulative martingale process plots. All analyses were per-formed using SAS version 9.4 (SAS Institute, Cary NC), R software version 2.15.2 (R Development Core Team, Vienna, Austria;
http://www.r-project) and Prism software version 6 (Graph Pad
software, La Jolla, CA, USA). Considering the descriptive and exploratory approaches used, P-values were uncorrected for multiple testing. All tests were two sided, and differences were
considered statistically significant at the level of P < 0.05.
RESULTS
Circulating TERT-reactive CD4+T cells are effector memory and
Th1 polarised in NSCLC patients
To measure pre-existing antitumor CD4+Th1 response in NSCLC
patients, we quantified telomerase-reactive CD4+T-cell response
by IFN-γ ELISpot assay using a mixture of highly promiscuous
HLA class II-restricted peptides derived from telomerase as
previously described22–25(Fig.1a). We evaluated this response in
170 treatment-naive NSCLC patients and 22 healthy donors (HD)
as control. Patients’ main clinical characteristics are depicted in
Supplementary Table 1. The presence of spontaneous
TERT-reactive CD4+T-cell response was found in 59 NSCLC patients
(35%). The median ratio of anti-TERT CD4+T cells was 3.7 (IQR:
2.6–7.5) in responders patients, and the distribution showed two
groups with low and high responses (Fig.1b–d). The frequency
of TERT-specific CD4+ T cells in age-matched HD was 45%
(10/22) in accordance with recent observation reporting high
precursor frequencies of tumour antigen-specific CD4+T cells in
healthy subjects (Supplementary Fig. 1).21 No change of
anti-TERT CD4+T-cell response was observed according to patients’
main clinical characteristics, such as age, smoking status, histology and mutational status (Supplementary Table 2). To
exclude possible abnormality of antigen-specific memory T cells
compartment, we concomitantly measured T-cell reactivity
against a mixture of viral peptides (CMV, EBV, Flu) by IFN-γ
ELISpot. As expected, the antiviral recall T-cell responses were detected in the majority of patients (81%) and healthy subjects (94%) (Supplementary Fig. 1). Thus, the absence of anti-TERT Th1 response was not related to an intrinsic incapacity of T cells to respond to a stimuli.
Phenotypic characterisation using CCR7 and CD45RA differen-tiation markers showed that, in contrast to IFN-γ-negative
population, TERT-specific CD4+T cells detected by ELISpot assay
were CCR7-CD45RA- corresponding to effector memory
pheno-type and also overexpressed activation marker ICOS (Fig.1e). We
also demonstrated CXCR3 but not CCR6 expression on circulating TERT-reactive CD4 T cells, characteristic of a Th1 phenotype
(Fig. 1f). Besides the IFN-γ production, these cells concurrently
produced TNF-α, and IL-2, but neither IL-4 nor IL-17 in response to
TERT stimulation (Fig. 1g). Thus, pre-existing TERT-specific CD4+
T cells detected in NSCLC patients are polyfunctional and effector memory Th1 cells.
The presence of anti-TERT Th1 response is inversely correlated with
the level of exhausted PD-1+/TIM-3+T cells in NSCLC patients
To identify immune factors likely to influence the circulating anti-TERT Th1 response, we concurrently measured additional blood immune parameters, including lymphocyte subsets, regulatory
T cells (Tregs) and cytokines. As expected, the presence of anti-TERT
Th1 response was associated with CD4, but not with CD8, NK or B lymphocyte count in blood (not shown).
Unsupervised clustering analysis revealed that the anti-TERT Th1 response was differently clustered compared with NK cells,
inflammatory and inhibitory cytokines, T cells expressing
exhaustion markers PD-1 and/or TIM-3 (PD-1+/TIM-3+), and
antiviral T-cell responses. Notably, the heatmap identified a
group of patients with low levels of PD-1+/TIM-3+T cells, which
predominantly included the anti-TERT Th1 responders (Fig.2a).
We also performed PCA to dissect the mutual interactions of these blood immune factors, which revealed that these factors
were grouped similarly as in the heatmap clustering (Fig.2b, c).
We identified four distinct immune patterns, which segregated according to the two axes of the PCA. Surprisingly, the circulating anti-TERT Th1 response appeared as an independent factor in the correlation circles, which was opposite to factors
that drive immunosuppression, including Tregs, IL-6 and mainly
PD-1+/TIM-3+CD4+T cells (Fig.2b, c).
Thus, we focused on the relationship between anti-TERT Th1
response and PD-1+/TIM-3+T cells. Firstly, we showed that the
rate of both CD4+ and CD8+T cells expressing PD-1 or TIM-3
was higher in NSCLC patients than HD. Notably, the circulating
T cells co-expressing both PD-1 and TIM-3 (PD-1+TIM-3+T cells)
were preferentially detected at high level in NSCLC patients
(Fig.2d, e). As shown in Fig.3a, patients with an anti-TERT Th1
response had significantly lower rates of circulating PD-1+
/TIM-3+CD4+ T cells than non-responders NSCLC patients.
Particu-larly, the association with the presence of anti-TERT Th1 response was more pronounced with TIM-3 expressing CD4
and CD8 T cells (Fig. 3b). No obvious relationship was found
between the intensity of anti-TERT Th1 response and circulating
level of PD-1+/TIM-3+CD4+T cells (not shown). In addition, the
antiviral T-cell responses were not affected by PD-1+/TIM-3+
T cells in cancer patients (Fig.3c, d).
PD-1 and TIM-3 are inhibitory receptors involved in T cells
exhaustion.28,29 These receptors are commonly expressed on
antigen-experienced T cells in the context of a chronic antigen stimulation (virus infection or cancer), and T-cell co-expressing PD-1 and TIM-3 were characterised by a loss of most T-cell
functions.28,29 So, we investigated the functions of circulating
PD-1+/TIM-3+T cells detected in NSCLC patients. As expected,
we showed low expression of the proliferation marker Ki-67 on
PD-1+/TIM3+ CD4+ T cells and in PD-1+/TIM3+ CD8+ T cells
(Fig.3e and not shown). We next evaluated the capacity of these
cells to produce Th1-associated cytokines when PD-1 and TIM-3 pathways were disrupted. Hence, the addition of blocking antibodies against the PD-1/PD-L1 axis or against TIM-3
effectively restored IFN-γ and TNF-α production by T cells in
response to tumour antigens (Fig.3f, g). Thus circulating PD-1+/
TIM-3+T cells dysfunction observed was characteristic of a T-cell
exhaustion state.
NSCLC (n = 170) PBMC a e f g b c d + TERT 6 days ELISpot 500 0 Medium TERT 20 40 60 80 100 107 105 106 105 104 103 102 106 105 104 103 102 –10,000 10,000 105 106 107 0 –10,000 10,000 105 106 107 0 104 103 103 104 105 106 106 105 CD4 CCR7 CD454RA CD4 106 105 104 103 102 102 103 104 105 106 107 102 103 104 105 106 107 –10,000 0 10,000 105 106107 102 103 104 105 106 107 102 103 104 105 106 102 103 104 105 106 107 102 103 104 105 106 105 104 2000 –4000 0 106 107 102 103 104 105 106 107 102 103 104 105 106 107 106 105 104 103 102 106 105 104 103 102 107 106 105 104 103 102 107 106 105 104 103 102 106 105 104 103 102 106 105 104 103 102 106 105 104 103 102 107 106 105 104 103 102 107 106 105 104 103 102 %Gated CCR7 CD454RA Medium TERT Medium TERT 0.32% 0.77% 0.45% 1.10% TCM 2% Naive 1% 95% TEM 1% TEMRA TCM 6% Th1 Th2 93% 1% Naive 49% 38% TEM 8% TEMRA 104 0 –5000 107 106 105 105 1.5 %Gated 1 0 103 104 105 106 ICOS 95% Isotype IIFN-γ+ CD4+ CXCR3+ CCR6+ 103 102 104 105 106 104 103 104 0 –5000 –20,000 0 20,000 105 106 107108 –20,000 0 20,000 105 106 107108 128 NEG anti-TERT Th1 POS 111 (65%) 59 (35%) 170 64 32 16 8 4 2 1 400 300 200 IFN γ spots/10 5 cells IFN-γ IFN-γ IFN-γ 0.04% 0.04% 0.04% 0.04% 0.04% 0.39% 0.75% 0.62% 0.03% 0.05% Medium TERT CD4 CD4
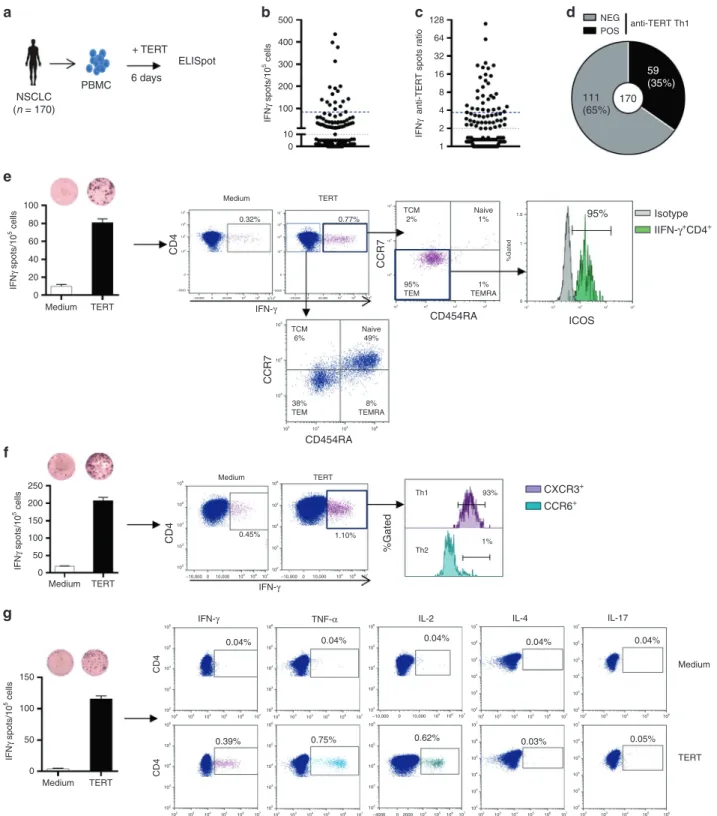
TNF-α IL-2 IL-4 IL-17
IFN γ spots/10 5 cells 0 Medium TERT Medium TERT 50 100 150 200 250 IFN γ spots/10 5 cells 0 50 100 150 IFN γ spots/10 5 cells IFN
γ anti-TERT spots ratio
100
10 0
Fig. 1 Distribution and functional characterisation of TERT-specific CD4+T cells in patients with NSCLC. a TERT-specific CD4+T-cell responses
were evaluated in 170 naïve-NSCLC patients by IFN-γ ELISpot assay performed after an in vitro stimulation of PBMC with HLA class II peptides derived from TERT. b, c Distribution of anti-TERT IFN-γ CD4+T cells in NSCLC patients (n= 170), shown as the number of spots (b), and ratio of spots (c). Grey lines indicate the positivity thresholds, and blue lines indicate the median of spots calculated in responders patients. dFrequency of patients with negative (NEG) and positive (POS) anti-TERT Th1 responses. e–g Phenotypic and functional characterisation of anti-TERT CD4+T cells detected byflow cytometry. e Dot plots of one representative patient show CCR7 and CD45RA and ICOS staining in IFN-γ−/IFN-γ+CD4+T cells. f Dot plots of one representative patient show CXCR3 and CCR6 staining in IFN-γ+CD4+T cells. g Dot plots of one representative patient show IFN-γ, TNF-α, IL-2, IL-4 and IL-17 cytokines production in response to TERT stimulation. The data are representative of three independent experiments
NSCLC progression is associated with a decrease of functional
anti-TERT Th1 response and accumulation of exhausted PD-1+
/TIM-3+CD4+T cells
The concept of cancer immune surveillance suggests that tumour progression is accompanied by an accumulation of immune
escape factors, to the detriment of effector T-cell immunity.1,30
Therefore, we explored whether NSCLC stage progression was
accompanied by changes in the anti-TERT Th1 response and the level of exhausted T cells.
We found a significantly higher rate of exhausted PD-1+/TIM-3+
CD4+T-cell subsets in metastatic patients (stage IV, n= 83) than
localised one (stages I–III, n = 87). But no obvious stage-related
difference was observed with exhausted PD-1+/TIM-3+ CD8+
T cells (Fig. 4a, b; Supplementary Table 3). Conversely, the
Row min Row max
Anti viral T cell response Lymphocytes CD4 T cells CD8 T cells TGF-β Anti-TERT Th1 response TREG IL-6 CD4 TIM-3+ CD8 TIM-3+ CD4 PD-1+ CD4 PD-1+ TIM-3+ CD8 PD-1+ TIM-3+ CD4+ PD1+ TIM3+ CD8+ PD1+ TIM3+ CD4+ PD1+ CD8+ T CD4+ T Lymphocyte
Anti viral T cells response
Anti-TERT Th1 positivity TREG CD4+ TIM3+ CD8+ TIM3+ CD8+ PD1+ IL-6 CD4+ PD1+ TIM3+ CD8+ PD1+ TIM3+ CD4+ PD1+ TREG CD4+ TIM3+ CD8+ TIM3+ CD8+ PD1+ IL-6 NK IL-10 IL-5IL-17 IL-13 IL-1 TNF IL.8 NK
IL-10 IL-5 IL-17IL-13 IL-1 TNF IL.8 TGFβ CD8+ T CD4+ T Lymphocyte
Anti viral T cells response
Anti-TERT Th1 magnitude TGFβ NK IL-1β IL-17A TNF IL-5 IL-13 IL-10 CD8 PD1+ IL-8 105 6.10% 5.14% 4.38% 2.43% 9.62% 3.31% 1.90% 3.58% 66.8% 27.8% 88.3% 4.86% 104 103 101 102 103 104 105 101 102 103 104 105 0 103 104 105 0 PD-1 105 104 103 –103 0 TIM-3 105 104 103 –103 0 TIM-3 105 104 103 –103 0 PD-1 105 104 103 –103 0 TIM-3 104 103 –103 0 TIM-3 CD4 PD-1 on CD4 on CD8 0 104 105 106 CD8 0 104 105 CD8 104 105 PD-1 CD4 a b d e 30 20 % CD4 +PD-1 + T cells 10 0 20 ns ns ns 15 % CD4 +TIM3 + T cells 10 5 0 50 40 % CD8 +PD1 + T cells 30 20 10 0 40 % CD8 +TIM3 + T cells 30 20 10 0 0 2 4 6 8 10 10 15 20 25 8 6 % CD4 +PD1 +TIM3 + T cells % CD8 +PD1 + TIM3 + T cells 4 2 0 HD NSCLC HD NSCLC HD NSCLC HD NSCLC HD NSCLC HD NSCLC c
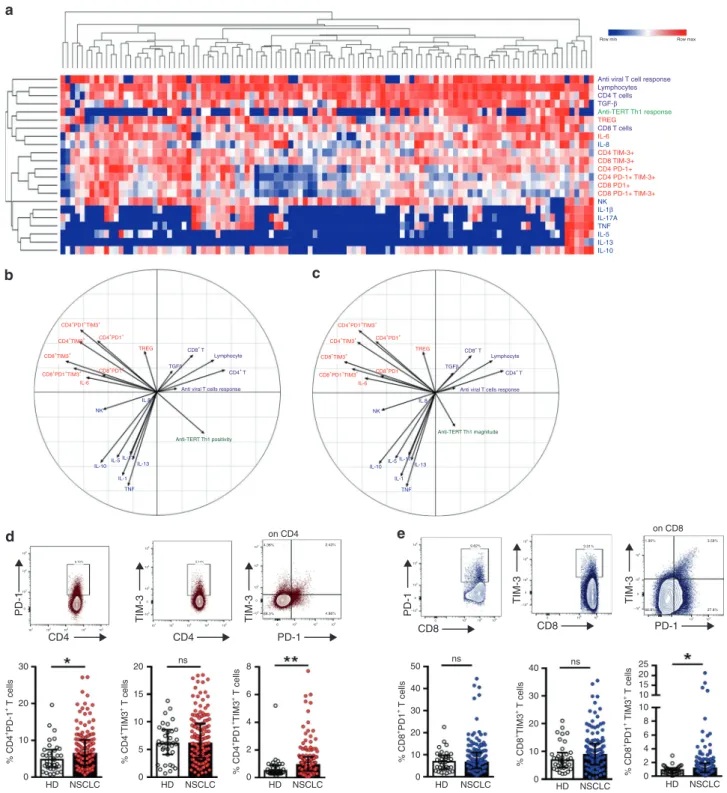
Fig. 2 Relationship between TERT-specific CD4+Th1 response and blood immune factors in patients with NSCLC. a Heatmap illustrating
hierarchical clustering (Euclidean distance) of 22 blood immune parameters (in rows) from NSCLC patients (n= 110) (in columns). b, c Unsupervised principal component analysis (PCA), including frequency (b) and magnitude (c) of anti-TERT Th1 response in relation to 21 blood immune parameters. d, e Representative dot plots (top row) show expressions of PD-1 and/or TIM-3 among CD4+T cells (d) and CD8+ T cells (e). Histograms show peripheral T-cell expression levels of PD-1, TIM-3 and PD-1+TIM-3+among CD4+T cells (d) and CD8+T cells (e) from healthy donors (HD, n= 35) and NSCLC patients (n = 109). Median and interquartile range (IQR) are indicated (Mann–Whitney test). *P < 0.05; **P < 0.01. ns not significant
frequency of anti-TERT Th1 response gradually decreased with stage progression: 44.8% (39/87) versus 24% (20/83) in localised
versus metastatic, respectively (P= 0.004). Accordingly, we found
that the ratio of anti-TERT Th1 cells to exhausted PD-1+/TIM-3+
CD4+T cells was significantly lower in metastatic than localised
disease (Fig. 4c, d). The decrease of antitumor T-cell response in
the metastatic stage was also found with two additional shared
tumour-associated antigens such as WT-1 and NY-ESO-1 (Fig.4e).
In contrast, the antiviral T-cell responses were preserved through-out NSCLC stages, suggesting that these responses were not 30 a c e f g b d 30 20 15 10 5 0 20 10 10 50 40 25 20 15 10 5 0 30 20 10 0 40 30 20 10 0 8 6 4 2 0 0 0 + + + – 20 TERT TERT + Ctrl CD4 + anti-PD-L1 Anti-PD-1 + + + – TERT Anti-TIM-3 + + + – + + + – TERT Anti-PD-L1 + + + – NYESO-1 Anti-PD-L1 40 60 80 100 120 150 250 200 150 100 50 0 100 50 0.6 0.4 0.2 0.0 0.6 0.4 0.2 0.0 0 20 20 15 10 5 0 20 50 ns ns ns ns ns ns ns ns 40 30 20 10 0 40 25 20 15 10 5 0 30 20 10 0 15 10 5 0 0 1 2 3 4 4 8 NEG PD-1+ CD4+ PD-1+TIM-3+ CD4+ CD4+ CD4+ 1.3% 104 103 103 105 105 104 104 103 103 0 105 104 103 0 0 105 104 103 0 102 102 101 101 100 100 0 103 102 101 100 0 0 103 102 101 100 0 104 105 104 1000 –1000 0 105 104 2000 –2000 0 105 2000 –2000 2000 0 0 104 105 2000 –2000 0 0.4% 6.3% 0.2% 0.02% 1.5% 1.8% 5.9% PD-1 TIM-3 Ki-67 Ki-67 IFN γ spots/10 5 cells TNF α %CD4+IFN γ+ %CD4+TNF α + TNF γ IFN-γ spots/10 5 cells IFN-γ spots/10 5 cells Ki-67 Count PD-1–TIM-3– PD-1+ CD8+
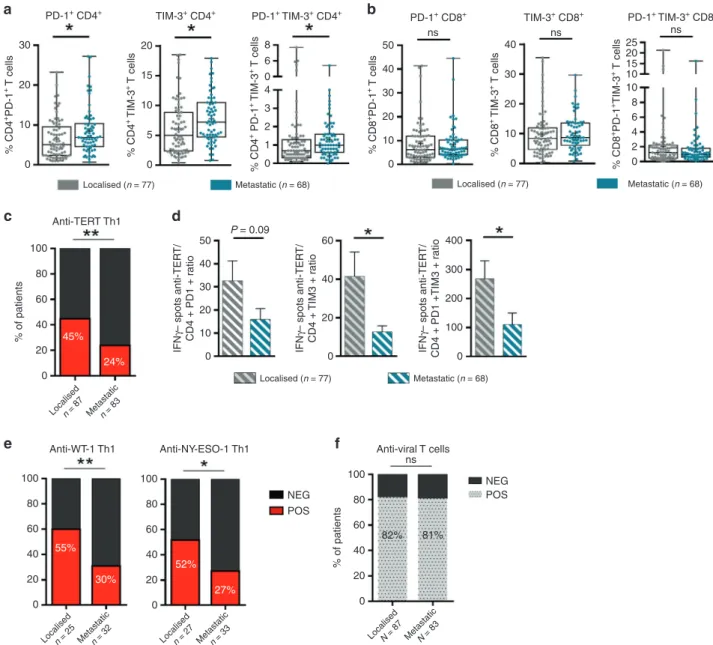
TIM-3+ CD4+ PD-1+TIM-3+ CD4+ TIM-3+ CD8+ PD-1+TIM-3+ CD8+
%CD4 + PD-1 + T cells %CD4 + PD-1 + T cells %CD4 + TIM-3 + T cells %CD4 + TIM-3 + T cells %CD8 + TIM-3 + T cells %CD8 + TIM-3 + T cells %CD4 +PD-1 +TIM-3 + T cells %CD4 +PD-1 +TIM-3 + T cells %CD8 +PD-1 +TIM-3 + T cells %CD8 +PD-1 +TIM-3 + T cells %CD8 +PD-1 + T cells %CD8 +PD-1 + T cells POS
NEGPOS NEG POS NEG POS NEG POS NEG POS NEG POS
NEG Anti-TERT Th1
Anti-viral Th1 Anti-viral Th1
Anti-TERT Th1
POS NEG POS NEG POS NEG POS NEG POS
related to NSCLC evolution (Fig. 4f). Thus, in NSCLC, tumour growth was associated with a decrease of circulating antitumor
Th1 responses, but an accumulation of exhausted PD-1+/TIM-3+
CD4+T cells.
Anti-TERT Th1 response and exhausted PD-1+/TIM-3+CD4+T cells
have distinct prognostic value in NSCLC
To assess the prognostic value of circulating anti-TERT Th1
immunity and exhausted PD-1+/TIM-3+T cells in this cohort of
treatment-naive NSCLC, we considered two groups of patients with low versus high circulating rates of these two immune parameters (see details in the Methods section and Supplemen-tary Table 3).
Regardless the immune parameters, the median OS was 13 months in the metastatic population and not reached in localised patients, which is in line with the literature (data not
shown).31,32 We found that NSCLC patients who exhibited high
rates of anti-TERT Th1 cells (anti-TERT Th1high) had better median
OS compared with patients with anti-TERT Th1low (not reached
versus 12 months, P= 0.009). The two-year survival rate was
2.5-fold higher in the anti-TERT Th1highgroup compared with the
anti-TERT Th1low group (59% versus 22%, respectively; P= 0.006)
(Fig.5a). This survival benefit was observed both in localised (not
reached versus 21 months, P= 0.050) and in metastatic NSCLC
(median OS of 17 versus 9 months, P= 0.023) (Fig.5b, c). Of note,
the metastatic patients received first-line therapy with platinum
doublet chemotherapy (91%, 74/81) and seven patients with tyrosine kinase inhibitors. None of them have been treated with immune checkpoint inhibitors. So the difference in survival in this
population could not be associated with the differences in
first-line treatment (not shown).
Next, the prognostic value of exhausted PD-1+/TIM-3+T cells
was evaluated. No association was found with PD-1+/TIM-3+CD8+
T cells and clinical outcome in this cohort (not shown). Among immune responder patients, the presence of high rate of
exhausted PD-1+TIM-3+CD4+T cells was associated with a poor
survival, the median OS was 12 months in this group and not
reached in CD4+PD-1+TIM-3+lowgroup (P= 0.05). This effect was
particularly observed in patients with localised disease (Fig. 5d;
Supplementary Fig. 2). Although, the rate of T cells expressing the single receptor PD-1 did not affected patients clinical outcome, some trend of a negative association was found with high level of
TIM-3+ CD4+ T cells (Supplementary Fig. 2). Univariate and
multivariate Cox analysis confirmed that both the circulating
anti-TERT Th1 cells and PD-1+TIM-3+CD4+T cells were significantly
but inversely associated with the survival and independent of
metastatic stage (Table1).
Based on our findings, we stratified patients into three
prognostic groups (best, intermediate and poor) according to these two immune parameters. The best group represents
patients with anti-TERT Th1high/exhausted CD4+PD-1+TIM-3+low
profile (median OS not reached), the group of patients with
anti-TERT Th1low/exhausted CD4+PD-1+TIM-3+highprofile had a poor
prognosis (median OS= 4 months) and the third group with
intermediate survival had a similar evolution of the two immune
parameters (high/high or low/low) (Fig. 5e, f). This stratification
highlighted that anti-TERT Th1 response plays a strong antitumor
protective role over the level of exhausted PD-1+/TIM-3+T cells.
Collectively, ours results indicated that the level of anti-TERT Th1
response and exhausted PD-1+TIM3+CD4+ T cells have distinct
prognostic value in NSCLC, so that the decrease of functional
anti-TERT Th1 cells and increase of exhausted PD-1+TIM-3+CD4+
T cells were associated with disease progression (Fig.5g).
DISCUSSION
Numerous aspects of CD4+T-cell biology suggest that these cells
are required for effective antitumor immunity and immunother-apy. Importantly, they have the ability to eliminate cancer cells,
mainly in an indirect manner by influencing the TME.2,5Despite
these critical antitumor immune functions, the clinical significance
of CD4+Th1 cells remains scarcely exploited. In this study, we
performed a comprehensive systematic analysis of circulating
antitumor CD4+Th1 response across NSCLC clinical stages, using
anti-telomerase CD4+ T-cell response as a surrogate marker of
antitumor Th1 immunity. This approach enables dynamic
mon-itoring of IFN-γ-producing tumour-reactive CD4+T cells using an
ELISpot assay, regardless of HLA type.22–26 Around 35% of
therapy-naive NSCLC patients harboured circulating anti-TERT
Th1. This proportion was in line with our previousfindings, and
with the overall prevalence of tumour-infiltrative lymphocyte (TIL)
positivity identified in many human cancers.14 The frequency of
patients with circulating anti-TERT Th1 immunity decreased with NSCLC progression, being only 24% among metastatic stage IV
compared with 45% and 55% in localised I–III and I–II stages,
respectively. This lower frequency found in metastatic patients compared with localised ones and in healthy subjects (45%) suggested that tumour progression is associated with a defect of
pre-existing anti-TERT CD4+ Th1 immunity. Indeed, a similar
decrease of T-cell responses directed against NY-ESO1 and WT-1 was observed, in metastatic stage. Interestingly, we demonstrated that the presence of a strong pre-existing anti-TERT Th1 response in blood was significantly associated with better OS in NSCLC patients with both localised and metastatic disease. In line with
ourfindings, previous studies have also reported clinical benefits
of pre-existing or therapy-induced circulating IFN-γ-secreting
CD4+ T cells against NY-ESO-1, 5T4, SOX2 and HPV-16.15,33–36
These data support that a pre-existing antitumor CD4+
Th1 signature in peripheral blood may confer tumour protection. However, given the descriptive nature of our study, it would be
needed to validate these findings in another external cohort.
Nevertheless, these results prompt us to stimulate anti-TERT CD4+
T-cell response in NSCLC patients (NCT2818426).
The protective role associated with anti-TERT Th1 response could be explained by the functional characteristics of these cells.
Indeed, TERT-reactive CD4+ T cells detected in NSCLC patients
were effector memory cells and polyfunctional Th1-polarised
capable to produce effector cytokines such as IFN-γ, TNF-α and
IL-2. Indeed, many evidences support that CD4+ Th1 subset
orchestrates cell-mediated immunity against cancer cells mainly
by enhance tumour-specific CD8+ T-cell functions, survival and
migration in the TME. These antitumor roles of CD4+Th1 cells are
Fig. 3 Inverse correlation between the presence of anti-TERT CD4+Th1 response and the level of exhausted PD-1+TIM-3+T cells. a, b Levels of
circulating PD-1+and/or TIM-3+CD4+T cells (a) and CD8+T cells (b) in patients with anti-TERT Th1 response (n= 49) and in non-responders (n= 96) (Mann–Whitney test). c, d Levels of circulating PD-1+and/or TIM-3+CD4+T cells (c) and CD8+T cells (d) in patients with antiviral Th1 response (n= 116) and in non-responders (n = 28) (Mann–Whitney test). Box spans indicate median and 25th–75th percentile, whiskers indicate the highest/lowest datapoints. e Dot plots show Ki-67 staining of unstimulated PBMC from one representative patient. f, g Blood lymphocytes from patients were stimulated with TERT-derived peptides with or without blocking mAb against PD-L1, PD-1 and/or TIM-3. TERT-specific T cells were measured by ICS or ELISpot. f Histograms show IFN-γ spot-forming cells from three representative patients. g In left, representative dot plot of TNF-α and IFN-γ-producing CD4+T cells; In right, percentage of IFN-γ and TNF-α-secreting anti-TERT CD4 + T cells (n= 6). The data are representative of three independent experiments. *P < 0.05; **P < 0.01. ns not significant
mainly driven by the triad of cytokines, such as IFN-γ, TNF-α and
IL-2.5,6 Furthermore, a clinical benefit associated with
Th1-polarised signature in the TME has been reported in many human
cancers.13
Prognostic value associated with CD8+ TIL represents the
current dogma of adaptive immune signature against
cancers.13,14,37 Here, circulating CD8+ T-cell responses against
HLA-A*0201 and HLA-B7-restricted peptides from telomerase were detected in 13% (8/60) of patients using the ELISpot assay (not
shown). This low frequency, compared with telomerase-specific
CD4+Th1 response, could be related to the use of highly selected
and promiscuous HLA class II-binding peptides that cover more
than 85% of the population,22,24or to the preferential localisation
of these effector cells in the tumour. Since Th1-polarised CD4+
T cells reportedly control CD8+T cells migration in the TME,6,8it
could be expected that patients with potent circulating anti-TERT
Th1 response showed high CD8+TIL, but this hypothesis deserves
future investigations.
Targeting tumour-reactive CD4+ T cells in peripheral blood
raises questions regarding the choice of tumour-associated
antigens.20Telomerase activity maintains tumour cell immortality
by protecting cancer cells from telomere-dependent cell death, and telomerase overexpression is reported in the majority of
human cancers.38,39The critical activities of telomerase during the
oncogenesis process may also prevent immune escape via an
antigen-loss mechanism.1 Thus, the good prognostic value of a
CD4+T-cell response against telomerase highlights the critical
functions of this antigen.40
To search for factors influencing the presence of a TERT-reactive
CD4+ Th1 response in peripheral blood, we found an inverse
correlation between the presence of anti-TERT Th1 response and
the level of exhausted PD-1+/TIM-3+ T cells, particularly T cells
30 a c PD-1+ CD4+ TIM-3+ CD4+ PD-1+ TIM-3+ CD4+ TIM-3+ CD8+ PD-1+ TIM-3+ CD8+ PD-1+ CD8+ 20 % CD4 +PD-1 + T cells 10 0 100 Anti-TERT Th1
Anti-WT-1 Th1 Anti-NY-ESO-1 Th1 Anti-viral T cells
ns NEG POS NEG POS 80 60 % of patients 20 40 45% 24% 55% 30% 52% 27% 0 50 P = 0.09 40 30 IFN γ– spots anti-TER T/ CD4 + PD1 + r atio 10 20 0 100 80 60 20 40 0 100 80 60 82% 81% % of patients 20 40 0 100 80 60 20 40 0 60 40 IFN γ– spots anti-TER T/ CD4 + TIM3 + r atio 20 0 400 300 IFN γ– spots anti-TER T/ CD4 + PD1 +TIM3 + r atio 200 0 100 Localised (n = 77) Metastatic (n = 68) Localised n = 87 Metastaticn = 83
Localised n = 25 Metastaticn = 32 Localised n = 27 Metastaticn = 33 Localised N = 87 MetastaticN = 83
Localised (n = 77) Metastatic (n = 68) Localised (n = 77) Metastatic (n = 68) 50 ns ns ns 30 40 % CD8 +PD-1 + T cells 10 20 0 30 40 % CD8 + TIM-3 + T cells 10 20 0 20 15 10 % CD4 + TIM-3 + T cells % CD4 + PD-1 + TIM-3 + T cells 5 0 0 1 2 3 4 0 6 8 % CD8 +PD-1 +TIM-3 + T cells 0 4 2 6 8 10 10 15 20 25 d b e f
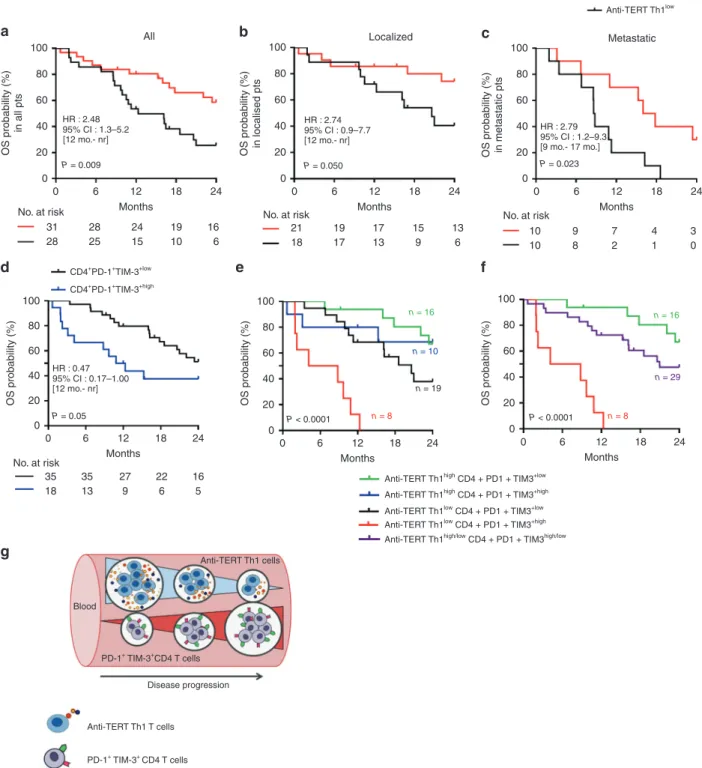
Fig. 4 Distribution of circulating exhausted PD-1+/TIM-3+T cells and anti-TERT Th1 response across NSCLC stages. a, b Levels of circulating
PD-1+and/or TIM-3+CD4+T cells (a) and CD8+T cells (b) in localised NSCLC (stages I–III, n = 77) and metastatic NSCLC (stage IV, n = 68) (Mann–Whitney test). Box span indicates 25th–75th percentiles. Whiskers indicate the highest and lowest datapoints. c Frequency of circulating anti-TERT Th1 response in localised versus metastatic NSCLC (χ2test). d Ratio of anti-TERT IFN-γ spots to exhausted PD-1+/TIM-3+
CD4+T cells in localised NSCLC (n= 77) and metastatic NSCLC (n = 68) (Mann–Whitney test). e Frequency of circulating IFN-γ antitumor Th1 response against WT-1, and NYESO-1, in localised versus metastatic NSCLC (χ2test). f Frequency of antiviral T-cell responses in localised NSCLC
(n= 87) versus metastatic NSCLC (n = 83) (χ2test). Histograms indicate mean ± SD. *P < 0.05; **P < 0.01. ns not significant
expressing TIM-3. The co-inhibitory receptors PD-1 and TIM-3 are well-known markers of T-cell exhaustion, which are expressed on
tumour antigen-experienced T cells.28,41 Previous reports in lung
cancer, showed co-expression of PD-1 and TIM-3 on TIL are
associated with poor prognosis.42,43 Similar observations are
reported in several other cancers, underlining the negative impact
of exhausted T cells in cancer immunosurveillance.44,45This state
of exhaustion is characterised by the loss of most T-cell functions, 100
a All b Localized c Metastatic
HR : 2.48 95% CI : 1.3–5.2 [12 mo.- nr] P = 0.009 HR : 0.47 CD4+PD-1+TIM-3+low CD4+PD-1+TIM-3+high 95% CI : 0.17–1.00 [12 mo.- nr] P = 0.05 P < 0.0001 n = 8 P < 0.0001 n = 8 n = 19 n = 29 n = 10 n = 16 n = 16 HR : 2.74 95% CI : 0.9–7.7 [12 mo.- nr] P = 0.050 HR : 2.79 95% CI : 1.2–9.3 [9 mo.- 17 mo.] P = 0.023 80 60 40 OS probability (%) in all pts 20 0 100 d g e f 80 60 40 OS probability (%) 20 0 100 80 60 40 OS probability (%) 20 0 100 80 60 40 OS probability (%) 20 0 100 80 60 40 OS probability (%) in localised pts 20 0 100 Anti-TERT Th1high Anti-TERT Th1low
Anti-TERT Th1high CD4 + PD1 + TIM3+low
Anti-TERT Th1high CD4 + PD1 + TIM3+high
Anti-TERT Th1low CD4 + PD1 + TIM3+low Anti-TERT Th1low CD4 + PD1 + TIM3+high
Anti-TERT Th1high/low CD4 + PD1 + TIM3high/low 80 60 40 OS probability (%) in metastatic pts 20 0 0 6 12 Months 31 28 28 25 24 15 19 10 16 6 21 18 19 17 17 13 15 9 13 6 10 10 9 8 7 2 4 1 3 0 No. at risk 35 18 Blood Anti-TERT Th1 cells Anti-TERT Th1 T cells PD-1+ TIM-3+CD4 T cells PD-1+ TIM-3+ CD4 T cells Disease progression 35 13 27 9 22 6 16 5 No. at risk
No. at risk No. at risk
18 24 0 6 12 Months 18 24 0 6 12 Months 18 24 0 6 12 Months 18 24 0 6 12 Months 18 24 0 6 12 Months 18 24
Fig. 5 Prognostic value of systemic anti-TERT Th1 response and exhausted PD-1+/TIM-3+CD4+T cells in NSCLC. a–c Association between the
level of circulating anti-TERT CD4 Th1 response and overall survival. A threshold (low < 3.7 < high) was defined based on the ratio of TERT-specific IFN-γ spots. Kaplan–Meier curves according to anti-TERT Th1 ratio: in all TERT responders (n = 59) (a), in localised stages (n = 39) (b) and in metastatic stages (n= 20) (c) (log-rank tests). d Association between the level of circulating PD-1+TIM-3+CD4+T-cell subsets and overall survival. Two groups were determined based on the median rate of exhausted PD-1+TIM-3+CD4+T-cell (0.9). Kaplan–Meier curves according to PD-1+TIM-3+T cell (log-rank tests). e, f Patients were classified into distinct groups based on the anti-TERT CD4 Th1 ratio and the median level of PD-1+TIM-3+CD4+T cells. e, f Kaplan–Meier curves for the following groups: anti-TERT Th1high/CD4+PD1+TIM3low(green), anti-TERT Th1high/CD4+PD1+TIM3high(blue), anti-TERT Th1low/CD4+PD1+TIM3low(black), anti-TERT Th1low/CD4+PD1+TIM3high(red) (log-rank test). Patients in the “blue” and “dark” groups are pooled in (f). g Schema of the relationship between anti-TERT Th1 immunity- exhausted PD-1+TIM-3+CD4+T cells and NSCLC progression
including effector cytokines production, proliferation and
cyto-toxicity28, and likely explains the poor prognosis associated with
exhausted T-cell accumulation. The apparent anti-exhaustion role
of the anti-TERT Th1 response is in agreement with findings in
mice, showing that CD4+helper T cells protect CD8+T cells from
exhaustion by downregulating expressions of the co-inhibitory
receptors PD-1, TIM-3 and Lag-3.8In a recent investigation using
deep single-cell RNA sequencing to analyse the T-cell landscape in lung adenocarcinoma, the authors found that a high ratio of
pre-exhausted to pre-exhausted PD-1+TIM-3+T cells was associated with
better prognosis. They also reported that the TILs from lung adenocarcinoma had a gene signature similar to that of blood T
lymphocytes.43 These observations, together with our findings,
indicate that circulating tumour-reactive T cells may reflect
occurrences in the tumour.30,34,46
Many reports emphasise the need for predictive biomarkers, in the hope of increasing responses to immune checkpoint
inhibitors.47,48 Current biomarkers are focused on PD-L1
expres-sion, CD8+ TILs and tumour mutational burden, however,
emerging blood-based biomarkers have attracted considerable
interest.49,50 Indeed, liquid biopsy offers numerous advantages,
including the potential for serial assessment and dynamic monitoring with minimal invasiveness. Accordingly, recent studies in NSCLC and melanoma reported pharmacodynamic changes of
circulating Ki-67+PD-1+CD8+ T cells following anti-PD-1
therapies.46,51,52 Another report also demonstrated that high
circulating central memory T cell to effector T-cell ratios were associated with better clinical outcome in NSCLC receiving
anti-PD-1 therapy.53Our previousfindings also support the critical role
of treatment induced anti-TERT CD4+Th1 immunity. For example,
reactivation of a systemic anti-TERT Th1 response after everolimus treatment improved patient survival in renal cell carcinoma by
counterbalancing immune-suppressive Tregs.25More recently, the
induction of anti-TERT Th1 response after immunogenic
poly-chemotherapy significantly increased progression-free survival in
patients with anal squamous cell carcinoma.26Thus, we strongly
believed that the presence of a functional anti-TERT CD4+ Th1
response may create a suitable inflamed environment for immune
checkpoint inhibitor actions, in turn, improving therapy efficacy.
The monitoring of anti-TERT Th1 response as potential biomarker for immunotherapy is currently evaluated in several cancers (NCT02840058).
In conclusion, our present study provides a new blood-based tool for NSCLC patients stratification. This approach could be rapidly deployed in routine clinical practice, and is likely also applicable to other cancers.
ACKNOWLEDGEMENTS
We thank all patients who contributed to this study. We thank all of the medical doctors, and nurses, from oncologic department of University Hospital of Besançon and European Georges Pompidou hospital in Paris, for their contributions. The authors also thank the Biomonitoring platform of CIC-1431 for their technical support.
AUTHOR CONTRIBUTIONS
O.A. conceived, designed and was the principal investigator of this study; O.A., V.W., G.E., P.J, E.F. and F.L.P.-B. implemented the cohorts. C.L., B.G., L.B., E.G. and M.D.C. performed immune assessment assays and immunomonitoring; M.J. V.K. and L.C. performed data management, C.L., M.D., D.V. and O.A. interpreted the data and performed computational, statistical and biostatistical analyses. M.D. performed heatmap analyses. D.V. performed PCA analyses. O.A., CL., M.D. and D.W wrote the original draft of the paper. E.T., D.V., V.W., C.L., M.D. and O.A. reviewed and/or edited the paper.
ADDITIONAL INFORMATION
Supplementary information is available for this paper athttps://doi.org/10.1038/ s41416-019-0531-5.
Competing interests: The authors declare no competing interests.
Ethics approval and consent to participate: All patients and healthy donors gave their signed informed consent, and the protocol was approved by local ethic committees and the French national drug agency (Comité de Protection des Personnes CPP Ile de France IV, 2009/17NICB, N°EUDRACT: 2009-A00642-55). The study was conducted in accordance with the Declaration of Helsinki.
Funding: This work was supported by grants from Assistance Publique Hopitaux de Paris, La Ligue Contre le Cancer, the Conseil Regional de Franche-Comte, Canceropole Grand Est.
Table 1. Cox proportional analysis for overall survival Cox regression analyses Univariate Multivariate n = 59 N HRa 95% Clb P-value HRa 95% Clb P-value Anti-TERT Th1 response Low (ratio < 3.7) 31 1 1 High (ratio > 3.7) 28 0.396 0.192– 0.817 0.0121 0.206 0.083– 0.511 0.0007 Stage Localised (I–III) 39 1 1 Metastatic (IV) 20 3.245 1.605– 6.558 0.0010 3.545 1.579– 7.960 0.0022 Histologic subtype Adenocarcinoma 30 1 Squamous cell carcinoma 12 0.902 0.396– 2.054 0.8056 PD-1+CD4 T cells Low 32 1 High 21 0.973 0.445– 2.128 0.9462 TIM-3+CD4 T cells Low 36 1 High 17 1.880 0.872– 4.057 0.1075 PD-1+/TIM-3+CD4 T cells Low 35 1 1 High 18 2.126 0.980– 4.609 0.0562 2.793 1.173– 6.649 0.0203 PD-1+CD8 T cells Low 28 1 High 25 0.977 0.457– 2.089 0.9523 TIM-3+CD8 T cells Low 33 1 High 20 0.660 0.288– 1.510 0.3253 PD-1+/TIM-3+CD8 T cells Low 31 1 High 22 1.457 0.681– 3.119 0.3323
Univariate and multivariate analysis for OS based on anti-TERT Th1 response, exhausted PD1+TIM-3+T cells and main clinical characteristics
a
Hazard ratio
bConfidence intervals
Consent to publish: All authors consent the material to publish.
Data availability: The data sets generated during and/or analysed during this study are available from the corresponding author on reasonable request.
Publisher’s note: Springer Nature remains neutral with regard to jurisdictional claims in published maps and institutional affiliations.
REFERENCES
1. Vesely, M. D., Kershaw, M. H., Schreiber, R. D. & Smyth, M. J. Natural innate and adaptive immunity to cancer. Annu. Rev. Immunol. 29, 71 (2011).
2. Kim, H.-J. & Cantor, H. CD4 T-cell subsets and tumor immunity: the helpful and the not-so-helpful. Cancer Immunol. Res. 2, 91–98 (2014).
3. Zanetti, M. Tapping CD4 T cells for cancer immunotherapy: the choice of per-sonalized genomics. J. Immunol. 194, 2049–2056 (2015).
4. Bevan, M. J. Helping the CD8(+) T-cell response. Nat. Rev. Immunol. 4, 595–602 (2004).
5. Kennedy, R. & Celis, E. Multiple roles for CD4+ T cells in anti-tumor immune responses. Immunol. Rev. r 222, 44 (2008).
6. Borst, J., Ahrends, T., Bąbała, N., Melief, C. J. M. & Kastenmüller, W. CD4+ T cell help in cancer immunology and immunotherapy. Nat. Rev. Immunol. 18, 635–647 (2018).
7. Bos, R. & Sherman, L. A. CD4+ T-cell help in the tumor milieu is required for recruitment and cytolytic function of CD8+ T lymphocytes. Cancer Res. 70, 8368–8377 (2010).
8. Ahrends, T., Spanjaard, A., Pilzecker, B., Bąbała, N., Bovens, A., Xiao, Y. et al. CD4+ T cell help confers a cytotoxic T cell effector program including coinhibitory receptor downregulation and increased tissue invasiveness. Immunity 47, 848–861 (2017). e5.
9. Kammertoens, T., Friese, C., Arina, A., Idel, C., Briesemeister, D., Rothe, M. et al. Tumour ischaemia by interferon-γ resembles physiological blood vessel regres-sion. Nature 545, 98–102 (2017).
10. Braumüller, H., Wieder, T., Brenner, E., Aßmann, S., Hahn, M., Alkhaled, M. et al. T-helper-1-cell cytokines drive cancer into senescence. Nature 494, 361–365 (2013). 11. Linnemann, C., van Buuren, M. M., Bies, L., Verdegaal, E. M. E., Schotte, R., Calis, J. J. A. et al. High-throughput epitope discovery reveals frequent recognition of neo-antigens by CD4+ T cells in human melanoma. Nat. Med. 21, 81–85 (2015). 12. Kreiter, S., Vormehr, M., van de Roemer, N., Diken, M., Löwer, M., Diekmann, J.
et al. Erratum: mutant MHC class II epitopes drive therapeutic immune responses to cancer. Nature 523, 370 (2015).
13. Fridman, W. H., Pagès, F., Sautès-Fridman, C. & Galon, J. The immune contexture in human tumours: impact on clinical outcome. Nat. Rev. Cancer 12, 298–306 (2012).
14. Fridman, W. H., Zitvogel, L., Sautès-Fridman, C. & Kroemer, G. The immune con-texture in cancer prognosis and treatment. Nat. Rev. Clin. Oncol. 14, 717–734 (2017).
15. Melssen, M. & Slingluff, C. L. Vaccines targeting helper T cells for cancer immu-notherapy. Curr. Opin. Immunol. 47, 85–92 (2017).
16. Spitzer, M. H., Carmi, Y., Reticker-Flynn, N. E., Kwek, S. S., Madhireddy, D., Martins, M. M. et al. Systemic immunity is required for effective cancer immunotherapy. Cell. 168, 487–502 (2017). e15.
17. DuPage, M. & Bluestone, J. A. Harnessing the plasticity of CD4(+) T cells to treat immune-mediated disease. Nat. Rev. Immunol. 16, 149–163 (2016).
18. Mandic, M., Castelli, F., Janjic, B., Almunia, C., Andrade, P., Gillet, D. et al. One NY-ESO-1-derived epitope that promiscuously binds to multiple DR and HLA-DP4 molecules and stimulates autologous CD4+ T cells from patients with NY-ESO-1-expressing melanoma. J. Immunol. 174, 1751–1759 (2005).
19. Kobayashi, H. & Celis, E. Peptide epitope identification for tumor-reactive CD4 T cells. Curr. Opin. Immunol. 20, 221–227 (2008).
20. Cheever, M. A., Allison, J. P., Ferris, A. S., Finn, O. J., Hastings, B. M., Hecht, T. T. et al. The prioritization of cancer antigens: a national cancer institute pilot project for the acceleration of translational research. Clin. Cancer Res. 15, 5323–5337 (2009). 21. Costa-Nunes, C., Cachot, A., Bobisse, S., Arnaud, M., Genolet, R., Baumgaertner, P. et al. High-throughput screening of human tumor-antigen specific CD4 T cells, including neo-antigen reactive T cells. Clin. Cancer Res. 25, 4320–4331 (2019). 22. Godet, Y., Fabre, E., Dosset, M., Lamuraglia, M., Levionnois, E., Ravel, P. et al.
Analysis of spontaneous tumor-specific CD4 T-cell immunity in lung cancer using promiscuous HLA-DR telomerase-derived epitopes: potential synergistic effect with chemotherapy response. Clin. Cancer Res. 18, 2943–2953 (2012). 23. Dosset, M., Godet, Y., Vauchy, C., Beziaud, L., Lone, Y. C., Sedlik, C. et al. Universal
cancer peptide-based therapeutic vaccine breaks tolerance against telomerase and eradicates established tumor. Clin. Cancer Res. 18, 6284–6295 (2012).
24. Laheurte, C., Galaine, J., Beziaud, L., Dosset, M., Kerzerho, J., Jacquemard, C. et al. Immunoprevalence and magnitude of HLA-DP4 versus HLA-DR-restricted spon-taneous CD4(+) Th1 responses against telomerase in cancer patients. Oncoim-munology 5, e1137416 (2016).
25. Beziaud, L., Mansi, L., Ravel, P., Marie-Joseph, E. L., Laheurte, C., Rangan, L. et al. Rapalogs efficacy relies on the modulation of antitumor T-cell immunity. Cancer Res. 76, 4100–4112 (2016).
26. Kim, S., François, E., André, T., Samalin, E., Jary, M., El Hajbi, F. et al. Docetaxel, cisplatin, andfluorouracil chemotherapy for metastatic or unresectable locally recurrent anal squamous cell carcinoma (Epitopes-HPV02): a multicentre, single-arm, phase 2 study. Lancet Oncol. 19, 1094–1106 (2018).
27. Moodie, Z., Price, L., Gouttefangeas, C., Mander, A., Janetzki, S., Löwer, M. et al. Response definition criteria for ELISPOT assays revisited. Cancer Immunol. Immunother CII. 59, 1489–1501 (2010).
28. Wherry, E. J. T cell exhaustion. Nat. Immunol. 12, 492–499 (2011).
29. Wherry, E. J. & Kurachi, M. Molecular and cellular insights into T cell exhaustion. Nat. Rev. Immunol. 15, 486–499 (2015).
30. Chen, D. S. & Mellman, I. Elements of cancer immunity and the cancer-immune set point. Nature 541, 321–330 (2017).
31. Molina, J. R., Yang, P., Cassivi, S. D., Schild, S. E. & Adjei, A. A. Non-small cell lung cancer: epidemiology, risk factors, treatment, and survivorship. Mayo Clin. Proc. 83, 584–594 (2008).
32. Nadler, E., Espirito, J. L., Pavilack, M., Boyd, M., Vergara-Silva, A. & Fernandes, A. Treatment patterns and clinical outcomes among metastatic non-small-cell lung cancer patients treated in the community practice setting. Clin. Lung Cancer 19, 360–370 (2018).
33. Weide, B., Zelba, H., Derhovanessian, E., Pflugfelder, A., Eigentler, T. K., Di Gia-como, A. M. et al. Functional T cells targeting NY-ESO-1 or Melan-A are predictive for survival of patients with distant melanoma metastasis. J. Clin. Oncol. 30, 1835–1841 (2012).
34. Spisek, R., Kukreja, A., Chen, L.-C., Matthews, P., Mazumder, A., Vesole, D. et al. Frequent and specific immunity to the embryonal stem cell-associated antigen SOX2 in patients with monoclonal gammopathy. J. Exp. Med. 204, 831–840 (2007).
35. Peng, D., Kryczek, I., Nagarsheth, N., Zhao, L., Wei, S., Wang, W. et al. Epigenetic silencing of TH1-type chemokines shapes tumour immunity and immunotherapy. Nature 527, 249–253 (2015).
36. Scurr, M. J., Brown, C. M., Costa Bento, D. F., Betts, G. J., Rees, B. I., Hills, R. K. et al. Assessing the prognostic value of preoperative carcinoembryonic antigen-specific T-cell responses in colorectal cancer. J. Natl Cancer Inst. 107, 1–4 (2015). 37. Donnem, T., Hald, S. M., Paulsen, E.-E., Richardsen, E., Al-Saad, S., Kilvaer, T. K. et al. Stromal CD8+ T-cell density—a promising supplement to TNM staging in non-small cell lung cancer. Clin. Cancer Res. 21, 2635–2643 (2015).
38. Hanahan, D. & Weinberg, R. A. Hallmarks of cancer: the next generation. Cell 144, 646–674 (2011).
39. Shay, J. W. Role of telomeres and telomerase in aging and cancer. Cancer Discov. 6, 584–593 (2016).
40. Zanetti, M. A second chance for telomerase reverse transcriptase in anticancer immunotherapy. Nat. Rev. Clin. Oncol. 14, 115–128 (2017).
41. Fourcade, J., Sun, Z., Benallaoua, M., Guillaume, P., Luescher, I. F., Sander, C. et al. Upregulation of Tim-3 and PD-1 expression is associated with tumor antigen-specific CD8+ T cell dysfunction in melanoma patients. J. Exp. Med. 207, 2175–2186 (2010).
42. Thommen, D. S., Schreiner, J., Müller, P., Herzig, P., Roller, A., Belousov, A. et al. Progression of lung cancer is associated with increased dysfunction of t cells defined by coexpression of multiple inhibitory receptors. Cancer Immunol. Res. 3, 1344–1355 (2015).
43. Guo, X., Zhang, Y., Zheng, L., Zheng, C., Song, J., Zhang, Q. et al. Global char-acterization of T cells in non-small-cell lung cancer by single-cell sequencing. Nat. Med. 24, 978–985 (2018).
44. Granier, C., Dariane, C., Combe, P., Verkarre, V., Urien, S., Badoual, C. et al. Tim-3 expression on tumor-infiltrating PD-1(+)CD8(+) T cells correlates with poor clinical outcome in renal cell carcinoma. Cancer Res. 77, 1075–1082 (2017). 45. Giraldo, N. A., Becht, E., Vano, Y., Petitprez, F., Lacroix, L., Validire, P. et al.
Tumor-infiltrating and peripheral blood T-cell immunophenotypes predict early relapse in localized clear cell renal cell carcinoma. Clin. Cancer Res. 23, 4416–4428 (2017). 46. Huang, A. C., Postow, M. A., Orlowski, R. J., Mick, R., Bengsch, B., Manne, S. et al. T-cell invigoration to tumour burden ratio associated with anti-PD-1 response. Nature 545, 60–65 (2017).
47. Topalian, S. L., Taube, J. M., Anders, R. A. & Pardoll, D. M. Mechanism-driven biomarkers to guide immune checkpoint blockade in cancer therapy. Nat. Rev. Cancer 16, 275–287 (2016).
48. Cogdill, A. P., Andrews, M. C. & Wargo, J. A. Hallmarks of response to immune checkpoint blockade. Br. J. Cancer. 117, 1–7 (2017).
49. Schumacher, T. N. & Scheper, W. A liquid biopsy for cancer immunotherapy. Nat. Med. 22, 340–341 (2016).
50. Gnjatic, S., Bronte, V., Brunet, L. R., Butler, M. O., Disis, M. L., Galon, J. et al. Identifying baseline immune-related biomarkers to predict clinical outcome of immunotherapy. J. Immunother Cancer 5, 44 (2017).
51. Kamphorst, A. O., Pillai, R. N., Yang, S., Nasti, T. H., Akondy, R. S., Wieland, A. et al. Proliferation of PD-1+ CD8 T cells in peripheral blood after PD-1-targeted therapy in lung cancer patients. Proc. Natl Acad. Sci. USA 114, 4993–4998 (2017). 52. Huang, A. C., Orlowski, R. J., Xu, X., Mick, R., George, S. M., Yan, P. K. et al. A single
dose of neoadjuvant PD-1 blockade predicts clinical outcomes in resectable melanoma. Nat. Med. 25, 454–461 (2019).
53. Manjarrez-Orduño, N., Menard, L. C., Kansal, S., Fischer, P., Kakrecha, B., Jiang, C. et al. Circulating T cell subpopulations correlate with immune responses at the tumor site and clinical response to PD1 inhibition in non-small cell lung cancer. Front. Immunol. 9, 1613 (2018).
Open Access This article is licensed under a Creative Commons Attribution 4.0 International License, which permits use, sharing, adaptation, distribution and reproduction in any medium or format, as long as you give appropriate credit to the original author(s) and the source, provide a link to the Creative Commons license, and indicate if changes were made. The images or other third party material in this article are included in the article’s Creative Commons license, unless indicated otherwise in a credit line to the material. If material is not included in the article’s Creative Commons license and your intended use is not permitted by statutory regulation or exceeds the permitted use, you will need to obtain permission directly from the copyright holder. To view a copy of this license, visithttp://creativecommons. org/licenses/by/4.0/.
© The Author(s) 2019