HAL Id: hal-02500995
https://hal.archives-ouvertes.fr/hal-02500995
Submitted on 30 Oct 2020
HAL is a multi-disciplinary open access
archive for the deposit and dissemination of
sci-entific research documents, whether they are
pub-lished or not. The documents may come from
teaching and research institutions in France or
abroad, or from public or private research centers.
L’archive ouverte pluridisciplinaire HAL, est
destinée au dépôt et à la diffusion de documents
scientifiques de niveau recherche, publiés ou non,
émanant des établissements d’enseignement et de
recherche français ou étrangers, des laboratoires
publics ou privés.
Africa Along Woce Section 16 at 30°E
Viviane Leboucher, James C. Orr, Philippe Jean-Baptiste, Maurice Arnold,
Patrick Monfray, Nadine Tisnérat-Laborde, Alain Poisson, Jean-Claude
Duplessy
To cite this version:
Viviane Leboucher, James C. Orr, Philippe Jean-Baptiste, Maurice Arnold, Patrick Monfray, et al..
Oceanic Radiocarbon Between Antarctica and South Africa Along Woce Section 16 at 30°E.
Radio-carbon, University of Arizona, 1999, 41 (1), pp.51-73. �10.1017/S0033822200019330�. �hal-02500995�
OCEANIC RADIOCARBON BETWEEN ANTARCTICA AND SOUTH AFRICA ALONG
WOCE SECTION 16 AT 30°E
Viviane Leboucherl James Orr2 Philippe Jean-Baptiste2 Maurice Arnold1 Patrick Monfrayl
Nadine Tisnerat-Labordel Alain Poisson3 Jean-Claude Duplessyt
ABSTRACT. Accelerator mass spectrometry (AMS) radiocarbon measurements were made on 120 samples collected
between Antarctica and South Africa along 30°E during the WOCE-France CIVA 1 campaign in February 1993. Our principal
objective was to complement the Southern Ocean's sparse existing data set in order to improve the 14C benchmark used for
validating ocean carbon-cycle models, which disagree considerably in this region. Measured 14C is consistent with the 0-S
characteristics of CIVA1. Antarctic Intermediate Water (AAIW) forming north of the Polar Front (PF) is rich in'4C, whereas surface waters south of the PF are depleted in 14C. A distinct old 14C signal was found for the contribution of the Pacific Deep
Water (PDW) to the return flow of Circumpolar Deep Waters (CDW). Comparison to previous measurements shows a 4C
decrease in surface waters, consistent with northward displacement of surface waters, replacement by old deep waters upwelled at the Antarctic Divergence, and atmospheric decline in 14C. Conversely, an increase was found in deeper layers, in
the AAIW. Large uncertainties, associated with previous methods for separating natural and bomb 14C when in the Southern
Ocean south of 45°S, motivated us to develop a new approach that relies on a simple mixing model and on chlorofluorocarbon (CFC) measurements also taken during CIVA1. This approach leads to inventories for CIVA1 that are equal to or higher than those calculated with previous methods. Differences between old and new methods are especially high south of approxi- mately 55°S, where bomb 14C inventories are relatively modest.
INTRODUCTION
The Southern Ocean extends south to Antarctica and north to the Subtropical Front (STF), which meanders between 40°S and 50°S. As such, the Southern Ocean covers about 21% of the world's
ocean surface. Within the Southern Ocean, large vertical exchanges take place between water
masses. Important processes include ventilation of deep waters at the Antarctic Divergence Zone (ADZ, ca. 65°S), production of ventilated bottom waters in the Weddell Sea and around the Antarc-
tic continental slope, and formation of Antarctic Intermediate Water (AAIW) within the Polar Fron-
tal Zone (PFZ) between the Polar Front (PF) and the Subantarctic Front (SAF).
The Southern Ocean is considered to be a major sink for anthropogenic CO2 (Sarmiento et a1.1992). However, for this region, there is substantial disagreement between carbon-cycle simulations from different ocean general circulation models (OGCMs), which offer the only means to estimate future oceanic CO2 uptake
(On
1996). Radiocarbon is routinely used to evaluate the performance of such models (Toggweiler et al. 1989a, 1989b; Maier-Reimer 1993; Taylor 1995; On' 1.996). However, few14C data are available in the remote Southern Ocean, where both the spatial and temporal changes in 14C are important. Here, we provide 14C data to complement the sparse established dataset. Previous 14C measurements include those from GEOSECS (Geochemical Ocean Sections Study) during
1973-1978 (Ostlund and Stuiver 1980; Stuiver and Ostlund 1980; Stuiver et al. 1981), from the Win- ter Weddell Sea Experiment (WWSP) in 1986 (Schlosser et al. 1994), and from INDIGO (Indian Gas Ocean project) in 1985-1987 (Ostlund and Grall 1988). The 14C data presented here were collected
during CIVA1(Circulation et Ventilation Bans l'Antarctique) of WOCE-France taken in February-
March 1993. Measurements of 14C were made by AMS in Gif-sur-Yvette, France.
t Laboratoire des Sciences du Climat et de 1'Environnement (LSCE), Avenue de la Terrasse, F-91198 Gif-sur-Yvette Cedex,
France
2Laboratoire des Sciences du Climat et de 1'Environnement (LSCE), DSMICEN SaclaylCEA, L'Orme, Bat. 709, F-91191 Gif-sur-Yvette Cedex, France
3Laboratoire de Physique et Chimie Marines (LPCM), Universite Pierre et Marie Curie, 4, place Jussieu, F-75252 Paris Cedex 05, France
Oceanic 14C must be separated into its natural and anthropogenic components if it is to be useful for model validation. Natural 14C is produced by cosmic radiation and can be considered at present to be in steady state with respect to the vertical turnover time of the ocean (ca. 1000 yr). Bomb 14C was injected in the atmosphere nearly exclusively by atmospheric thermonuclear weapons tests during
the 1950s and 1960s. At its peak in 1963, the nuclear contribution nearly doubled prenuclear atmo-
spheric levels of 14C. Since then, atmospheric 14C has decreased. At present, levels are roughly 10%
higher than in the prenuclear period. Both 14C components are transferred to the ocean by air-sea gas exchange as 14CO2. With its steady-state production and 5730 yr half-life, the natural component of 14C is useful for evaluating modeled deep-ocean circulation fields. Bomb 14C has had much less
time to invade the ocean. Because its boundary conditions have changed rapidly since the late
1950s, bomb 14C is useful for evaluating near-surface circulation fields predicted by ocean models.
To separate natural and bomb 14C, we first applied the method developed by Broecker et al. (1995),
which relies on the near linear correlation between natural A14C and dissolved silica throughout much of the ocean. However, for the stations situated south of 45°S (-90% of samples collected here), uncertainties associated with Broecker et al.'s method are large. Since the GEOSECS cam- paign in the 1970s, it has become less certain that deep waters remain uncontaminated with bomb
14C, as supposed by Broecker et al. (1995) for GEOSECS era samples. To take this possibility into
account, we modified the bomb versus natural separation methodology for our samples taken south
of 45°S. Our new method takes advantage of CFC-11 and CFC-12 measured during CIVAI and uses a simple ventilation model, similar to that used in previous tracer studies (Jenkins 1980; Andrie et
al. 1986; Haine 1996). METHODS
The 14C data (Table 1) were obtained following the procedure described by Bard et al. (1987) and
Arnold et al. (1987). Seawater was collected in 12-L Niskins. Once aboard ship, seawater was trans- ferred to 250 mL borosilicate bottles and poisoned with 1 mL of saturated HgCl2 solution. The boro-
silicate bottles were then sealed. Back in the laboratory, CO2 was extracted by adding 2 mL of 15N
H3P04 to a 100 mL seawater aliquot in a vacuum-tight system sparged by He gas (flow rate 80 mL
min
1). Extraction required 1 h. Water was removed by traps at -80°C; CO2 was trapped at -180°C.Subsequently, CO2 was reduced to graphite using hydrogen in the presence of iron powder (6-8 h).
The carbon-iron mixture was divided into 3 parts, then pressed into an aluminum target for accelera- tor mass spectrometry (AMS) analysis. Usually, 2 or 3 targets per sample were analyzed to obtain a
precision close to ±5%. The 3 isotopes, 12C,'3C and 14C, were measured directly in the AMS system to calculate A14C normalized to a b13C of
-25%.
The data are expressed as O14C in per mil (Stuiver and Polach 1977).RESULTS
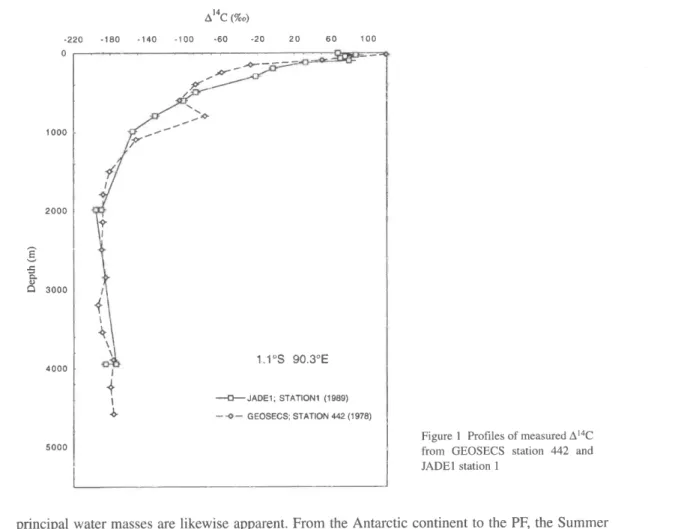
To establish the level of agreement of our 14C CIVA
1 measurements with previous data, Figure 1
provides 14C profiles from station 442 of GEOSECS (1978) and from station
1 of JADE1(Java Aus- tralia Dynamic Experiment 1989) cruise, both taken at the same location (1 °S, 91 °E) in the equato- rial Indian Ocean. The 14C measurements from JADEI were made in Gif-sur-Yvette by AMS just prior to those of CIVA 1. JADE 1 and CIVA 1 samples received identical processing. The deep por-
tions of GEOSECS and JADE1 profiles, where bomb 14C has not penetrated, agree to within the pre-
cision of the measurements. Therefore, our 14C measurements by AMS are consistent with those
from GEOSECS, determined by 13-counting. Furthermore, the methodology used at Gif-sur-Yvette has been previously checked by directly comparing 13-counting and AMS measurements performed
Table 1 Data for the stations occupied during the CIVA1 cruise
Potential Num. Nat.
Depth temp. Salinity Si02 SC02 CFC-11 CFC-12 of 0140 A'4C L\'4C (m) (°C) (S, psu) Sig 0 (pmol kg-') (mmol kg-') (pmol kg-') (pmol kg-') meas. (%o) (%) (%o)
Station 6 68°S, 30°E 10.2 0.2009 33.915 27.218 62.25 2149 6.76 2.92 2 -97 ± 4 -132 35 19.9 0.1145 33.919 27.225 62.25 2152 6.72 2.93 2 -97±4 -132 36 40 -0.1182 33.933 27.249 63.06 2160 6.7 2.86 2 -98 ± 4 -133 35 100.6 -1.7636 34.35 27.651 68.77 2217 5.68 2.47 2 -114 ± 4 -139 25 150.5 -1.6967 34.371 27.665 70 2210 5.59 2.45 2 -117 ± 4 -140 23 199.7 -0.5536 34.468 27.708 83.5 2240 3.59 1.52 2 -141 ± 4 -154 13 324.4 0.7518 34.642 27.773 99.93 2247 1.14 0.46 2 -165 ± 4 -176 11 698.8 0.7136 34.693 27.816 115.4 2254 0.58 0.23 2 -157 ± 4 -163 6 998.8 0.4484 34.687 27.829 124.7 2266 0.46 0.18 2 -157 ± 4 -162 5 1198.8 0.2899 34.683 27.833 130.9 2264 0.41 0.17 2 -164 ± 4 -168 4 2247.1 -0.2104 34.666 27.847 136.3 2260 0.56 0.21 2 -158 ± 4 4 153 -163 159 6 6 2497.6 -0.2729
-
27.848 135.6 2258 0.64 0.24 2 - ±-
2997.6 -0.378 34.665 27.851 136.3 2253 0.91 0.36 3 -145 ± 7 -153 9 3495.9 -0.4769 34.655 27.852 137.1 2254 1 0.41 2 -157 ± 4 -167 10 3681.3 -0.5667 34.655 27.855 137.1-
0.99 0.4 2 -162 ± 4 -171 10 Station 8 67°S, 30°E 10.6 0.646 33.866 27.155 60 2158 6.58 2.89 2 -97±4 -130 33 20.2 0.6406 33.869 27.155 60 2164 6.57 2.84 2 -97 ± 5 -130 33 40 -1.505 34.249 27.568 60.77 2197 5.7 2.46 2 -104±4 -131 27 80.8 -1.7041 34.356 27.653 65.5 2216 5.43 2.36 2 -103±4 -136 33 124.7 -1.142 34.412 27.682 71.02 2228 4.62 1.95 2 -111±4 -141 30 175.9 0.4412 34.564 27.729 86.01 2255 2 0.85 2 -130±5 -156 26 322.1 1.1479 34.679 27.778 92.69 2266 0.74 0.29 2 -155±5 -162 7 598.4 1.0146 34.708 27.812 102.5 2263 0.39 0.15 2 -148±4 -152 4 795 0.7838 34.704 27.823 110.1 2267 0.32 0.13 2 -179 ± 5 -182 4 997.1 0.5854 34.697 27.83 115.4 2250 0.27 0.09 2 -175 ±4 -175 0 1195.8 0.3901 34.687 27.834 118.4 2267 0.33 0.12 2 -154±4 -157 3 1795.5 0.0023 34.672 27.841 124.8 2270 0.53 0.12 2 -154±5 -159 4 2242.4 -0.1795 34.667 27.846 128.6 2263-
-
2 -154±4 -160 6 2740.9 -0.3279 34.663 27.85 127.8 2260 0.69 0.28 3 -166±8 -173 7 3193.9 -0.4247 34.659 27.851 126.3 2258 094 0.39 2 -160±4 -169 9 3697.2 -0.5206 34.656 27.853 127.1 2260 0.98 0.42 2 -167±4 -176 10 4065.7 -0.6255 34.652 27.855 129.3 2247 0.91 0.36 2 -150±4 -159 9 4065.9 -0.6265 34.653 27.856 130.9 2253 0.94 0.36 2 -154±4 -163 9 Station 12 65°S, 30°E 10.6 1.004 33.829 27.1 54.24 2164 6.45 2.79 2 -117 ± 5 -125 8 20.1 1.0006 33.829 27.1 53.44 2155 6.44 2.79 2 -97 ± 4 -123 26 39.4 0.6738 33.842 27.15 54,24 2168 6.46 2.81 2 -97 ± 5 -124 27 99.8 -0.9583 34.411 27.673 70.95 2225 4.37 1.87 2 -125±5 -141 16 149.7 0.6731 34.57 27.721 85.3 2259 1.84 0.75 2 -140±4 -155 16 200.1 0.9763 34.615 27.74 89.28 2261 1.29 0.49 2 -144±4 -159 15 324.5 1.2006 34.675 27.772 95.66 2255 0.72 0.26 2 -148±4 -155 7 499.8 1.2749 34.715 27.799 102 2264 0.3 0.07 2 -152±4 -152 0 698.9 1.0755 34.718 27.813-
2266 0.24 0.05 2 -158±4 -158 0 998 0.749 34.706 27.827 113.2 2257 0.2 0.04 2 -152±4 -152 0 1197.1 0.5752 34.699 27.831 116.4 2259 0.2 0.03 2 -161±4 -161 0 2000-
34.674-
-
2264 0.23 0.04 2 -164 ± 5 -164 0 3000-
34.663-
-
2261 0.4 0.11 2 -155±4 -158 4 4495.9 -0.6169 34.652 27.856 129.2 2253 0.63 0.22 2 -164±4 -170 6 Station 18 61 °S, 30°E 11.3 1.7759 33.686 26.938 44.3 2136 6.32 2.83 2 -74 ± 5 -114 40 20.9 1.6254 33.721 26.973 44.72 2140 6.33 2.85 2 -85±5 -114 30 40.7 -0.0172 33.891 27.211 45.56 2152 6.41 2.85 2 -80 ± 5 -116 36 80 -1.62 34.122 27.463 50.6 2176 6.11 2.74 2 -87±5 -121 34 126.5 -1.213 34.198 27.509 57.35 2196 5.56 2.44 2 -91 ± 5 -127 36 175.2 0.7429 34.482 27.646 82.22 2243-
-
2 -124 ± 5 -152 28 252.1 1.4748 34.635 27.72 90.64 2250 0.85 0.33 2 -146 ± 5 -155 8 599.1 1.2922 34.718 27.799 100.3-
0.36 0.15 2 -143 ± 6 -146 4 799.7 1.0488 34.714 27.812 107.1-
0.31 0.11 2 -166 ± 5 -169 3 998.9 0.8452 34.709 27.823 112.1 -- 0.24 0.1 2 -164 ± 5 -164 0 1197.6 0.6426 34.7 27.828 116.4-
0.21 0.09 2 -162±5 -162 0 2244.5 0.0032 34.673 27.843 127.3-
0.22 0.07 2 -156 ± 5 -156 0 2995.5 -0.2888 34.664 27.849 127.3-
0.24 0.1 2 -157 ± 5 -157 0 4495.7 -0.6071 34.655 27.857 129 2260 0.26 0.09 2 -154±5 -154 0 Station 24 57°S, 30°E 27 10.4 2.2178 33.626 26.853 40.6 2131 6.27 2.84 2 -83 ±5 -111 19.8 2.2133 33.625 26.853 40.6 2139 6.27 2.82 2 -77 ± 5 -111 33 40.7 2.2012 33.633 26.862 40.6 2140 6.26 2.84 2 -74 ± 5 -111 37 99 -0.7262 33.92 27.267 50.32-
6.91 3.06 2 -81 ± 5 -120 39 150.5 -1.6046 34.141 27.476 68.97 2202 6.62 2.91 2 -87 ± 5 -139 52 199.3 -1.4569 34.234 27.549 73.03 2209 6.08 2.68 2 -92 ± 5 -143 51 320.7 0.5166 34.596 27.751 99.78 2256 1.6 0.7 2 -141 ±5 -157 15Table 1 Data for the stations occupied during the CIVA 1 cruise (Continued)
Potential Num. Nat.
Depth temp. Salinity Si02
4C (m) (°C) (S, psu) Sig 0 kg-') kg-') kg-') kg-') 496.9 0.9574 34.695 27.803 2 5 696.1 0.7337 34.695 27.818 2 5 4 997.1 0.5577 34.695 27.829 2 ±5 3 1195.8 0.4318 34.69 27.833 2 ±5 3 1992.9 0.0367 34.675 27.842 2 5 0 2995.3 -0.3072 34.663 27.85 2 4 0 4495.2 -0.6165 34.654 27.856 2 4 0 5422.2 -0.7349 34.65 27.858 2 4 3 Station 28 54.3°S, 30°E 10.9 2.8814 33.876 26.998 2 6 19.9 2.8829 33.877 26.998 2 5 39.5 2.7778 33.952 27.066 2 5 101.2 0.0656 34.096 27.378 2 5 151.1 0.6092 34.294 27.456 2 5 197.2 1.3819 34.366 27.511 2 5 323.1 1.9407 34.572 27.632 2 5 7 496.7 1.8816 34.658 27.707 2 5 5 701.6 1.6213 34.689 27.752 2 5 5 995.2 1.5408 34.737 27.795 2 4 0 1399.7 1.0201
-
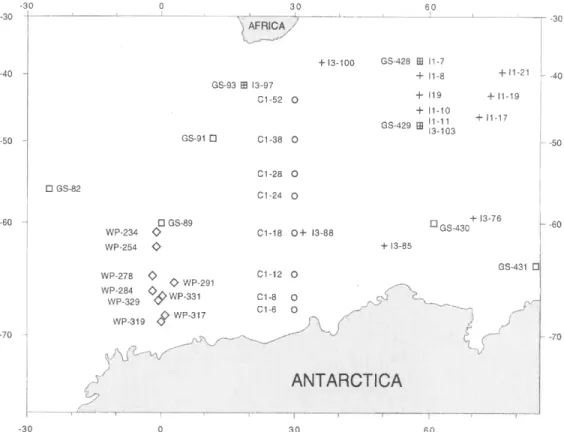
27.823 2 4 0 2494.4 0.1553 34.68 27.841 2 5 0 3993.7 -0.4818 34.658 27.853 2 4 0 4996.3 -0.621 34.657 27.858 2 4 0 5455.9 -0.6523 34.653 27.858 2 ±4 0 Station 38 49.7°S, 30°E 9.3 4.5363 33.874 26.835 2 5 18.8 4.5366 33.874 26.836 2 5 38.2 4.5302 33.876 26.836 2 5 79 3.139 33.982 27.061 2 5 125.9 2.6988 34.011 27.123 2 5 172.9 3.169 34.125 27.173 2 6 325.4 2.6227 34.199 27.28 2 ±6 576.9 2.3437 34.36 27.433 2 5 795.4 2.4431 34.525 27.556 2 5 998 2.3759 34.613 27.632 1 8 0 1198 2.3707 34.685 27.691 2 0 2498.4 1.1142 34.735 27.825 0 2 0 3994.5 -0.1069 34.672 27.848 2 5 0 5183.5 -0.4829 34.656 27.853 2 5 0 Station 52 44°S, 30°E 9.8 12.315 34.475 26.125 2 19.4 12.297 34.472 26.128 2 39.7 12.045 34.45 26.156 2 100.5 9.2985 34.596 26.756 2 142.6 8.7958 34.594 26.835 2 197.4 7.916 34.497 26.892 2 323.3 6.3703 34.341 26.983 2 499 5.1576 34.3 27.128 2 ±5 698.7 4.0819 34.329 27.244 2 5 1001.2 3.0136 34.421 27.423 2 ±5 0 1198.1 2.7672 34.53 27.532 2 4 0 2244.9 2.2081 34.793 27.789 2 0 3496.4 1.0783 34.753 27.841 0 2 0 4497.9 0.1862 34.69 27.846 2 ±4 0Figure 2 shows a map including the WOCE/CIVA1 transect between 68°S and 44°S along 30°E,
where 14C samples were collected. Also indicated are other stations
in the same area where 14C has
been measured on previous campaigns: GEOSECS, WWSP, and INDIGO.
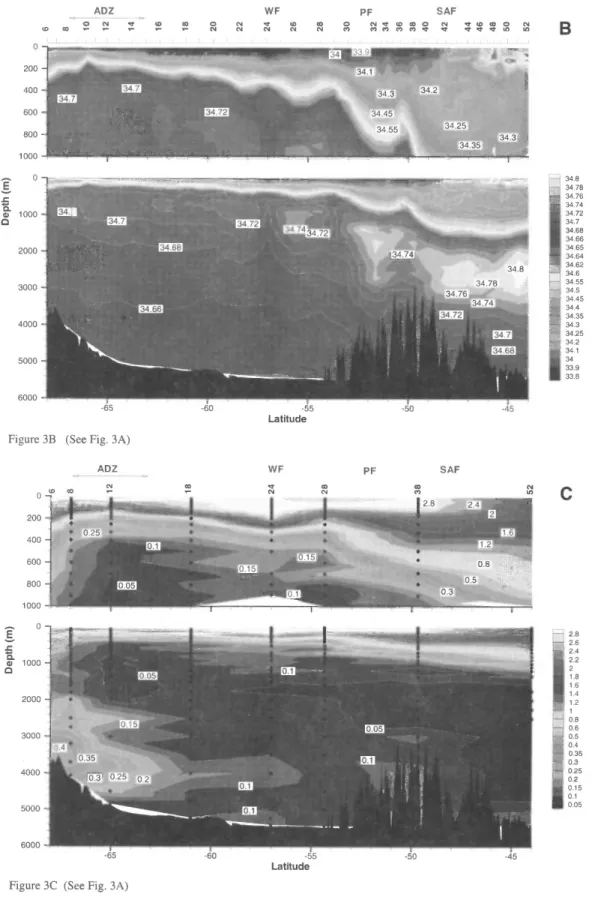
The 6 and S along the CIVA1 transect (Fig. 3A,B)4 exhibit signatures of the major fronts that charac- terize the Southern Ocean: the Antarctic Divergence Zone (ADZ) between 63°S and 67°S, the Wed-
dell Gyre Front (WF) at 57°S, the Polar Front (PF) at 52°S, and the Subantarctic Front (SAF) at 48°S
(Gordon 1971; Whitworth and Nowlin 1987; Orsi et al. 1993, 1995; Archambeau et al. 1998). The
A14C (%o) -220 -180 -140 -100 -60 -20 20 0 100 60 1000 2000 a) 3000 4000 5000
Figure 1 Profiles of measured A14C
from GEOSECS station 442 and JADE1 station I
principal water masses are likewise apparent. From the Antarctic continent to the PF, the Summer Surface Water (SSW) overlies the near freezing Winter Water (WW). Below the WW lies a massive amount of Circumpolar Deep Water (CDW), which is relatively warm (>0.1 °C) and old (with respect
to ventilation by contact with the surface). Beneath the CDW and along the bottom is found the Ant- arctic Bottom Water (AABW). In the AABW, one can trace the influence of the Weddell Sea Bottom Water (WSBW), which at its origin (the Weddell Sea) has a temperature <-0.7 °C. Another water mass, the Subantarctic Surface Water (SASW), lies between the PF and the SAF. The SASW has higher temperatures and salinities than the more southern surface waters and is remarkable for its
south-to-north downward tilt in 0 and S isolines, where AAIW is formed. In this northern part of the CIVAI section, intermediate level CDW bears a high salinity signature (maximum 34.8 psu) from its
contact with North Atlantic Deep Water (NADW). AABW north of the Atlantic-Indian ridge is
warmer and less dense than AABW to the south, which is closer to the source of the cold WSBW. Fur- ther description of CIVAI hydrography can be found in Archambeau et al. (1998).
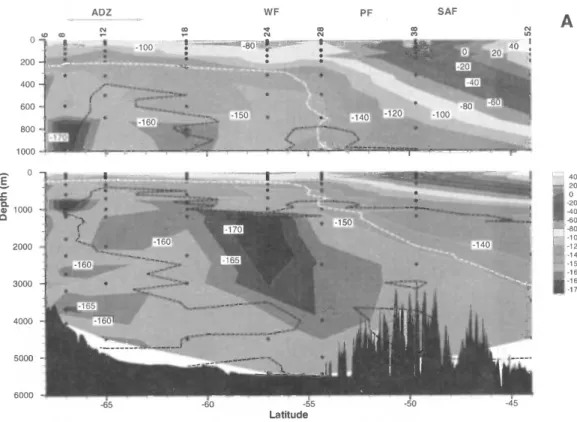
Table 1 provides the CIVAI 14C measurements. These data are presented as a composite latitude
versus depth section (Fig. 4A) as well as individual profiles (Fig. 5A,B). The former reveals that the distribution of the measured 14C roughly follows CIVAI hydrography. A striking contrast is found across the PF: north of the PF, surface waters are enriched in 14C (levels reach 55%0); south of the
PF, the upper 200 m are depleted in 14C (levels from -70%o to -140%o). The Southern depletion is
principally due to old CDW upwelling in the Antarctic Divergence Zone between 63°S and 67°S (Toggweiler and Wallace 1995). However, winter ice cover limits gas exchange and thus may play
-30 -30 0 30 AFRICAN +13-100 GS-91 CI-38 0 -40 { + 11-8 + 11-21 GS-93 ®13-97 C1-52 0 + 119 + 11-19 -50 -I -60 -1 -70 - GS-89 WP-234 WP-254
c
WP-331 C1-8 O C WP-3199
WP-317 WP-329 C1-28 0 C l-24 0 C1-18 0+ 13-88 60 GS-428 ®11-7 + 11-10 GS 429 ® I1-11 + 11-17 13-103 +13-85 GS 430 + 13-76 C1-12 0 WP-2780
WP 291 WP-284 O IANTARCTICA
-30 0 GS-431 -30 F- -40 - -50 F- -60 C1-6 0 30 60 -70Figure 2 Stations occupied to collect samples for 14C during CIVAI (Cl) as well as adjacent 14C stations from GEO-
SECS (GS), WWSP (WP), INDIGO (11 and 13)
some role (Weiss et al. 1979; Poisson and Chen 1987). North of the PF, 14C-enriched surface waters sink below warmer subantarctic water and move toward the north along downward sloping isopyc-
nal surfaces, where AAIW is formed.
A core of old water (014C less than -170%0) is located near 57°S between 1000 and 2000 in (station
24). This corresponds to the oldest CDW. A shallow extension of old CDW is found near 66°S (sta-
tion 8) with the oldest values (less than -175%c) between 800 in and 1000 m.
End members for and mixing between intermediate, deep, and bottom waters (c y() 27.7) are more easily seen on CIVA 1's 0-S diagram (Fig. 6A). The core of the CDW is identifiable by its salinity maximum induced by the contribution of NADW. Another influential water mass is the AABW, which forces most of the data points on the 0-S plot to lie on a straight line between the CDW and AABW end-member. The 14C data are helpful to pinpoint a third water mass component. Points
from stations 8 and 24 reveal that the most 14C-depleted waters have slightly different 0-S charac- teristics (Figs. 6B, 6C). These tendencies point to the older 14C-depleted Pacific Deep Water (PDW)
as an important contributor. The same trend was found from measurements of 3He in the Southern
Ocean (Jean-Baptiste et al. 1991). The contribution of PDW to the CDW is also consistent with the return Pacific flow scheme described by Toggweiler and Samuels (1993) based on Pacific-Antarctic
A14C difference, on the silica distribution in sediments of the Pacific sector of the Southern Ocean (Worthington 1977), and on previous inverse model results (Wunsch et al. 1983). The WOCE sec-
tion P6 along 32°S in the Pacific Ocean shows a substantially older 14C signal for this return flow
(Key et al. 1996).
Figure 4A further shows that AABW has higher levels of 14C (A14C
= -150%0 to -160%0) than does
CDW. The reason is that AABW originates principally in the Weddell Sea via mixing of newly
formed WSBW with intermediate depth waters (Foster and Carmack 1976; Carmack and Foster
1977; Weiss et al. 1979; Mensch et al. 1996). The recent ventilation of the WSBW is clearly indi-
cated by steady-state and transient tracer measurements (14C, 3H, CFC-11, CFC-12, 39Ar, 180 and helium isotopes) in the Weddell Sea (Bayer and Schlosser 1991; Schlosser et al. 1991; Mensch et al.
1996; Wepperning et al. 1996). GEOSECS 14C data provide further evidence of such formation and
indicate an eastward spreading of recently ventilated bottom waters (enriched in 14C) from the Wed- dell Sea (Fig. 7).
DISCUSSION
Observed Change in Oceanic 14C
Few previously collected 14C data are available for 14C in the same region (Fig. 2). Those that are
available include measurements from GEOSECS (1973-1978), ANTV in the Weddell Sea (1986) and INDIGO (1985-1987). Figure 8 provides details of the measured change of surface ocean 14C
with time. Unfortunately, south of 65°S as well as between 55°S and 50°S, no adjacent GEOSECS era data exist. Between about 65°S and 55°S, surface ocean 14C decreased progressively from 1973-
ADZ WF PF SAF CO a0 O N V (O 00 O N V lD 00 0 N V W CO O N
r r
N N N N N M C) C+) M M V V V V V u) toA
to CD o TFigure 3 (A) Potential temperature 8, (B) salinity S, and (C) CFC-12 concentrations along the CIVAI section. Also indicated
ADZ O N
C
ID fD cor r r
r
0 N N N WF et cD N N co N PF SAF O N a' to Co 0 N a w CD 0 N ch co ch cc c a a a a a 0 LO 34.8 1 34.78 34.76 34.74 0 2000 3000 4000 5000 6000 -65Figure 3B (See Fig. 3A)
ADZ 2000 3000 4000 5000 6000 -60 -55 Latitude -50 PF co m SAF -45 N N 34.72 34.7 34.68 34.66 34.65 34.64 34.62 34.6 34.55 34.5 34.45 34.4 34.35 34.3 34.25 34.2 34.1 34 33.9 33.8
C
2.8 2.6 2.4 2.2 2 1.8 1.6 1.4 1.2 1 0.8 0.6 0.5 0.4 0.35 0.3 0.25 0.2 0.15 0.1 0.051978 to 1993. This decreasing trend results from the decline in atmospheric 14C and the replacement of the surface waters south of the Polar Front with upwelled CDW, which remains largely uncon- taminated by bomb 14C (Toggweiler and Wallace 1995). From 50°S to 44°S, there also appears to be
a reduction with time, assuming a linear spatial trend between those 2 CIVA data points.
Figure 9 provides a more in-depth look at the CIVA1 minus GEOSECS temporal change. The GEO- SECS data in the Southern Ocean are sparse but were selected based on the proximity to the CIVA 1 section. However, many of the chosen GEOSECS stations are far from the CIVA1 section, leading to
substantial uncertainty about our calculated CIVA1-GEOSECS section. Nevertheless, natural vari- ability must be substantially smaller than the large temporal changes in near-surface 14C that have
occurred since GEOSECS. Within the upper 200 m, 14C has decreased substantially since GEO- SECS. Just below, 14C has increased. The increase extends deeper in the north than in the south. North of the CIVA 1 Polar Front, the large subsurface increase in 14C since GEOSECS (up to +80%0) tags the formation of AAIW. The CDW remains largely uncontaminated by bomb 14C, a result that is
consistent with the CIVA1 CFC data (Archambeau et al. 1998), which likewise reveal no significant recent contamination of the core of the CDW (Fig. 3C). Conversely, the AABW has been recently
ventilated according to both the CIVA1-GEOSECS 14C difference and the CIVA1 CFC data.
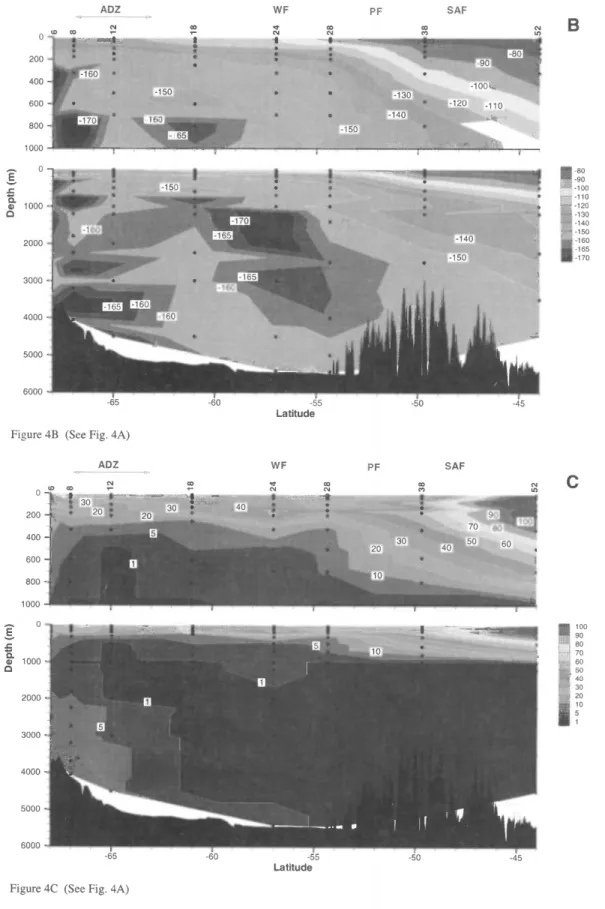
Figure 4 CIVA 1 sections for (A) measured 14C as well as (B) natural 14C and (C) bomb 14C components estimated by our new
CAS methodology; SAS was used for station 52 at 44°S. For SAS, the 90 µmol kg -I isoline for dissolved silica (thick dashed line) provides the limit for penetration of bomb 14C. For CAS, that limit is provided by the 0.1 pmol kg -I isoline for CFC-12
ADZ
E
-65
Figure 4B (See Fig. 4A)
ADZ WF WF -65 -60 -55 Latitude PF PF -50 SAF SAF -45
C
100 80 70 60 50 40 30 20 10 5200 180 120 80 40 0 40 80 0 1000 i 2000 i 4000 5000 WOCEJCIVAI Station 12 February 93 6s°S 3a°E n"C(%) 200 180 120 80 40 0 40 80 0 1000 2000 8 d 9000 4000 5000
Figure 5A Profiles of measured A14C for CIVA1 stations 6, 8, 12, and 18
WOCE/CIVA1
Station 18 February 93
61S 3O°E
Estimating Natural and Bomb 14C
Broecker et al. (1995) developed a general method to reconstruct the distribution of natural 14C in the
ocean. They applied their method to the GEOSECS (1972-1978), TTO (1980-1983) and SAVE (1987-1989) data to distinguish natural from bomb 14C. Besides surface prenuclear 14C data, Bro-
ecker et al. (1995) used bomb tritium to delimit the penetration depth of bomb 14C, and the relation-
ship between silica and natural 14C to determine the latter in the upper water column. For CIVA1, we
employ the same method for our one station that fell north of 45°S (station 52 at 44°S). South of 45°S, Broecker et al. (1995) rely purely on Si02. In deep waters (Si02 > 90 µmol
kg
1), Broecker et al.B d"C (%) 200 150 -120 80 -40 0 40 80 1000 2000 3000 4000 5000 i WOCEICIVAI Station 24 February 93 57°S 30°E 200 150 120 80 -40 0 40 80 0 1000 zaoo 4000 5000 4 WoCE!CiVA1 Station 38 March 93 49.7°S 3a°E e"C (%.) 200 180 120 -80 -40 0 40 80 0 1000 2000 4000 5000 { WOCEICIVAI Station 28 February 93 54.3°S 30°E QMC (96°) -200 150 120 80 40 0 40 80
Figure 5B Profiles of measured A14C for CIVAI stations 24, 28, 38 and 52
(1995) consider that 14C is entirely natural in origin (i.e., that deep waters were entirely free from
bomb 14C). Although this is a reasonable approximation for the time of GEOSECS, only about 10 yr
after the peak in atmospheric 14C, such appears not to be the case for CIVAI samples, collected about
20 yr later.
At the time of CIVAI, it is possible that bomb 14C had penetrated into deep waters of the Southern
Ocean, where vertical mixing and advection are particularly active. To properly address such a pos- sibility, we were forced to modify the method for the region south of 45°S. For this, we employ a sim- ple ventilation model (see Appendix) that relates deep water concentrations to historical surface val-
because such gases have no natural component. Hence, this approach is termed the CFC Analogue Strategy (CAS). Then, with a data-based reconstructed history of surface ocean 14C in the same
region, we computed the penetration of bomb 14C.
Silica Analogue Strategy and CFC Analogue Strategy
The Silica Analogue Strategy (SAS) from Broecker et al. (1995) improves on previous methodology (Broecker et al. 1985) to separate natural and bomb 14C in the ocean by exploiting the linear corre-
lation between natural 14C and dissolved silica found to exist in 3H-free waters throughout most of
the oceans:
A14C natural =
-70
-
Si02 (1)-100 Salinity 052 +38
28
X24 X18 A12 08 -6 -120 -1 0 1 2 3 -100 -120 -140 -160 -180 -200 052 +3828
X24 X18 A12 08 -6 C -220 ' 34.4 34.6 34.8 35 -140 -180 -200 -220 Potential Temperature (°C) 052 +3828
X24 X18 A12 08 -6 BFig. 6. (A) 0 vs. S, (B) A14C vs. S, and (C) Al 4C vs. 0 for CIVAI 14C samples where 6e > 27.7.
-145 -150 -155 -160 -165
Figure 7 Longitudinal section of measured 14C in the Antarctic Circumpolar Current (ACC) from GEOSECS (1972-
1978). Latitudes of stations vary between 52°S and 62°S.
where A14C is in %c and Si02 is in µmol
kg
1. Broecker et al. (1995) estimate the uncertainty of thenatural 14C thus calculated as ±10%0. Figure 10 is a plot of 14C versus silica for GEOSECS,
INDIGO3, and CIVA1 data from the Southern Ocean south of 50°S. Also given is the linear regres- sion from equation (1). For waters south of 45°S, Broecker et al. (1995) apply equation (1) when Si02 < 90 p.mol
kg
1. They assume that waters with Si02 > 90 µmol kg -1 are uncontaminated withbomb 14C. However, south of 45°S, contamination of deep waters by bomb 14C is much more likely
for CIVA 1-era samples. Figure 10 suggests that bomb 14C has invaded deep waters since GEO-
SECS: for waters with Si02 between 90 and 100 µmol kg-1, 14C is greater during CIVA1 than during
GEOSECS. Thus, for CIVAI, one cannot use the SAS method alone, which assumes that measured variability in deep water 14C is due to natural variation. Instead, south of 45°S, we modified the tech-
nique in defining 3 separate regions (Fig. 4A):
1. In the waters where Si02 <
90.tmol
kg
1, natural 14C is deduced from Broecker et al.'s (1995) SAS methodology.2. In the core of the CDW, where A14C values are the lowest and have not changed since the time
of GEOSECS, we consider the 14C to be entirely prenuclear in origin. Arbitrarily, we choose
the weak CFC- 12 concentrations of 0.1 pmol kg -1 as a limit to any anthropogenic contamina-
tion. We are unable to employ the CFC-11/CFC-12 dating method near the surface, nor in deep waters. Indeed, the ratio CFC-11 /CFC-12 is not usable to date young near-surface waters in
130 80 30 -20 -70 -70 -65 -60 -55 -50 -45 -40 -35 -30 -120 Latitude
Figure 8 Measured surface ocean 14C from GEOSECS, INDIGO and CIVAI as a function of lati-
tude for the region between 25°W to 85°E and 70°S to 30°S.
been the same. Furthermore, in CIVA's deep waters where the CFC concentrations are very low,
uncertainty in the CFC-11/CFC-12 ratio is too large to be of any use.
3. Elsewhere (i.e., mainly in the ventilated southernmost part of the section), our vertical mixing model and CFCs from CIVAI are used to calculate the annual ventilation rate of any water par- cel, and subsequently, the bomb 14C contribution based on a reconstructed history of surface bomb 14C. By dealing directly with surface ocean concentrations, we avoid problems due to the roughly 100-fold difference in the time required for 14C versus CFCs to equilibrate between the atmosphere and surface ocean (Broecker and Peng 1974).
Natural Versus Bomb 14C
Figure 4B shows the computed natural 14C. Surface values of natural 14C increase from south to
north from -132%o to -72%0. Our lowest surface values in the far south are consistent with the rare
existing data set (Broecker et al. 1985; Bard 1988; Toggweiler and Samuels 1993; Berkman and For-
man 1996), especially considering the uncertainties from analysis, the Suess effect (5%o to 12%c
[Berkman and Forman 1996]), the silica-natural 14C relationship (±10%c), and natural spatial vari- ability. Waters north of the PF, where AAIW forms, have higher natural 14C, largely because they rest longer at the surface and thus equilibrate more extensively with the atmosphere; also circulation patterns transport natural 14C to the north as described previously. South of the PF, a large portion of
the intermediate and deep waters have natural 14C values lower than -160%0, which is the average value of the waters of the Antarctic Circumpolar Current (Broecker et al. 1995).
The bomb 14C results (Fig. 4C) are consistent with the observed trends of the total A14C values:
M U) 0 CO 090, SOD T (1)0
000
00
-55 -50 -45Latitude
N 119 C) -40 25 0 25 -50 -75Figure 9 Section of the measured change in 14C between GEOSECS and CIVA1. GEOSECS stations are taken from longitudes between 25°W and 85°E. GEOSECS and CIVA] station data were triangulated then interpolated to the same
1-degree latitudinal grid before taking differences.
waters contain little if any bomb 14C. The only exception is where substantial bomb 14C is detected between 2000 and 5000 in in the far south along the continental slope. Deep and bottom waters in
the northern portion of the section contain insignificant levels.
Bomb 14C Inventories
Following Broecker et al. (1985), we calculated the vertical integral of bomb 14C (also known as the
inventory) as the area between bomb and natural 14C profiles (Table 2, Fig. 11). With our method,
inventories range from 1.7 to 10.9 x 10⁹ atoms cm-2. Inventories are larger north of the PF (stations
38 and 52) as well as in the far south, at stations 6 and 8. North of 45°S (station 52), the bomb 14C
inventory is highest (10.9 ± 1.6 x 10⁹ atoms
cm
2) and its uncertainty is lowest: both the SAS and CAS methods give the same inventory. We were able to properly apply the SAS method at station52, because our measured CIVA 1 3H (not shown) was well above background levels. Figure 11 com-
pares CIVA I bomb 14C inventories to those from GEOSECS and INDIGO. The temporal change is similar in structure to that seen for surface concentrations (Fig. 8). Around 60°S, the differences between inventories during CIVA1 (CAS) and GEOSECS (SAS) tend towards zero: the 14C loss
near the surface is compensated by buildup at depth (Fig. 4C). Around 60°S, when the SAS meth- odology is used, CIVAI inventories are only 20% to 50% of those determined using CAS. Further south, stations at 67°S and 68°S exhibit the largest differences between the SAS and CAS methods. Uncertainties concerning the Southern Ocean's bomb 14C inventories are large but their magnitude is relatively small compared to the inventories throughout most of the rest of the ocean (Broecker et
25 -25 -50 -75 U
a
-100 -125 -150 -175 -200 0SOUTHERN OCEAN
SOUTH
of
50°S
+
++ + GEOSECS ATLANTIC, INDIAN AND SAVE
[3l o INDIGO3
o CIVA1
20 40 60 80
Si02 (µmol
kg')
100 120 140
Figure 10 14C versus dissolved Si02 for stations taken south of 50°S from the GEOSECS, INDIGO3, and
CIVA 1 expeditions. Also provided is the linear correlation between the natural A14C and silica for tritium-free waters (Broecker et al. 1995).
al. 1995). Thus, uncertainties in this region do not substantially alter estimates of the global ocean
inventory of bomb 14C. Regional patterns of bomb 14C inventories are generally useful to help eval-
uate the behavior of OGCMs (Toggweiler et al. 1989b). However, they are less useful in the South- em Ocean, due to the large uncertainties there. On the other hand, levels of bomb 14C near the sur-
face in this same region have much smaller uncertainties than do corresponding horizontal and vertical gradients, and are thus more useful for model validation.
CONCLUSION
To complement the sparse 14C data set in the Southern Ocean, AMS 14C measurements were made on recently collected samples taken along the CIVA1 cruise track. The measured 14C distribution
reveals a dramatic contrast between samples taken south and north of the PF. Surface waters in the south are depleted due to upwelling of old CDW at the ADZ, which drives transport to the north; northern surface waters are rich in 14C due to transport from south to north and their more extensive equilibration with the atmospheric 14C. The oldest deep waters are found in the CDW
(<-170%)
r, N
Table 2 CIVAI bomb 14C inventories
Surface total Bomb 14C
Station '4C (%o) lnventorlesa atoms per cm2b
6 -97 1 8 -97 1.2 12 -117 0.8 18 -74 1.1 24 -83 1.8 28 -69 1.5 38 -52 4.7 52 43 10.9
-
aFollowing the Broecker et al. (1995) method bFollowing the chlorofluorocarbon analogue strategy
30 25
0
GEOSECS 1973o
GEOSECS 1978 + INDIGO11985 X INDIGO31987--n
-
CIVA1 CAS-
-o-
-CIVAI SAS x-70 -65 -60 -55 -50 -45 -40 -35 -30
Latitude
Figure 11 Bomb 14C inventory versus latitude for GEOSECS, INDIGO3 and CIVAI stations
within 25°W-85°E and 70°S-30°S.
Bomb 14C has contaminated deep waters in the far south based on differences in measured '4C
between CIVA 1 and GEOSECS and the CIVA 1 distribution of CFC-11 and CFC-12. Our new CAS
method relies on measured CFCs, a simple mixing model, and the established history of surface ocean 14C. A previously developed method, SAS from Broecker et al. (1995), relies on the assump-
tion that all deep waters of the Southern Ocean are free of bomb 14C. For CIVAI as well as other
WOCE-era samples, such an assumption is invalid. In terms of bomb 14C inventories, our new CAS
methodology yields estimates identical to the SAS method for stations north of the PF, but substan- tially greater than SAS results when south of the PF (up to 5 times more when south of the ADZ). Although CAS offers an improvement for determining inventories south of PF, uncertainties remain high and are not ideal for validating ocean carbon-cycle models. CAS estimates in deep waters south
of the PF, we recommend that ocean modelers not concern themselves with inventories but rather
with bomb and natural 14C distributions (Fig. 4B,C), weighing errors accordingly. For CIVA1 north of the PF, bomb 14C is found in surface and intermediate layers; in the far south, bomb 14C is found
throughout the water column. Since GEOSECS, 14C has decreased in surface waters (roughly the
upper 200 m) and has increased below, to as deep as 2000 m north of the PF.
The CIVAI section began near Antarctica and was aborted prematurely at 44°S due to an emergency medical evacuation. Fortunately, the repeat section CIVA2 (February-March 1996) will allow the northern gap (where 14C inventories should be greatest) to be filled in, once 14C measurements are
completed. The CIVA section along with other new WOCE 14C data will greatly improve coverage in the Southern Ocean, a key area for ocean CO2 uptake. However, care will have to be exercised when estimating natural and bomb 14C components so that ocean modelers will be able to take full
advantage of this unique data set. ACKNOWLEDGMENTS
For the variety of analyses required for this study, we thank E. Kaltnecker for help in measuring 14C, A. Dapoigny for help with 3H, D. Thouron at the Groupe de Recherche en Geodesie Spatiale (GRGS) for providing the CIVAI Si02 data, and J.-F. Tannau for help in building the degassing sys- tem. The CIVA1 cruise was supported by the Institut Francais pour la Recherche et la Technologie Polaire (IFRTP). AMS 14C measurements were supported by the CEA and CNRS. The contribution
of JCO was supported by the Environment and Climate Programme of the EC (Contract
ENV
CT95-0132). This is LSCE Contribution N° 110.
REFERENCES
Andrie C, Jean-Baptiste P, Merlivat L.1986. Tritium and Helium-3 in the northeastern Atlantic Ocean during the 1983 topogulf cruise. Journal of Geophysical Re- search 93:12511-24.
Archambeau A-S, Pierre C, Poisson A, Schauer B.1998.
Distributions of oxygen and carbon stable isotopes and CFC-12 in the water masses of the Southern Ocean at 30°E from South Africa to Antarctica: results of the CIVAI cruise. Journal of Marine Systems 17:25-38. Arnold M, Bard E, Maurice P, Duplessy J-C. 1987. 14C
dating with the Gif-Sur-Yvette Tandetron Accelerator: status report. Nuclear Instruments and Methods in Physics Research B29:120-3.
Bard E. 1988. Correction of AMS 14C ages measured in
planktonic foraminifera: paleoceanographic implica- tions. Paleoceanography 3:635-45.
Bard E, Arnold M, Maurice P, Duplessy J-C 1987 Mea- surements of bomb radiocarbon in the ocean by means of accelerator mass spectrometry: technical aspects.
Nuclear Instruments and Methods in Physics Re-
search B29:297-301.
Bard E, Arnold M, Ostlund HG, Maurice P, Monfray P,
Duplessy J-C.1988. Penetration of bomb radiocarbon in the tropical Indian Ocean measured by means of ac- celerator mass spectrometry. Earth and Planetary Sci- ence Letters 87:379-89.
Bayer R, Schlosser P. 1991. Tritium profiles in the Wed- dell Sea. Marine Chemistry 35:123-36.
Berkman PA, Forman SL. 1996. Pre-bomb radiocarbon and the reservoir correction for calcareous marine spe- cies in the Southern Ocean. Geophysical Research Letters 23:363-6.
Broecker WS, Peng TH. 1974. Gas exchange rates be- tween air and sea. Tellus 26:21-35.
Broecker WS, Peng T-H, Ostlund G, Stuiver M. 1985. The distribution of bomb radiocarbon in the ocean.
Journal o
f
Geophysical Research 90:6953-70. Broecker WS, Sutherland S, Smethie W, Peng TH,Ostlund G. 1995. Oceanic radiocarbon: separation of
the natural and bomb components. Global Bio- geoehemical Cycles 9:263-88.
Carmack EC, Foster TD. 1977. Water masses and circu- lation in the Weddell Sea. In: Dunbar MJ, editor. Polar
oceans. Calgary: Arctic Institute of North America. p 151-65.
Foster TD, Carmack EC. 1976. Frontal zone mixing and Antarctic bottom water formation in the southern Weddell Sea. Deep-Sea Research 23:301-17.
Gordon AL. 1971. Antarctic polar front zone. In: Reid IL, editor. Antarctic Oceanology 1, Antarctic research series. Washington: American Geophysical Union. p205-21.
Haine TWN. 1996. Combining passive tracer observa- tions with ocean circulation models. International
WOCE Newsletter 23:3-5.
3He and chlorofluorocarbons (CFC) in the Southern Ocean: tracers of water masses. Marine Chemistry
35:137-50.
Jenkins WJ. 1980. Tritium and 3He in the Sargasso Sea.
Journal of Marine Research 38: 533-69.
Key RM, Quay PD, Jones GA, McNichol AP, Von Reden KF, Schneider RJ.1996. WOCE AMS Radiocarbon I: Pacific Ocean results (P6, P16, P17). Radiocarbon 38(3):425-518.
Maier-Reimer E. 1993. Geochemical cycles in an ocean general circulation model preindustrial tracer distribu- tions. Global Biogeochemical Cycles 7:645-77.
Mensch M, Bayer R, Bullister JL, Schlosser P, Weiss RF. 1996. The distribution of tritium and CFCs in the Weddell Sea during the mid-1980s. Progress in
Oceanography 38:377-415.
On JC. 1996. The ocean carbon-cycle model intercom- parison project of IGBP/GRIM. In: Ormerod B, edi- tor. International Energy Agency, ocean storage of CO, workshop 3: international links and concerns (ISBN 1 89 83 73 04 3). Southampton, England. Orsi AH, Nowlin WD, Whitworth T III. 1993.On the cir-
culation and stratification on the Weddell Gyre. Deep- Sea Research 40:169-203.
Orsi AH, Whitworth T III, Nowlin WD. 1995. On the meridional extent and fronts of the Antarctic Circum- polar Current. Deep-Sea Research 42:641-73.
Ostlund HG, Grail C. 1988. INDIGO 1985-1 987 Indian Ocean radiocarbon: tritium laboratory data report.
University of Miami: Rosenstiel School of Marine and Atmospheric Science.
Ostlund HG, Stuiver M.1980. GEOSECS Pacific radio- carbon. Radiocarbon 22(1):25-53.
Poisson A, Chen C-TA. 1987. Why is there little anthro- pogenic CO2 in the Antarctic bottom water? Deep-Sea Research 34:1255-75.
Sarmiento JL, Orr JC, Siegenthaler U.1992. A perturba- tion simulation of CO2 uptake in an ocean general cir- culation model. Journal of Geophysical Research 97:
3621-45.
Schlosser P, Bullister JL, Bayer R.1991. Studies of deep water formation and circulation in the Weddell Sea us- ing natural and anthropogenic tracers. Marine Chem- istry 35:97-122.
Schlosser P, Kromer B, Weppernig R, Loosli HH, Bayer R, Bonani G, Suter M. 1994. The distribution of 14C
and 39Ar in the Weddell Sea. Journal of Geophysical Research 99:10275-87.
Stuiver M, Ostlund HG. 1980. GEOSECS Atlantic radio- carbon. Radiocarbon 22:1-24.
Stuiver M, Ostlund HG. 1983. GEOSECS Indian Ocean and Mediterranean radiocarbon. Radiocarbon 25(1): 1-29.
Stuiver M, Ostlund HG, McConnaughey TA. 1981. GE- OSECS Atlantic and Pacific '4C distribution. In: Bolin B, editor. Carbon cycle modeling. New York: John Wiley & Sons. p. 201-9.
Stuiver M, Polach HA. 1977. Reporting of '4C data. Ra- diocarbon 19(3):355-63.
Taylor NK.1995. Seasonal uptake of anthropogenic CO2 in a ocean general circulation model. Tellus 47B:145-
69.
Toggweiler JR, Dixon K, Bryan K. 1989a. Simulations of
radiocarbon in a coarse-resolution world ocean model.
1. Steady state prebomb distributions. Journal of Geo-
physical Research 94:8217-42.
Toggweiler JR, Dixon K, Bryan K. 1989b. Simulations of
radiocarbon in a coarse-resolution world ocean model. 2. Distributions of bomb-produced carbon 14. Journal of Geophysical Research 94:8243-64.
Toggweiler JR, Samuels B.1993. New radiocarbon con- straints on the upwelling of abyssal water to the
ocean's surface. In: Heimann, M, editor. The global carbon cycle. Berlin: NATO ASI Series. p 333-66. Toggweiler JR, Wallace D. 1995. Transport capacity for
passive tracers. US WOCE Report 1995. p 36-8. Warner MJ, Weiss RF.1985. Solubilities of chiorofluoro-
carbons 11 and 12 in water and seawater. Deep-Sea Research 32:1485-97.
Weiss RF, Ostlund HG, Craig H. 1979. Geochemical studies of the Weddell Sea. Deep-Sea Research 26A: 1093-120.
Weppernig R, Schlosser P, Khatiwala S, Fairbanks RG. 1996. Isotope data from Ice Station Weddell: implica- tions for deep water formation in the Weddell Sea.
Journal of Geophysical Research 101:25723-39. Whitworth T III, Nowlin WD. 1987. Water masses and
currents of the southern ocean at the Greenwich Merid- ian. Journal of Geophysical Research 92:6462-76. Worthington LV 1977. The case for near-zero production
of Antarctic bottom water. Geochemica Cosmochima Acta 41:1001-6.
Wunsch C, Hu DX, Grant B. 1983. Mass, heat, salt, and nutrients fluxes in the South Pacific Ocean. Journal of Physical Oceanography 13: 725-753.
APPENDIX: VENTILATION MODEL
Our ventilation model is inspired by Jenkins (1980) who used such a model to explain the penetra- tion of 3H in the North Atlantic and to study the 3H/3He relationship. At any time t, our model deter- mines the annual ventilation rate
r,
which is defined as the fraction of water at depth z replaced by water originating from the surface during the timestep At. A time-lag ti is defined to correspond to the travel time of a water parcel moving from the surface to depth z. Thus, at depth zCZ,t+1= CZ,t + 1 X [Co,(t-ti)
-
CZ,t](Al)
where Co,(t) is the surface concentration at time (t-t) and Cz,t, Cz,t+1 are the concentrations at depth
z in years t and t+1. 500 450 400 350 300
a
a
U
250 U 200 150 100 50 0SIS
AA-A-
CFC-11 1930 1940 1950 1960 1910 1980 1990 2000 YearFigure Al Partial pressure of atmospheric CFC-11 and CFC-12 in the Southern Hemi- sphere versus time (Walker, Salameh, and Weiss, personal communication 1995).
First, the annual ventilation rate and the transit time are adjusted using both CFC-11 and CFC-12 to
match the measured concentrations at the time of CIVA 1(1993). For our calculations, we used the time evolution of atmospheric CFC-11 and CFC-12 concentrations (Fig.
Al)
given by Walker, Salameh, and Weiss (personal communication 1995) as well as solubilities from Warner and Weiss (1985). This simple method gives the best result when a transit time ti of < 1 yr is chosen. Resultsare essentially identical whether using CFC-11 or CFC-12. With our method (At
=1
yr), this means that ti is set to zero.Second, we used the same model, now with the known 1 and ti from the CFC calibration, and a
reconstructed 14C input function shown in Figure A2, to determine the evolution of the total 14C
until the time of CIVA1(see an example of the method in Fig. A3). For this, we again used equation
(Al), where C is now 14C. The reconstructed '4C input function has large uncertainties due to the
scatter of available data (Fig. A3). We have arbitrarily drawn minimum and maximum curves. We
between the CAS and SAS methods; SAS is applied for waters where Si02 lies between 0 and 90 µmol kg-1. -30 0 -50 -70 -90 U
d
-110 -130 -150 -170`-
- ------
1950 1960 1970 1980 1990 2000 YearFigure A2 Time evolution of the surface ocean a14C compiled from the 14C
record from marine molluscs, brachiopods, echinoderms and foraminifera (Q) collected near the Antarctica (Berkman and Forman 1996), and 14C measurements
on surface samples from GEOSECS, INDIGOS and CIVA1 stations (Q) near Ant- arctica (Ostlund and Stuiver 1980; Stuiver and Ostlund 1980,1983; Stuiver et al. 1981; Schlosser et al. 1994; Ostlund and Grall 1988). Predicted prenuclear surface 414C is ca. -150% (Berkman and Forman 1996). Minima and maxima curves are drawn arbitrarily. We chose the lower curve for our CAS methodology because with it CAS and SAS methods agree for waters where Si02 <90.tmol kg-1.
1930 1940 1950 1960 1970 1980 1990 2000 Year -132 -134 -136 -138 0 -140 U a a -142 -144 -146 -148 -150 1930 1940 1950 1960 1970 1980 1990 2000 Year
Figure A3 Illustration of our use of the mixing model to determine the bomb 14C component for the sample at 4065 m from CIVAI station 8. With the known CFC-11
input function and a transit time set to zero, several dilution rates are shown for ventilation from the surface. For this sample, the dilution rate of 0.01 is appropriate since it produces the measured CIVAI CFC-11 concentration in 1993 0.91 mol k -1
. With that dilution rate, the surface ocean record of bomb 14C Fig. A2 and equation (Al), we calculate the corresponding contribution of bomb 14C (10%) 0
. The same operation repeated for the same sample with the CFC-12 gives consistent results. For our
final bomb 14C estimates we average results obtained when using CFC-11 and CFC-12.