HAL Id: hal-00811553
https://hal.archives-ouvertes.fr/hal-00811553
Submitted on 10 Apr 2013
HAL is a multi-disciplinary open access
archive for the deposit and dissemination of
sci-entific research documents, whether they are
pub-lished or not. The documents may come from
teaching and research institutions in France or
abroad, or from public or private research centers.
L’archive ouverte pluridisciplinaire HAL, est
destinée au dépôt et à la diffusion de documents
scientifiques de niveau recherche, publiés ou non,
émanant des établissements d’enseignement et de
recherche français ou étrangers, des laboratoires
publics ou privés.
Cloud thermodynamical phase classification from the
POLDER spaceborne instrument
Philippe Goloub, Maurice Herman, Hélène Chepfer, Jérôme Riédi, Gérard
Brogniez, Pierre Couvert, Geneviève Sèze
To cite this version:
Philippe Goloub, Maurice Herman, Hélène Chepfer, Jérôme Riédi, Gérard Brogniez, et al.. Cloud
ther-modynamical phase classification from the POLDER spaceborne instrument. Journal of Geophysical
Research, American Geophysical Union, 2000, 105 (D11), pp.14747-14759. �10.1029/1999JD901183�.
�hal-00811553�
JOURNAL OF GEOPHYSICAL RESEARCH, VOL. 105, NO. Dll, PAGES 14747,-14,759, JUNE 16, 2000
Cloud thermodynamical phase classification from the POLDER
spaceborne instrument
P. Goloub, • M. Herman, • H. Chepfer, 2 J. Riedi, • G. Brogniez,
•
P. Couvert, 3 and G. S•Sze 4
Abstract. Cloud phase recognition is important for cloud studies. Ice crystals correspond to physical process and properties that differ from those of liquid water drops. The
angular polarization signature is a good mean to discriminate between spherical and
nonspherical
particles (liquid and ice phase, respectively).
POLDER (Polarization and
Directionality of Earth Reflectances) has been launched on the Japanese ADEOS platform in August 1996. Because of its multidirectional, multispectral, and
multipolarization capabilities this new radiometer gives useful information on clouds and their influence on radiation in the shortwave range. The POLDER bidirectional
observation capability provides the polarization signatures within a large range of scattering angles in three spectral bands centered on 0.443, 0.670, and 0.865 tzm with a spatial resolution of 6.2 km x 6.2 km. These original features allow to obtain some
information both on cloud thermodynamic phase and on cloud microphysics (size/shape).
According to POLDER airborne observations, liquid cloud droplets exhibit very specific polarization features of a rainbow for scattering angles near 140 ø. Conversely, theoretical studies of scattering by various crystalline particles and also airborne measurements show that the rainbow characteristics disappear as soon as the particles depart from the
spherical shape. In the paper the POLDER algorithm for cloud phase classification is presented, as well as the physical principle of this algorithm. Results derived from the
POLDER spaceborne version are also presented and compared with lidar ground-based
observations and satellite cloud classification. This cloud phase classification method is shown to be reliable. The major limitation appears when thin cirrus clouds overlap the liquid cloud layer. In this case, if the cirrus optical thickness is smaller than 2, the liquid phase may be retrieved. Otherwise, the ice phase is correctly detected as long as cloud
detection works.
1. Introduction
Clouds are a strong modulator of the shortwave and long- wave component of the Earth's radiation budget [Ramanathan, 1987, 1989]. The importance of clouds and radiation in studies of the Earth's climate has been demonstrated from both ob- servations [Ramanathan, 1989] and modeling [Cess et al., 1989]. Knowledge of cloud properties (cloud cover, optical thickness, altitude, thermodynamical phase, water vapor, mi- crophysics properties) and their variations in space and time is crucial for studies of global climate change. Thus remote sens- ing of the optical, microphysical, and physical properties of clouds is important for improvement of the understanding of
the Earth's climate system.
POLDER IDeschamps et al., 1994] is a sensor that provides new information for improving our knowledge of clouds, radi-
1Laboratoire d'Optique Atmosph6rique, Universit6 des Sciences et Technologies de Lille, France.
2Laboratoire de M6t6orologie Dynamique, Ecole Polytechnique, Palaiseau, France.
•Laboratoire des Sciences du Climat et de l'Environnement, Gif sur
Yvette, France.
4Laboratoire de M6t6orologie Dynamique, CNRS, Universit6 P. et M. Curie, Paris.
Copyright 2000 by the American Geophysical Union. Paper number 1999JD901183.
0148-0227/00/1999JD901183509.00
ation, and climate interactions. In this paper we intend to
describe how cloud thermodynamic phase classification can be derived from POLDER. Cloud phase is an important property of clouds. Cirrus clouds have been recognized to have a great influence on weather and climate through their effect on the radiative energy budget in the atmosphere [Liou, 1986]. Cloud
cover estimate over both land and ocean needs improvements.
Even though cirrus clouds cover nearly 20-30% of the terres- trial surface [Warren et al., 1988], their influence on the radi- ation budget is still poorly known. Moreover, the estimate of the global coverage of cirrus cloud is still poorly known. It ranges between 20 and 60% of the globe, depending on the sensor used to detect ice clouds [Wylie et al., 1998].
Usual techniques for "thermodynamical phase retrieval" are
based on infrared measurements. Threshold on brightness
temperature or bispectral method is then used to select cold clouds that are assumed to be composed of ice particles [ttan et al., 1994; Nakajima and Nakajima, 1995]. A future sensor,
such as MODIS, will combine 1.37, 1.64 •m and thermal in-
frared channels [King et al., 1992]. The potential of polarization measurements of the upward radiation to derive cloud infor-
mation has been studied recently with the POLDER airborne
simulator during several airborne campaigns [Goloub et al., 1994; Brogniez et al., 1995; Chepfer et al., 1998; Br•on and Goloub, 1998]. Cloud polarimetric observations over a large range of scattering angles make possible the distinction be- tween spherical (liquid) and nonspherical particles (ice). The
14,748 GOLOUB ET AL.' CLOUD PHASE CLASSIFICATION satellite version of POLDER provided polarization measure-
ments at a global scale from October 1996 to June 1997. POLDER data are described in section 2. The third section is devoted to the presentation of cloud polarization features. Then, the algorithm used to retrieve the cloud phase is de- scribed, and comparisons with ground-based lidar measure- ments and cloud classifications are presented and discussed in section 5. Finally, examples of monthly ice and liquid occur- rence frequency maps are presented and discussed.
2. POLDER Data
ß
POLDER is an optical sensor launched on the ADEOS platform in August 1996. It provided continuous measure- ments of the Earth spectral, directional, and polarized signa- tures before the ADEOS platform unexpectedly failed at the end of June 1997. The same instrument will be launched on ADEOS-2 in 2002.
Thanks to its optical design (CCD bidimensional matrix and a wide field of view lens), the POLDER instrument acquires up to 14 successive measurements over a given target as the sat- ellite goes along its orbit. This allows an evaluation of the target directional signature. Another original feature of POLDER is its capability to measure the polarization state of the radiance field.
For cloud study, the main interests of the polarization mea- surement are in the remote sensing of thermodynamical phase and top pressure [Goloub et al., 1994; Buriez et al., 1997] and microphysics properties [Brdon and Goloub, 1998; Chepfer et al., 1998, 1999]. POLDER has eight spectral bands from 0.443
to 0.910 •m. Polarization measurements are performed in
three of these bands (0.443, 670, and 0.865 •m). These specific bands are equipped with three polarizers in order to determine completely the characteristics of the radiation field (radiance and linear polarization state) in term of the Stokes vector components I, Q, and U [Hagolle et al., 1999]. The normalized
total radiance L and polarized radiance Lp are defined as
follows:
• =•,
(•)
yr
•/Q2
+ W
2
,
(2)
where
I is the radiance,
¾/Q2 q_ U 2 is the polarized
radiance,
and E s is the solar irradiance.
Here we preferentially used the algebraic normalized polar-
ized
radiance
defined
by
Lp = L ñ - L//where
L ñ and
L//are
the normalized radiance components, respectively, perpendic- ular and parallel to the scattering plane. A positive polarized
radiance means electric vibration perpendicular to the scatter-
ing plane and negative means vibration parallel to the scatter- ing plane. Calculations and observations are presented in terms of algebraic polarized radiance.
The POLDER data full spatial resolution is 6.2 km x 6.2 km (Level 1 products). However, operational cloud products [Buriez et al., 1997; Parol et al., 1999] are averaged on a 60 km x 60 km spatial resolution (Level 2 products).
3. Cloud Polarization Features
When considering the solar radiation reflected by clouds observed from a satellite, the polarized component of the up-
ward radiance is mainly formed in the upper cloud layer. About 80% of the single-scattered radiation reflected from the cloud layer arise from the upper 100 m layer. Calculations
show that the polarized component Lp is saturated for cloud
optical thickness greater than 2 [Goloub et al., 1994]. By con- trast, the total normalized radiance L and the polarization
degree
[ratio
of Lp over
L) are more dependent
on r [Hansen,
1971].The interesting quantity is therefore the polarized radiance
Lp that is less sensitive than the polarization degree to multi-
ple-scattering effect, so the polarization features, correspond-
ing to single scattering, are preserved in Lp. According to the
single-scattering approximation the polarized radiance can be written as follows:
1 - exp [ - r(1/cos 0• + 1/cos 0v) ]
Lp:
4(cos
Os
+ cos
00
q(©). (3)
In the case of a large enough optical thickness (r > 2) the polarized radiance can be written as follows:
COS O s
Lp
= 4(cos
Os
+ cos
00 q(©)'
(4)
where q(©) is the polarized phase function that depends on cloud microphysics properties (shape/size) and refractive in- dex. The other quantities O s and 0v are, respectively, the Sun zenith angle and viewing angle, and © is the scattering angle that is referred to the incident solar direction. Looking at (4), we immediately note that the product of the polarized radianceLp by (cos
Os
+ cos 0,,)/cos
O
s will be mainly
governed
by the
scattering angle ©. Conservative scattering is assumed, and the effect of atmospheric gaseous is neglected.The cloud thermodynamical phase depends on the local thermodynamic conditions and presence of impurities within the atmosphere. Frequently, above 7 or 8 km, clouds are com- posed of ice crystals or of mixed liquid and ice particles. In particular, thermodynamical conditions, supercooled water droplets may be observed [Curran and Wu, 1982]. Ice particles are microphysically, and thus radiatively, quite different from water droplets. The intent of the following three subsections is to describe the main polarization features of water droplets (section 3.1), ice clouds (section 3.2), and multilayered clouds (section 3.3).
3.1. Water Droplet Clouds
According to in situ measurements the radius of liquid phase water droplets ranges from 0.5 to 50 •m [Hansen, 1971; Pal- tridge, 1974; Stephens et al., 1978]. This size range has been confirmed by lidar observations [Platt et al., 1987] and, more recently, by FSSP (forward scattering spectrometer probe) measurements [Pawlowska and Brenguier, 1996]. According to global climatology of cloud top droplet size, which is based on a 3.7 •m AVHRR channel, the effective radius ref f ranges from 5 to 25 •m [Nakajima et al., 1989, 1991; Han et al., 1994; Rossow et al., 1996]. Global mean value of the effective radius
is about 11 •m over the ocean and 8 •m over the continent.
Given the cloud size-distribution, the optical properties (for example, the polarized phase function q (©)) are derived from standard Mie theory. A convenient analytical size distribution, proportional to the droplet number concentration, is given by (5),
n (r) • r • exp (-/3- r) (5) with a = (1/reffO'eff) and/3 = (1 - 30'eff/O'eff) , where r ef f is the effective radius of the size distribution, and O-elf is the effective
GOLOUB ET AL.' CLOUD PHASE CLASSIFICATION 14,749
Oe
0.01
-O.Ol
-o.o2
..-' .' ,
60
80
• ...
----reft= 5 u m
- - - reff=10 um
- • -reff=,15u,m
_I
i 1, I . I I ! I . ! I ! I I !lOO
120
140
scatterin9 Angle (ø)
!. I .I ! I160
180
Plate 1. Simulated
normalized
polarized
radiance
for water
droplet
clouds
(liquid
phase)
for three size
distributions
(O-el
f = 0.1), reff = 5, 10, 15 /zm, 0s = 60 ø, z = l 0.
0.03-
I
0.02-
i
0.01
o-
-o.ol
-o. 1 ... 0.05 ... O.OlfL
•
...
!_
I •. . I , .t
60
80
100
120
140
160
180
Scattering Angle (ø)
Plate 2. Simulated
normalized
polarized
radiance
for water
droplet
clouds
(liquid
phase)
for three size
distributions
(r•ff = 10 tzm),
olff = 0.01,
0.05,
0.10,
for z = 10. This figure
shows
the effect
of the o-•ff
14,750 GOLOUB ET AL.: CLOUD PHASE CLASSIFICATION 0.035 o 0.030 :'8 0.025 "• 0.020 N 'r- • 0.015- o • 0.010- N :• o.oo5- o 0.000 z -0.005 8O 100 120 140 160 180 Scattering Angle (ø)
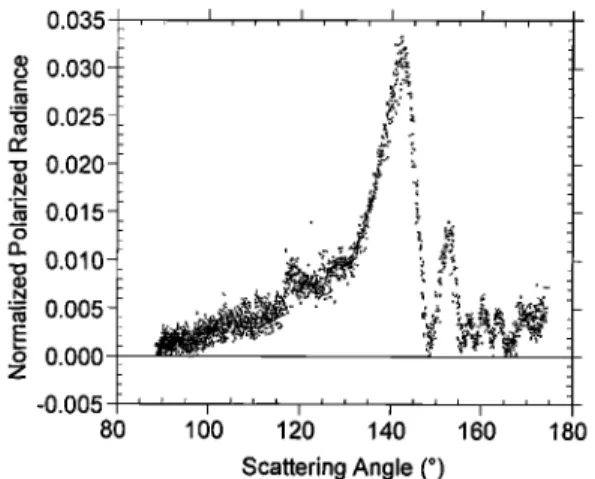
Figure 1. Normalized polarized radiance measured at 0.865 /•m over a stratocumulus cloud during POLDER airborne experiment (ASTEX '92). The altitude of the aircraft is 3.5 km.
variance distribution. Typical values of ref f range from 5 to 15 /•m, and rref f varies from 0.01 (narrow size distribution) to 0.1 (broad size distribution). The refractive index for water droplet is almost constant within the POLDER spectral range.
The radiative transfer calculations of solar radiation in plane-parallel water clouds may be performed by different techniques [Hansen, 1971], given the single-scattering phase matrix for the considered wavelength, corresponding to the assumed water droplet size distribution. Calculations have been performed with the radiative transfer code GHSPOL (general spherical harmonic with polarization [Garcia and Slewerr, 1986]. To study the sensitivity of the polarized radiance to cloud microphysical properties, for cloud optical thickness r = 10 and surface albedo equal to zero, calculations have been performed for several size distributions of the cloud droplets that correspond to three different values of the effective radius ref f for the same effective variance rref f (Plate 1) and for the same ref f to different several values of O'ef f (Plate 2).
The "polarization" of cloud water droplet exhibits a strong maximum at about 140 ø from the incoming incident direction. In the geometric optic approximation this is generated by the first internal reflection within the droplets. This maximum, the primary rainbow (PR), is highly polarized, which makes it easily detectable. The position of the PR depends slightly on the particle effective radius rcf f. The intensity of the PR peak increases with the radius. Another noticeable property is the zero of polarization, the neutral point (NP). Its angular posi- tion ranges from 75 ø to 130 ø, depending on ref f. Calculations have shown that the neutral point position is sensitive to the effective radius and increases when the radius decreases (Plate 1). For narrow size distributions, several bows (succession of secondary polarization peaks and neutral points) occur (super- numerary bows), beyond 150 ø, mainly depending on rrcff and ref f (Plate 2). On the contrary, if the size distribution is broad, no supernumerary exists. These properties can be used, in some cases, to retrieve water droplet size distribution [Brdon and Goloub, 1998].
These theoretical features have been confirmed by measure- ments obtained with the POLDER airborne simulator used during several field campaigns: Cleopatra '91 [Meischner, 1993], ASTEX '92 [Weill et al., 1995], and EUCREX '94 [Raschke et al.,
1996]. The ASTEX (Atlantic Stratocumulus Transition Experi- ment) campaign tooks place in a region of the Azores in June
1992. During ASTEX '92 a homogeneous stratocumulus cloud layer above the Atlantic Ocean was overflown at an altitude of 3.5 km. An example of the corresponding directional polarized radiance measured at 0.865/•m is shown in Figure 1. A second example, from the CLEOPATRA '91, is plotted on Figure 2. In that case, POLDER overflew an altostratus cloud layer over land at an altitude of about 10 km. The cloud top altitude was about 3.5 km. The typical spatial resolution was about 40 m.
Typical polarization patterns, such as pr{mary rainbow and
supernumerary bows indicating narrow droplet size distribu- tion, are clearly observed in these airborne data.
3.2. Ice Particles
Unlike water clouds, cirrus clouds are composed of ice crys- tals with extremely large variability in shape, size, and density depending on temperature and humidity in cloud. From a balloon experiment, Miloshevitch and HeymsfieM [1997] have shown ice crystal replicas that represent the qualitative micro- physical properties in a vertical profile through a cirrus cloud, which illustrates the diversity and complexity of ice crystals, with shape and size depending on temperature and humidity in cloud. More recent observations [HeymsfieM et al., 1998; Law- son et al., 1998], based on aircraft optical probes and replicator techniques for midlatitude, tropical, and contrail cirrus, reveal that these clouds are largely composed of bullet rosettes, solid and hollow columns, plates, aggregates, with sizes ranging from a few micrometers to 1000/•m. Some observations [Lawson et al., 1998] have shown that particles ranging from 50 to 200/•m are mostly columns or rosettes, while particles larger than 200 /•m are usually bullet rosettes. Heterogeneous nucleation via freezing of previously condensed supercooled water droplets could lead to spheroidal shapes. However, other observations providing high-resolution replicas suggest that particles smaller than 20 /•m are often plates and columns, combined with irregular and spheroidal shapes. More recently, a cloud particle imager [Lawson et al., 1998] has provided information of ice particles within Arctic cirrus. In this case, smaller parti- cles appear to have smooth edges but depart from exact spher- ical shape. According to the present knowledge on cloud ice microphysics, the assumption that ice clouds are composed of nonspherical particles is quite credible.
0 030-7
0 020
._• . .,,;.? .":• a-,:,
_)
e 0.010
: o ooo
N...:
....
o
-0.010.
80 100 120 140 160scattering angle (o)
Eigare 2. Normalized polarized radiance measured at 0.865 /•m over an altocumulus cloud during POLDER airborne ex- periment (CLEOPATRA, ]99]). The altitude of the aircraft is
GOLOUB ET AL.' CLOUD PHASE CLASSIFICATION 14,751 To study the sensitivity of the polarization signature to the
shape of ice cloud particles, different ice crystals have been used. Because in nature, ice crystals grow in hexagonal struc- ture, the hexagonal shape is commonly used to simulate ice crystal properties: hexagonal columnar or plated monocrystal- line particles [e.g., Brogniez, 1988; Takano and Liou, 1989], and polycrystalline particles [Macke et al., 1996], both randomly oriented in space. For such particles, computations of optical properties are based on a ray-tracing method supplemented by calculations of the Fraunhofer diffraction. These hexagonal crystals are described by their aspect ratio Q - L/D, where L and D are the length and the diameter of the crystal, respec-
tively, and by Req , the radius of an equivalent spherical particle
with the same volume. These calculations are valid only in the
geometrical optic approximation, i.e., radius R eq greater than
15/zm for visible wavelengths. In the present study we consider three types of hexagonal monocrystals: plate (Q = 0.05), compact (Q = 1), and columnar (Q - 2.50). Polycrystalline particles [Macke et al., 1996] have also been considered. For all
these
crystals
presented
above,
the radius
Req
is equal
to 20/zm.
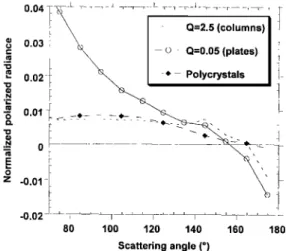
In the case of randomly oriented particles the radiative transfer code used to compute polarized radiance is an adding- doubling code [De Haan et al., 1986], taking into account mo- lecular and aerosol scattering and the Earth's surface albedo. The optical properties of the ideal cirrus ice crystals are intro- duced in this code, and Stokes vectors of the upwelling radi- ance in the viewing direction relatively to the incident one are then computed (Figure 3). The radiative transfer computations show that the main features, within the range of a scattering angle that can be observed by the radiometer POLDER, are (1) positive polarization, (2) general decrease of the polariza- tion for increasing scattering angle, (3) neutral point for scat- tering angle about 160 ø, which may shift slightly depending on the cloud microphysics [Masuda and Takashirna, 1992].
According to airborne observations acquired during EUCREX (European Cloud and Radiation Experiment) in April 1994, polarized measurements allow the characterization of cirrus clouds. A homogeneous cirrus cloud layer above the Atlantic Ocean was overflown at an altitude of 11 km. An example of directional polarized radiance measured at 0.865 /•m is plotted in Figure 4. As for water droplet clouds, the observations agree well with radiative transfer simulations and
! •
0=2.5
(columns)
0•03
' \•
--<•' Q=0.05 (plates)i
* Polycrystals
0.02
•
0.01
! _._ __
_._ -_
-0.01 - 80 100 120 140 160 180Scattering angle (o)
Figure 3. Simulated normalized polarized radiance for cloud composed of crystals (ice phase) for three size particle shapes. Sun zenith angle 0, is 55 ø, •- = 2 at 0.865 /zm.
0.020 'o 0.015- - N • 0.010- - o
• 0.005- '" "
o z 0.000 ' ' • ' ' , ' ' ' , ' ' ' • ' ' ' 80 100 120 140 160 180Scattering angle (o)
Figure 4. Normalized polarized radiance measured at 0.865 /zm over a cirrus cloud during POLDER airborne experiment
EUCREX '94.
clearly demonstrate the difference between directional polar- ization features associated to liquid (Plates 1 and 2 and Figures 1 and 2) and ice phase (Figures 3 and 4).
3.3. Multilayered Cloud
Ice clouds are often located above thick water clouds. In this case, the polarized radiance will mainly depend on the upper cirrus optical thickness. To study the sensitivity of the polarized
signal to the ice cloud optical thickness, we have simulated an
atmosphere composed of two layers: (1) the lower layer cor- responds to a water cloud (spherical particles) with an optical thickness of 15 and (2) the upper layer is composed of ice hexagonal particles randomly oriented in space with an optical thickness ranging from 0.25 to 4.
Plate 3 shows the resulting bidirectional polarized radiance as it could be measured with POLDER. This figure clearly shows that the intensity of the primary rainbow peak (© - 140 ø ) decreases when the cirrus cloud optical thickness in- creases. Moreover, the positive slope corresponding to liquid cloud for • < 110 ø disappears only when the ice cloud optical thickness is larger than 2.
On the basis of these simulations a clear discrimination between ice and liquid cloud derived from polarized observa- tions needs a cirrus optical thickness higher than 2, in the case of multilayered clouds. Otherwise, ice phase should be cor- rectly identified. The principle of cloud phase retrieval is pre- sented in section 4.
4. Principle of Cloud Phase Classification
Algorithm
In the POLDER cloud analysis the cloud detection and the derivation of its properties (cloud optical thickness and albedo, cloud top pressures, cloud phase) are separated. Cloud detec- tion is based on visible and near-infrared measurements. Se- quential tests are applied to each individual pixel as described by Buriez [1997]. The first one is based on the apparent pres- sure, which is related to oxygen transmission derived from the
ratio between radiances measured in the 0.763 and 0.765
channels [Fischer and Grassl, 1991; Parol et al., 1994]. The second test is based on the comparison of the measured re- flectance with clear-sky reference. The third test is a polariza- tion test performed in the 0.443/zm band where the polarized
14,752 GOLOUB ET AL.: CLOUD PHASE CLASSIFICATION o
0.04
,
0.03
I I I I I I 1 I ! I-0.01 -
-0.02
..,
60
I ---o--- 0.25 - -[•--0.5 -0-2 - -X- -4 III II0.02- 0-55
..
s
x-..
//,
:-.
./,
,
0.01
.:_7.
0
.%
',
1, , I I I I I I ! I I I I I ,I ... I I I I I I I i80
100
120
t40
160
180
Scattering
Angle
Plate 3. Bidirectional polarized radiance simulated for a two cloud layer system. The lower layer is a liquid cloud (spherical particles. and r - 15). The upper layer is composed of hexagonal particles with various optical
thicknesses (r = 0.25-4).
radiance is proportional to the cloud top pressure. The last test makes use of polarization information in the 0.865/.cm channel
where the water droplet primary rainbow can be detected. A combination of the four previous tests defines the cloud flag. If the pixel is flagged as "cloudy," then the cloud phase detection is applied.
According to the previous considerations on cloud polariza- tion characteristics (section 3), confirmed by airborne data, the polarized component of the light reflected by cloud exhibits quite different features for ice and liquid phases. This is illus- trated in Plate 4, where both total and polarized radiance images are presented. Plate 4 is a three color composite (blue, 0.443 /xm; green, 0.670 /xm; red, 0.865 /xm) of the radiance
measured by POLDER over a 1600 x 2200 km 2 area located
across the Atlantic Ocean. The black/white lines overlaid on
the images indicate the scattering angle in 10 ø increments as
well as the solar principal plane. The top figure shows the total radiance and is similar to what would be observed with an instrument without polarization capabilities. The bottom figure displays for the same area, the polarized component of the total radiance. The white band along the 140 ø scattering-angle line, corresponds to a maximum in the polarized radiance, which is characteristic of water droplets with a radius larger than the wavelength. This feature is an unambiguous indica- tion of liquid water droplets. For the same scattering angle, a dark/brown zone (low polarization), when associated to cloudy pixels, indicates the presence of ice particles alone in the at-
mosphere or overlapping low-level clouds, as can be seen hcrc
in Plate 4b near the Sun principal plane.
The algorithm consists of three tests on the polarized radi- ance at 865 nm, using three specific angular ranges. As molec-
ular contribution is rather weak at this wavelength, it is ne-
glected. For scattering angle (9 within 60ø-140 ø the angular slope is positive for water droplet and negative for ice particles (Plate 5). For scattering angle © within 140ø-180 ø the angular slope is negative both for water droplet and ice particles, but the standard deviation cr of the least squares fit is typically 10 times larger for liquid than for ice. Thus the slope a and the standard deviation cr (equation (6)) of the least squares fit are used to make discrimination between "ice" and "liquid" phase.
•/•-•d
1ir
Ndir
O'
=
E (Lpn•
as- aø © -- b) 2,
(6)
1
where Ndi r is the number of available direction in the corre-
sponding angle range. On the typical signatures presented in Plate 5 the slopes are also different within the 140ø-180 ø range; however, the standard deviation appears to be a better param- eter. Finally, if the particular 135ø-145 ø range is completely observable, the presence or lack of the primary rainbow can be
detected using a simple threshold on Lp.
Thresholds on "slope" a and "standard deviation" cr have been checked by comparing to the Meteosat cloud classification de- rived from the "dynamic clustering method," [Sbze and Desbois,
GOLOUB lET AL.' CLOUD PHASE CLASSIFICATION 14,753
a
140 ø
b
140 ø
Plate 4. Illustration of the cloud thermodynamical phase recognition. These images are a three color composite (blue, 0.443 •m; green, 0.670 •m; red, 0.865 •m) of the radiance measured by the instrument CCD
detector over a 1600 x 2200 km 2 area located over the Atlantic Ocean. The black/white lines overlaid in the
figure indicate the scattering angle in a 10 ø increment as well as the principal plane. The top image (a) shows the total radiance and is similar to what would be observed with an instrument without polarization capabil- ities. The bottom image (b) corresponds to the exact same area but displays the perpendicular component of the polarized radiance. For each spectral band, the scale varies from 0 to 0.80 in radiance and from 0 to 0.08 in polarized radiance.
1987]. Cloud classifications have been applied to Meteosat data acquired in coincidence with POLDER. We have selected a "high-thick and homogeneous" cloud in the Meteosat data for the ice test and "low-middle-level" clouds for the liquid test. For these
two classes we have plotted in Plates 6 and 7 the histograms for a
slope in the 60ø-140 ø range and for standard deviation in the 140ø-180 ø range. We clearly observe that the two thermody- namical phases are well separated and that ice is well defined.
More than 80% of high-thick-homogeneous cloud cases have a
negative slope and 95% of low/middle level have a positive slope. We also observe that 80% of high-thick-homogeneous
clouds have a standard deviation smaller than 10 -s and more
than 90% of low-middle-level clouds have a standard deviation
greater than 10-5. A combination of the slope and standard
deviation tests with the result of the test on the primary rain- bow gives the cloud thermodynamical phase index.
14,754 GOLOUB ET AL.: CLOUD PHASE CLASSIFICATION
0.030.,
0.025-
0.020-
0.015-
0.010--
0.005-
0.000.
-0.005
60
Ice phaseI ' I [ [ I i II
• I i 1
Liquid phase'.\9
¸ i I .[1 I l : : I I ,:l, : • I l80
loo
12o
I i i i I I ! ' I i ....180
I140
160
Scattering Angle (o)
Plate 5. Examples of directional polarization samples at 0.865/•m measured by POLDER over Lille (north of France) for cirrus cloud and liquid cloud. Solid lines correspond to linear fit of measurements for the two
scattering-angle ranges 60ø-140 ø and 140ø-180 ø .
35 3O 25 10 I I ! -- ß I I ß I ß I ß ß ß I I11 ß ß 1 ß ß • ß 1 ß ß ß : ß ß lm • mm ß -0.002 -0.001 0.000 I I I I
...
Liquid
Ice ß • ll •_.•
i ß ß
I - l• • ••ll
i 1
i ll l ... ;; ;;;i •;; .oo2Slope
GOLOUB ET AL.' CLOUD PHASE CLASSIFICATION 14 755
60
50
'--.."40
20
10
,.,,..=ram m m
m dmmm ß •,,==m ...=m .ql.,•l.. m m 0.00000 0.00005 0.00010 0.00015 0.00020 0.00025 0.00030 0.00035 0.00040Standard Deviation
Plate 7. Standard deviation histogram for the 140ø-180 ø scattering-angle range (orbit 3108, November 10,
1996).
Note that the POLDER angular coverage, in terms of avail- able scattering angles, depends on the latitude and the season. The most complete POLDER angular sampling can give access to a large range of scattering angles. In some cases, only one or two of the three angular ranges are available.
5. Accuracy of Thermodynamical Phase
RetrievalThe quality of the POLDER thermodynamical phase re- trieval is difficult to assess because the present phase retrieval algorithms are mainly based on infrared measurement that cannot lead unambiguously to the cloud phase. Current meth- odologies for retrieving cloud top phase are based mainly on infrared measurements or bispectral methods [Inoue, 1985; Saunders and Kriebel, 1988; Nakajima and King, 1989] using a threshold on the brightness temperature difference between AVHRR channels 4 and 5. Multispectral techniques based on near-infrared (0.75 and 1.64/•m) and infrared (11 /•m) mea-
surements have been shown to be reliable to make cloud phase
discrimination [King et al., 1992]. In this context, polarimetric observations, from which cloud top phase is derived, are orig- inal. In the paper we have checked the validity of POLDER against ground-based lidar observations and cloud classifica- tion applied to Meteosat data.
5.1. Validation Against Ground-based Lidar Network
The comparison between POLDER and lidar ground-based observations concerns only high-level cloud cases with a tem- perature lower than 233 K and where no low-level liquid clouds were present [Chepfer et al., 1998]. The different spatial reso-
lution of lidar and POLDER was taken into account by select-
ing spatially homogenous areas and temporally stable cloud layers. Within the whole available POLDER data set matching the lidar observations, 148 cases correspond to cloudy obser- vations performed at several places, mainly in Paris (France), ARM sites (United States and the Pacific Ocean), and Buenos Aires (Argentina). When the cirrus optical thickness is not too large, cloud top altitude can be inferred from lidar measure- ments. Then the use of simultaneous radio sounding yields the cloud top temperature. Among these data sets, 32 cases cor- respond to cirrus temperatures lower than 233 K. The analysis shows that most of these cases (95%) are declared as "ice" cloud by POLDER [Chepfer et al., 1998]. We assume that only ice phase is present when the temperature is lower than 233 K, which is the temperature at which water spontaneously solid- ifies. Among the same data sets, 32 other cases corresponding to cloud top temperature within the range 233-253 K are
declared ice (69%), "liquid" (6%), and "mixed phase" (25%)
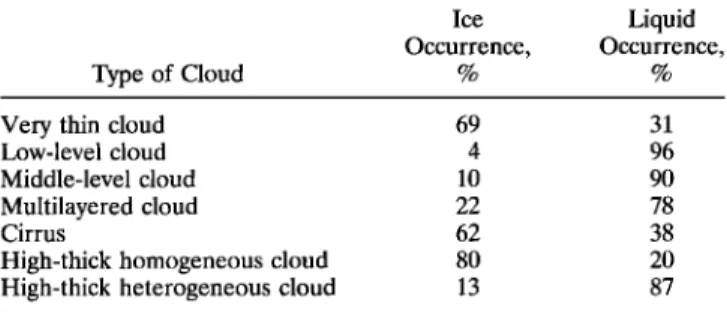
14,756 GOLOUB ET AL.: CLOUD PHASE CLASSIFICATION Table 1. Occurrence Frequency of Ice and Liquid Phase
As Derived From POLDER Versus Meteosat Cloud Type
Type of Cloud
Ice Liquid
Occurrence, Occurrence,
% %
Very thin cloud 69 31
Low-level cloud 4 96 Middle-level cloud 10 90
Multilayered cloud 22 78
Cirrus 62 38
High-thick homogeneous cloud 80 20 High-thick heterogeneous cloud 13 87
temperature greater than 253 K, 30% are declared ice, 20%
mixed, and 50% liquid. Despite the comparatively limited number of matching data, the results indicate that when the temperature is lower than 233 K, the ice phase is clearly identified by polari- metric measurements. When the temperature is greater than 233 K, POLDER retrievals exhibit sometimes ice phase, but occur- rence of liquid water increases when the temperature increases. The results of this study do not demonstrate rigorously the valid- ity of the cloud thermodynamical phase retrieval. Nevertheless, the thermodynamical phase inferred from POLDER is a first attempt to derive cloud phase from polarized observations. In the future the POLDER-2/ADEOS-2 thermodynamical phase re- trievals will be certainly more completely validated by compari- sons with (1) the growing ground-based lidar network that will allow to increase the number of validation data, (2) lidar de- polarization measurements giving the particles shape [Sassen et al., 1991], (3) other passive spaceborne instruments such as MODIS in 1999, (4) lidar in space (PICASSO-CENA in 2003) which will provide global thermodynamical phase retrieval from linear depolarization measurements.
5.2. Comparison With Cloud Classification
The POLDER thermodynamical phase retrieval was com- pared also with statistical cloud classifications resulting from visible (0.4-1.1/•m) and infrared (10-12/•m) Meteosat mea- surements. The comparison is preliminary, because is was tem- porally and spatially restricted to one Meteosat image in co- incidence with three POLDER orbits and only restricted to oceanic observations. The dynamic clustering method [S•ze and Desbois, 1987], based on statistical properties of visible and infrared radiances, has been applied to the Meteosat data acquired November 10, 1996. For the main Meteosat "cloud types," occurrence frequencies of ice phase and liquid phase derived from POLDER are presented in Table 1.
The "very thin cloud" type exhibits mostly ice phase (-70%) according to polarimetric signature. The 30% of liquid clouds can be explained by the fact that this cloud type includes not only very thin cirrus but also thin edges of liquid clouds.
The low-level, middle-level, and multilayered classes are es- sentially composed of liquid clouds. The occurrence of ice cloud in these classes is marginal and minimum for the low- level clouds (4%). This occurrence is doubled when consider- ing middle-level cloud class (10%) and increases again up to 22% in the case of multilayered clouds. These results are understandable, when considering that the higher clouds are located in the atmosphere, the higher the probability for ice phase is. Another reason is that as explained in section 3.3, in the case of relatively thin cirrus overlapping low-middle-level clouds, the polarized signature of the lower layer cloud (liquid)
is still observable from satellite and can bias the thermodynam- ical phase retrieval by favorizing the liquid phase.
Comparison between "cirrus" class and thermodynamical phase occurrence indicates that about 62% of this class are considered as ice clouds and 38% as liquid clouds. The non- negligible part of this cloud class considered as composed of liquid is somewhat a surprising result. Three reasons may be put forward: the first one is that cirrus clouds may be composed of spherical ice particles, but this is not in agreement with most in situ observations. The second reason is that monospectral infrared measurements cannot yield unambiguously the cloud thermodynamical phase. The presence of liquid water at low temperature (supercooled water) may also explain these re- sults. When investigating in detail the "cirrus" class, especially when focusing on "thick cirrus," we surprisingly observed that 55% of this subclass is composed of liquid water. One possible explanation is that thick cirrus may correspond in some cases to multilayered systems, with ice in the upper layer. In this case and for the upper cloud optical thickness smaller than 2, as explained previously, the algorithm may retrieve liquid water. The last class presented is the high-level cloud class. The cloud classification method distinguishes two separate classes: high-level, thick and heterogeneous clouds on the one hand and high-level, thick and homogeneous clouds on the other hand. The results of the phase occurrence for these two classes are distinguished in Table 1. First, let us consider the high- level, thick and homogeneous class. In more than 80% of the cases, these clouds are considered as composed of ice particles according to polarimetric observations. As explained in section 4, this particular class was used to check the different thresh- olds in the algorithm, and histograms shown in Plates 6 and 7 indicate unambiguous ice phase retrieval. For the second class, called high-level thick and heterogeneous clouds, the available observations exhibit a completely opposite trend. Most of these clouds are detected as composed of liquid water (87%), which is surprising when compared to the previous class. One possi- ble interpretation is that this class corresponds to multiple cloud layers (convective cloud with relatively thin cirrus layers in the upper layer). However, this result requires a further investigation (more Meteosat data and synergy with other sen- sors/techniques), which is out of the scope of the present paper.
6. Example of Geographic Distribution of Cloud
Thermodynamical Phase
We present, finally, one example of geographical phase dis- tribution as derived from POLDER. Its major features are briefly commented and qualitatively compared with general features previously derived from other independent sensors/ techniques [Rossow et al., 1996; Doutriaux-Boucher and S•ze, 1998; Wylie and Wang, 1997; Liao et al., 1995; Jin et al., 1996]. Plates 8 and 9 are the maps of the occurrence frequency for ice and liquid phase, respectively, for February 1997 (boreal winter). The spatial resolution for these maps is the standard POLDER level 2 cloud product resolution, which is about 60 km x 60 km. The occurrence frequency/of an ice (resp. liquid) cloud, is defined by the number of observed ice (resp. liquid) clouds over the number of cloudy observations. The number of cloudy obser- vations for the period is presented in Plate 10; some areas, such
as the Sahara, Arabia, or India, are very often cloud free.
The average occurrences for February have been derived from these maps. Over land and ocean, respectively, we find 39 and 27% of ice phase occurrence frequency and 61 and 73%
GOLOUB ET AL.: CLOUD PHASE CLASSIFICATION 14,757
Ice February 97
LOA-CNES-NASDA
0
Occurrence Frequency (%)
100
Plate 8. Example of ice phase geographical distribution for February 1997
0
Occurrence Frequency (%)
100
Plate 9. Example of liquid phase geographical distribution for February 1997.
February 97
Number of cloudy days
Plate 10. Number of cloudy days for February 1997.
14,758 GOLOUB ET AL.: CLOUD PHASE CLASSIFICATION for liquid water cloud. The repartition between ice and liquid
clouds at global scale is about 30% for ice clouds and 70% for liquid water clouds. It can be noted that ice phase is more frequent over land than over ocean, which is in agreement with previous climatologies of cloud-type distributions.
Plates 7 and 8 show that liquid water clouds are more fre- quent in the Southern Hemisphere, while ice clouds occur more frequently in the Northern Hemisphere. The Intertrop- ical Convergence Zone (ITCZ) is a region where ice phase is frequently observed (Indonesia, eastern Pacific, West Africa), which is essentially due to cumulonimbus convection, injecting water vapor and ice particles into the upper atmosphere. Con- trarily, in the Southern Hemisphere, eastern Pacific off South
America, Atlantic Ocean off South Africa, and Indian Ocean
exhibit weak ice cloud occurrence frequencies but a large oc- currence of liquid water clouds. For instance, stratocumulus clouds are very present off the Angola coasts and are generally detected as liquid water clouds according to polarimetric mea- surements. Same frequent occurrence detection of liquid water clouds is observed off the western South American coasts. Other regions where, according to POLDER, ice phase is observed frequently are northern Asia, Russian, northern Eu- rope, and western North America, which is also qualitatively consistent with other observations such as the ISCCP [Rossow et al., 1996] and climatologies of SAGE data [Liao et al., 1995], HIRS data [Wylie et al., 1997], and synoptic reports [Hahn and Warren, 1998]. Preliminary comparisons between ice phase and ISCCP high-level cloud occurrences are currently investigated [Riedi et al., 1999a] and show some differences that can be very likely attributed to POLDER cloud detection weakness (thin cirrus) and to the degraded spatial resolution of the phase product with respect to the sensor resolution.
7. Conclusions
Cloud thermodynamical phase retrieval based on near- infrared polarimetric measurements is a new method. An im- proved algorithm is described here. The algorithm takes ad- vantage of the measured polarized radiance at 0.865/•m. Both theoretical and experimental studies show that polarized sig- natures of water droplets and ice particles are quite different and thus can be used to discriminate between solid and liquid phases. Satellite cloud thermodynamical phase retrieval is somewhat difficult to validate. Two attempts have been per- formed: one original approach, which is based on ground- based lidar network. It shows that such observations are very useful for the thermodynamical phase retrieval, even if a mod- erate amount of data were available and linear depolarization was not measured. This first but important result clearly indi- cates the direction of future works. Extension of the ground- based lidar network is, clearly, essential for cirrus cloud stud- ies. Finally, future spaceborne lidar with depolarization measurements will be quite useful for this purpose.
Preliminary comparisons with cloud classification derived from Meteosat data show that liquid cloud (low-middle-level classes) are correctly identified by POLDER. However, some disagreements occur when considering the cirrus class. A non- negligible part of this class is detected as liquid clouds. Here may appear the major limitation of the polarimetric method, assuming Meteosat classification is right: thin cirrus overlap- ping the low-middle-level clouds can be interpreted as liquid water clouds. Two other limitations are (1) the efficiency of the
POLDER cloud detection itself, based on visible and near-
infrared channels, which is unable to detect very thin clouds, (2) the degraded spatial resolution of the operational POLDER cloud products. Full resolution (6.2 km x 6.2 km) should improve cloud phase detection, which is known to de- pend on the sensitivity and size of the sensor field of view.
Complementary studies are going on in progress (1) com- parison with synoptic weather reports over the whole POLDER operational period, (2) comparison with radar ob- servations [Riedi et al., 1999b]. In this case, the effect of mul- tiple cloud layers could be studied. The use of multispectral- spectral method with OCTS (Ocean Color and Thermal Scanner) sensor also on the ADEOS satellite or other visible- thermal sensors will be also useful to better understand ice phase retrieval.
Acknowledgments. The authors are very grateful to NASDA and CNES, who provided the POLDER data, De Haan and J. W. Hovenier for providing adding-doubling RT code, and A. Macke for providing polycrystal scattering properties.
References
Brfion, F. M., and S. Colzy, Cloud detection from the spaceborne POLDER instrument and validation against surface synoptic obser- vations, J. Appl. Meteorol., 36, 777-785, 1999.
Brfion, F. M., and P. Goloub, Cloud droplet effective radius from spaceborne polarization measurements, Geophys. Res. Lett., 25(11),
1879-1882, 1998.
Brogniez, G., Light scattering by finite hexagonal ice crystals arbitrarily oriented in space, in Proceedings of the International Radiation Sym- posium, edited by J. F. Gelyn and J. Lenoble, pp. 64-67, A. Deepak,
Hampton, Va., 1988.
Brogniez, G., J. C. Buriez, V. Giraud, and C. Vanbauce, Determina- tion of effective emittance and radiatively equivalent microphysical model of cirrus from ground-based and satellite observations during the International Cirrus Experiment: The 18 october 1989 case study, Mon. Weather Rev., 1.23, 1025-1036, 1995.
Buriez, J. C., C. Vanbauce, F. Parol, P. Goloub, M. Herman, B. Bonnel,
Y. Fouquart, P. Couvert, and G. S•ze, Cloud detection and deriva- tion of cloud properties from POLDER, Int. J. Remote Sens., 18,
2785-2813, 1997.
Cess, R. D., et al., Interpretation of cloud-climate feedback as pro- duced by 14 atmospheric general circulation models, Science, 245,
513-516, 1989.
Chepfer, H., G. Brogniez, Y. Fouquart, Cirrus clouds microphysical properties deduced from POLDER observations, J. Quant. Spec- trosc. Radiat. Transfer, 30, 375-390, 1998.
Chepfer, H., G. Brogniez, P. Goloub, F. M. Brfion, and P. H. Flamant, Cloud ice crystals horizontally oriented in space observed with POLDER1/ADEOS, J. Quant. Spectr. Radiat. _Transfer, 63, 521-543,
1999a.
Chepfer, H., G. Brogniez, V. Trouillet, J. Pelon, P. H. Flamant, and F. Albers, Remote sensing of cirrus radiative parameters during EUCREX'94, part 1, Observations and analysis at the regional scale, Mon. Weather Rev., 127, 504-518, 1999b.
Chepfer, H., P. Goloub, J. Spinhirne, P. H. Flamant, M. Lavorato, L. Sauvage, Brogniez, and J. Pelon, Cirrus cloud properties derived from POLDER-1/ADEOS polarized radiances: First validation us- ing a ground based lidar network, J. Appl. Meteorol., in press, 1999c. Curran, R. J., and M. L. C. Wu, Skylab near infrared observations of
clouds indicating supercooled liquid water droplets, J. Atmos. Sci.,
39, 635-647, 1982.
De Haan, J. F., P. B. Bosma, and J. W. Hovenier, The adding method for multiple scattering calculations of polarized light, Astron. Astro- phys., 183, 371-391, 1986.
Deschamps, P.-Y., F.-M. Br6on, M. Leroy, A. Podaire, A. Brickaud, J.-C. Buriez, and G. S•ze, The POLDER mission: Instrument char- acteristics and scientific objectives, IEEE, 32, 598-615, 1994. Doutriaux-Boucher, M., and G. S6ze, Significant changes between the
ISCCP C and D cloud climatologies, Geophys. Res. Lett., 25(22),
4193-4196, 1998.
GOLOUB ET AL.: CLOUD PHASE CLASSIFICATION 14,759
scattered radiances within the oxygen A band, part 1, Theoretical study, J. Appl. Meteorol., 30, 1245-1259, 1991.
Garcia, R. D. M., and C. E. Siewert, A generalized spherical harmonics solution for radiative transfer models that include polarization ef- fects, J. Quant. Spectr. Radiat. Transfer, 36, 401-423, 1986. Goloub, P., J. L. Deuzfi, M. Herman, and Y. Fouquart, Analysis of the
POLDER airborne polarization measurements performed over cloud covers, IEEE Trans. Geosci. Remote Sens., 32, 78-87, 1994. Hagolle, P., et al., POLDER in-flight calibration results, IEEE Trans.
Geosci. Remote Sens., 37, 1550-1566, 1999.
Hahn, C. J., and S. G. Warren, Extended edited synoptic cloud reports from ships and land stations over the globe, 1952-1996, Tech. Rep. NDP026C, Carbon Dioxide Inf. Anal. Cent., Oak Ridge Natl. Lab., Oak Ridge, Tenn., 1998.
Han, Q., W. B. Rossow, and A. A. Lacis, Near-global survey of effec- tive droplet radii in liquid water clouds using ISCCP data, J. Clim.,
7, 465-497, 1994.
Hansen, J. E., Multiple scattering of polarized light in planetary atmo- spheres, part I, The doubling method, J./ltmos. Sci., 28, 120-125, 1971. Heymsfield, A. J., G. M. McFarquhar, Cirrus cloud microphysical
properties from in-situ observations and their relation to shortwave radiative properties, in Cirrus, Opt. Soc. Am., 1, 29-31, 1998. Inoue, T., On the temperature and effective emissivity determination
of semi-transparent cirrus clouds by bi-spectral measurements in the 10 micron window region, J. Meteorol. Soc. Jpn., 63, 88-99, 1985. Jin, Y., W. B. Rossow, and D. P. Wylie, Comparison of the climatolo-
gies of high level clouds from HIRS and ISCCP, J. Clim., 9, 2850-
2879, 1996.
King, M.D., Y. Kaufman, W. P. Menzel, and D. Tanrfi, Remote sensing of cloud, aerosol, and water vapour properties from mod- erate resolution imaging spectrometer (MODIS), IEEE Trans. Geosci. Remote Sens., 30(1), 2-27, 1992.
Lawson, R. P., A comparison of ice crystal observations using a new cloud particles imager probe in Arctic cirrus and decaying anvil in Texas, in Cirrus, J. Opt. Soc. Am., 25, 113-115, 1998.
Lawson, R. P., A. J. Heymsfield, S. Aulenchach, and T. L. Jensen, Shapes, sizes and light scattering properties of ice crystals cirrus and a persistent contrail during SUCESS, Geophys. Res. Lett., 25, 1331-1334, 1998. Liao, X., W. B. Rossow, and D. Rind, Comparison between SAGE II
and ISCCP high-level clouds, 1, Global and zonal amounts, J. Geo- phys. Res., 100, 1121-1135, 1995.
Liou, K. N., Review: Influence of cirrus clouds on weather and climate
processes: A global perspective, Mort. Weather Rev., 114, 1167-1199, 1986.
Macke, A., J. Mueller, and E. Raschke, Single scattering properties of atmospheric ice crystals, J. Atmos. Sci., 53, 2813-2825, 1996. Masuda, K., and T. Takashima, Feasibility study of derivation of cirrus
information using polarimetric measurements from satellite, Remote
Sens. Environ., 39, 45-59, 1992.
Meischner, P., M. Hagen, T. Hauf, D. Heinmann, H. H611er, U. Schu- mann, W. Jaeschke, W. Mauser, and H. R. Pruppacher, The Field Project CLEOPATRA, May-July 1992 in southern Germany, Bull.
Am. Meteorol. Soc., 74, 401-412, 1993.
Miloshevich, L. M., and A. J. Heymsfield, A balloon-borne cloud particle replicator for measuring vertical profiles of cloud microphysics: Instrument design and performance, paper presented at the Interna- tional Conference of Cloud and Precipitation, Int. Comm. on Clouds and Precip./Int. Assoc. of Meteorol. and Atmos. Sci., Zurich, 1996. Miloshevich, L. M., and A. J. Heymsfield, A balloon-borne continuous
cloud particle replicator for measuring vertical profiles of cloud micro- physics properties: Instrument design and performance and collec- tion efficiency analysis, J. Atmos. Oceanic Technol., 753-768, 1997. Nakajima. T., and M.D. King• Determination of the optical thickness
and effective radius of clouds from reflected solar radiation mea-
surements, part I, Theory, J./ltmos. Sci., 47, 1878-1893, 1989. Nakajima, T. Y., and T. Nakajima, Wide-area determination of cloud
microphysical properties from NOAA AVHRR measurements for FIRE and ASTEX regions, J. Atmos. Sci., 52, 4043-4059, 1995. Nakajima, T., M.D. King, J. D. Spinhirne, and L. F. Radke, Deter-
mination of the optical thickness and effective radius of clouds from reflected solar radiation measurements, part II, Marine stratocumu-
lus observations, J./ltmos. Sci., 48, 728-750, 1991.
Paltridge, G. W., Infrared emissivity, short wave albedo, and micro- physics of stratiform water clouds, J. Geophys. Research., 79, 4053-
4058, 1974.
Parol, F., P. Goloub, M. Herman, J. C. Buriez, Cloud altimetry and
water phase retrieval from POLDER instrument during EUCREX'94, in Atmospheric Sensing and Modelling, edited by R. P. Santer, Proc. SPIE, 2311, 171-181, 1994.
Parol, F., J. C. Buriez, C. Vanbauce, P. Couvert, G. S•ze, P. Goloub,
and S. Cheinet, Information content on clouds from POLDER-
ADEOS, IEEE Trans. Geosci. Remote Sens., 37, 1597-1612, 1999. Pawlowska, H., and J. L. Brenguier, A study of the micro-physical
structure of stratocumulus cloud, Proc. Int. Conf. Cloud Phys., 1,
23-27, 1996.
Platt, C. M. R., and T. Takashima, Retrieval of water cloud properties from carbon dioxide lidar soundings, Appl. Opt., 26, 1257-1263, 1987. Ramanathan, V., The role of the Earth radiation budget studies in climate and general circulation research, J. Geophys. Res., 92, 4075-
4095, 1987.
Ramanathan, V., Climate and the earth's radiation budget, Phys. Today, pp. 22-32, 1989.
Ramanathan, V., R. D. Cess, E. F. Harrison, P. Minnis, B. R. Bark- strom, E. Ahmad, and D. Hartmann, Cloud radiative forcing and climate: Results from the Earth Radiation Budget Experiment, Sci-
ence, 243, 57-63, 1989.
Raschke, E., European Cloud and Radiation Experiment (EUCREX), final report, EV5V-CT 920130 EUCREX-2, 154 pp., 1996. (Available as D-2054, from GKSS Res. Cent., Geesthacht, Germany.) Riedi, J., M. Doutriaux-Boucher, P. Goloub, and P. Couvert, Global
distribution of cloud top phase from POLDER/ADEOS 1, Geophys. Res. Lett., in press, 1999a.
Riedi, J., P. Goloub, R. Marchand, and H. Chepfer, Cloud thermodynamic phase from POLDER/ADEOS: Comparison with millimeter wave radar measurements and synoptic weather reports, paper presented at the Conference on Remote Sensing of Clouds and Atmosphere, EOS/Int. Soc. for Opt. Eng., Florence, Italy, 20-24 September 1999b.
Rossow, W. B., A. W. Walker, D. E. Beuschel, and M. Roiter, Inter-
national Satellite Cloud Climatology Project (ISCPP), Documenta- tion of new cloud data sets, WMO/TD-737, 115 pp., World Meteorol. Organ., Geneva, 1996.
Saunders, R. W., and K. T. Kriebel, An improved method for detecting clear sky and cloudy radiances from AVHRR data, Int. J. Remote
Sens., 9, 123-150, 1988.
Sassen, K., The polarization lidar technique for cloud research: A review and current assessment, Bull. Am. Meteorol. Soc., 72, 1848-
1866, 1991.
S•ze, G., and M. Desbois, Cloud cover analysis in satellite imagery using spatial and temporal characteristics of the data, J. Clim./lppl. Meteorol., 26, 287-303, 1987.
Stephens, G. L., Radiation profiles in extended water clouds, I, Theory,
J. /ltmos. Sci., 35, 2111-2122, 1978.
Stephens, G. L., G. W. Paltridge, and C. M. R. Platt, Radiation profiles
in extended water clouds: Observations, J. Atmos. Sci., 35, 2133- 2141, 1978.
Takano, Y., K. N. Liou, Solar radiative transfer in cirrus clouds, part 1, Single scattering and optical properties of hexagonal ice crystals, J.
Atmos. Sci., 46, 3-19, 1989.
Warren, S. G., C. J. Hahn, J. London., R. M. Chervin, and R. Jenne,
Extended edited synoptic reports from ships and land stations over the globe, 1952-1996, 1952-1996, NC/IR Tech. Note, TN-317STR, 212 pp., Natl. Cent. for Atmos. Phys., Boulder, Colo., 1988. Weill, A., et al., SOFIA 1992 experiment during ASTEX, Global/lt-
mos. Ocean Syst., 3, 355-395, 1995.
Wylie, D. P., Cirrus and weather: A satellite perspective, in Cirrus, J. Opt. Soc. Am., 1, 66-69, 1998.
Wylie, D. P., and P. Wang, Comparison of cloud frequency data from HIRS and SAGE II, J. Geophys. Res., 102, 29,893-29,900, 1997. G. Brogniez, P. Goloub, M. Herman, and J. Riedi, Laboratoire d'Optique Atmosph6rique, Universitfi des Sciences et Technologies de Lille, 59655 Villeneuve d'Ascq Cedex. France. ([email protected] lillel.fr)
H. Chepfer, Laboratoire de M6t6orologie Dynamique, Ecole Poly- technique, 91128 Palaiseau. France.
P. Couvert, Laboratoire des Sciences du Climat et de
l'Environnement, CEA, 91191 Gif sur Yvette, France.
G. S6ze, Laboratoire de M6t6orologie Dynamique, CNRS, Univer-
sit6 P. et M. Curie, Jussieu, 75252 Paris, France.
(Received February 26, 1999; revised September 15, 1999; accepted November 15, 1999.)
![[PDF] Cours JAVA : le type string et arraylist | Cours java](data:image/gif;base64,R0lGODlhAQABAIAAAP///wAAACH5BAEAAAAALAAAAAABAAEAAAICRAEAOw==)