”Bacterial” Genome structures
Spring 2008 Lecture
Pr. J. R. Lobry
Universit´
e Claude Bernard Lyon I – France
Outline
1
Introduction
2
Genome size
3
Topology & #
4
G+C content
5
Replichores
6
Gene orientation biases
7
Chirochores
Introduction
Introduction
1
Introduction
2
Genome size
3
Topology & #
4
G+C content
5
Replichores
6
Gene orientation biases
7
Chirochores
Introduction Phylogenetic position
The three kingdoms
Universal Tree of Life
Pseudomonas Escherichia Halobacterium Methanobacterium Desulfurococcus Halococcus Methanococcus Thermoproteus Thermus Anacystis Bacillus Physarum Crithidia Tetrahymena Prorocentrum Saccharomyces Oryza Homo Drosophila Streptomyces
Introduction Phylogenetic position
The three kingdoms: eucarya
Universal Tree of Life
Pseudomonas Escherichia Halobacterium Methanobacterium Desulfurococcus Halococcus Methanococcus Thermoproteus Thermus Anacystis Bacillus Physarum Crithidia Tetrahymena Prorocentrum Saccharomyces Oryza Homo Drosophila Streptomyces
EUCARYA
Introduction Phylogenetic position
The three kingdoms: archaea
Universal Tree of Life
Pseudomonas Escherichia Halobacterium Methanobacterium Desulfurococcus Halococcus Methanococcus Thermoproteus Thermus Anacystis Bacillus Physarum Crithidia Tetrahymena Prorocentrum Saccharomyces Oryza Homo Drosophila Streptomyces
EUCARYA
ARCHAEA
Introduction Phylogenetic position
The three kingdoms: eubacteria
Universal Tree of Life
Pseudomonas Escherichia Halobacterium Methanobacterium Desulfurococcus Halococcus Methanococcus Thermoproteus Thermus Anacystis Bacillus Physarum Crithidia Tetrahymena Prorocentrum Saccharomyces Oryza Homo Drosophila Streptomyces
EUCARYA
ARCHAEA
EUBACTERIA
Introduction Phylogenetic position
The three kingdoms: root 1
Universal Tree of Life
Pseudomonas Escherichia Halobacterium Methanobacterium Desulfurococcus Halococcus Methanococcus Thermoproteus Thermus Anacystis Bacillus Physarum Crithidia Tetrahymena Prorocentrum Saccharomyces Oryza Homo Drosophila Streptomyces
EUCARYA
Root
PROCARYOTA
ARCHAEA
EUBACTERIA
Introduction Phylogenetic position
The three kingdoms: root 2
Universal Tree of Life
Pseudomonas Escherichia Halobacterium Methanobacterium Desulfurococcus Halococcus Methanococcus Thermoproteus Thermus Anacystis Bacillus Physarum Crithidia Tetrahymena Prorocentrum Saccharomyces Oryza Homo Drosophila Streptomyces
EUCARYA
Root
ARCHAEA
EUBACTERIA
Introduction Phylogenetic position
The three kingdoms: root 3
Universal Tree of Life
Pseudomonas Escherichia Halobacterium Methanobacterium Desulfurococcus Halococcus Methanococcus Thermoproteus Thermus Anacystis Bacillus Physarum Crithidia Tetrahymena Prorocentrum Saccharomyces Oryza Homo Drosophila Streptomyces
EUCARYA
Root
ARCHAEA
EUBACTERIA
Introduction Phylogenetic position
The three kingdoms: no root
Universal Tree of Life
Universal Tree of Life
Pseudomonas Escherichia Halobacterium Methanobacterium Desulfurococcus Halococcus Methanococcus Thermoproteus Thermus Anacystis Bacillus Physarum Crithidia Tetrahymena Prorocentrum Saccharomyces Oryza Homo Drosophila Streptomyces
EUCARYA
ARCHAEA
EUBACTERIA
Introduction Phylogenetic position
The three kingdoms: ”bacteria”
Universal Tree of Life
Universal Tree of Life
Pseudomonas Escherichia Halobacterium Methanobacterium Desulfurococcus Halococcus Methanococcus Thermoproteus Thermus Anacystis Bacillus Physarum Crithidia Tetrahymena Prorocentrum Saccharomyces Oryza Homo Drosophila Streptomyces
EUCARYA
ARCHAEA
EUBACTERIA
« BACTERIA »
?
Bacterial genome structures Introduction
Phylogenetic position
Organelles: chloroplasts & mitochondria
Endosymbiosis—More Than Just Organelles...493
Rates Ain’t Misbehavin’...493
WHAT NEXT?...494
ACKNOWLEDGMENTS ...495
REFERENCES ...495 INTRODUCTION
For over 50 years, scientists were confident with the notion that there were two basic kinds of living organisms, eubacteria and eukaryotes (306–308). In the late 1970s, this fundamental belief was shattered by the revelations of Woese and coworkers that life consisted not of two but three distinct groups of organisms (123, 337)—eukaryotes and two kinds of pro-karyotes, the eubacteria and the archaebacteria. Since then, our knowledge of the latter has reached the point where the first complete genome sequence from an archaebacterium (49) is now known, with several more soon to follow (31, 58, 161a). Given the growth of DNA sequence databases, science is now poised to make broad and sweeping comparisons of living organisms. However, well before the dawning of this new age of entire genome sequences, the cumulative efforts of many highly determined and capable researchers had led to an im-pressive knowledge base about the archaebacteria. This review is a modest attempt to summarize some of that research in the context of what has been learned about the nature of the universal tree of living organisms. Hopefully, from viewing the archaebacteria in this way, a better appreciation can be gained about the evolutionary significance of these remarkable organ-isms.
Contemporary views on early cellular evolution have been strongly shaped by molecular phylogenetics. Ever since Woese and coworkers demonstrated the distinctiveness of archaebac-teria on the basis of cluster dendrograms of data based on RNase T1oligonucleotide catalogs of rRNAs, phylogenetic
analyses have played a pivotal role in the maturation, and often
the upheaval, of macroevolutionary theory (336). Thus, a sec-ond goal of this review is to attempt a synthesis of universal trees based on different protein coding genes by reviewing and occasionally updating earlier phylogenetic studies and by add-ing analyses of new gene families. The dynamic growth of sequence databases makes it impossible to assemble a highly current yet comprehensive collection of species or genes prior to publication. Therefore, the multiple gene phylogenies pre-sented here are best seen as a general overview of the universal tree of life from different biochemical perspectives.
ARCHAEA ALONE
In 1990, Woese et al. (339) strongly advocated the replace-ment of the bipartate view of life with a new tripartite scheme based on three urkingdoms or domains; the Bacteria (eubac-teria), Archaea (archaebacteria) and Eucarya (eukaryotes) (Fig. 1). The rationale behind this revision came from a grow-ing body of evidence, in particular rRNA phylogenies, that the archaebacteria were worthy of the same taxonomic status as eukaryotes and eubacteria. Since then, the database of small-subunit rRNA sequences has grown to include over 2,000 pro-karyotes and several hundred eupro-karyotes. Despite the addition of a large number of new species, the existence of three major groups or clades of organisms is consistent throughout rRNA phylogenies (59, 246, 247, 303, 336).
However, the three-domain classification has been con-tested, most notably by Mayr (232), Margulis and Guerrero (224), and Cavalier-Smith (57). As a result, there is an awk-ward coexistence between the terminology of the old and new
FIG. 1. Schematic drawing of a universal rRNA tree showing the relative positions of evolutionary pivotal groups in the domains Bacteria, Archaea, and Eucarya. The location of the root (the cenancestor) corresponds to that proposed by reciprocally rooted gene phylogenies (43, 133, 164). The question mark beside the Archezoa group Microsporidia denotes recent suggestions that it might branch higher in the eukaryotic portion of the tree. (Branch lengths have no meaning in this tree.)
Introduction
General bacterial features
Half of biomass on earth
17 km
Bacterial Biomass
~ 5 10
30cells
Introduction
General bacterial features
Very few species
Described Bacterial Diversity
Pseudomonas Escherichia Halobacterium Methanobacterium Desulfurococcus Halococcus Methanococcus Thermoproteus Thermus Anacystis Bacillus Physarum Crithidia Tetrahymena Prorocentrum Saccharomyces Oryza Homo Drosophila Streptomyces
EUCARYA
ARCHAEA
EUBACTERIA
« BACTERIA »
5000 species
230000 angiosperms
500000 insecta
Introduction
General bacterial features
First species classification
An old trend
508 Eucaryota
0
Bacteria
Introduction
General bacterial features
Small bacteria
Little Bacteria
Introduction
General bacterial features
0.1 mm = 100 µm
Thickness ≈ 100 µm.
1 M
€ ≈ 1 m
Introduction
General bacterial features
Bacterial cell size is in µm
Introduction
General bacterial features
A giant: Epulopiscium fishelsoni bar is 50 µm
Bresler, V. et al (1998) J. Bact., 180:5601-5611.
Introduction
General bacterial features
Introduction
General bacterial features
1 colony ≈ 10
6
cells
Little Bacteria
Introduction
General bacterial features
Introduction
General bacterial features
Bacterial classification
Classification of Bacteria
• Was based mainly on physiology and growth conditions
E. coli
Introduction
General bacterial features
Bacterial classification: ”Candidatus Pelagibacter
ubique”
Introduction
General bacterial features
Bacterial classification: Candidatus
Candidatus examples:
”Candidatus Arsenophonus triatominarum”
”Candidatus Arthromitus”
”Candidatus Blochmannia”
”Candidatus Blochmannia floridanus”
”Candidatus Blochmannia herculeanus”
”Candidatus Burkholderia kirkii”
”Candidatus Glomeribacter gigasporarum”
”Candidatus Xiphinematobacter brevicolli”
Genome size
Genome size
1
Introduction
2
Genome size
3
Topology & #
4
G+C content
5
Replichores
6
Gene orientation biases
7
Chirochores
Genome size Units
bp: base pair
Common multiples are:
1 kb = 10
3
bp
1 Mb = 10
6
bp
1 Gb = 10
9
bp
Genome size Units
Length conversion
Dickerson et al (1982) Science, 216:475-485.
1 bp ≈ 0.33 nm
1 kb ≈ 0.33 µm
1 Mb ≈ 0.33 mm
1 Gb ≈ 0.33 m
Genome size Units
Mass conversion (1 pg = 10
−12
g)
Doleˇ
zel et al (2003) Cytometry, 51A:127-128.
Number of base pairs = mass in pg × 0.978 10
9
1 kb ≈ 10
−6
pg
1 Mb ≈ 10
−3
pg
1 Gb ≈ 1 pg
Genome size Units
Mass conversion constant and G+C content
Base
Nucleotide
Chemical formula
A
2’-deoxyadenosine 5’-monophosphate
C
10
H
14
N
5
O
6
P
T
2’-deoxythymidine 5’-monophosphate
C
10
H
15
N
2
O
8
P
G
2’-deoxyguanosine 5’-monophosphate
C
10
H
14
N
5
O
7
P
C
2’-deoxycytidine 5’-monophosphate
C
9
H
14
N
3
O
7
P
Genome size Units
Mass conversion constant and G+C content
0.0
0.2
0.4
0.6
0.8
1.0
0.9770
0.9775
0.9780
0.9785
Evolution of the conversion constant with GC content
Genome size Units
Evolution of the conversion constant with GC content
and the fraction of methylated CpG
GC content Fraction of methylated CpG 0.0 0.2 0.4 0.6 0.8 1.0 0.0 0.2 0.4 0.6 0.8 1.0
●
0.978Genome size As compared to other
The big picture
Virus, organelles
Tiny genomes (kb)
High gene density
”Bacteria”
Small genomes (Mb)
High gene density
Eucarya
Large genomes (Gb)
Low gene density
Genome size As compared to other
C value paradox
Genome size As compared to other
C value paradox
● ● ●●● ●●● ●●●●●● ● ●●● ●●●●● ● ●●●● ● ● ●●●●●● ● ●●●●●● ●● ●●●●●●●●● ●●●●●●●●● ●●●●●●●●●●●●●●●● ●●●● ●●●● ●●●●●●● ●●● ●●●●●● ●●●●●●●● ● ● ● ●● ●● ●● ● ● ●●●●●●●●●●●●●●●●● ● ●●● ●●●●● ●●●●● ● ●● ● ● ● ● amphibians annelids arachnids birds chordates cnidaria crustaceans echinoderms fish flatworms insects mammals misc−inverts molluscs myriapods nematodes reptiles rotifers sponges tardigrades −1.5 −1.0 −0.5 0.0 0.5 1.0 1.5 2.0Gregory, T.R. (2005) Animal Genome Size Database
Genome size Exceptions
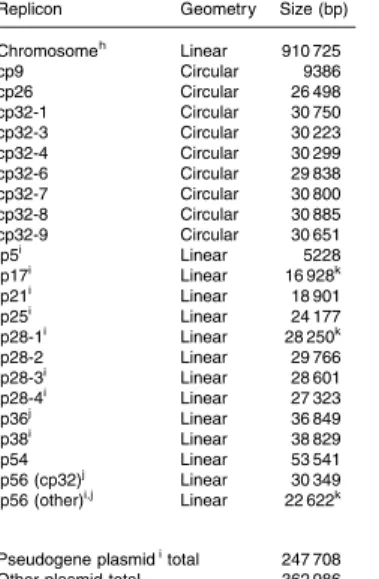
Giant virus: mimivirus 1.2 Mb
Electronic microscopy of a ”bacteria” on the left (Ureaplasma urealyticum (parvum)) with a genome size of 0.751 Mb and mimivirus on the rigth with a genome size of 1.181 Mb. Credit: the Mimivirus picture gallery from http://giantvirus.org/. Copyright: Prof. Didier Raoult, Rickettsia Laboratory, La Timone, Marseille, France.
Genome size Exceptions
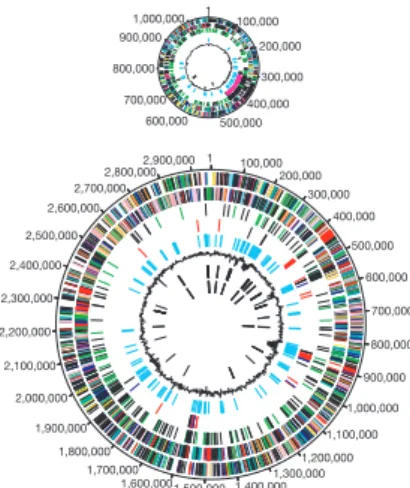
Pseudogenes in Rickettsia prowazekii
Nature © Macmillan Publishers Ltd 1998
8
pseudogenes (0.9% of the genome) and less than 0.2% of the genome is accounted for by non-coding repeats. The remaining 22.9% contains no open reading frames of signi®cant length and it has the low GC content (mean 23.7%) that is characteristic of spacer sequences in the R. prowazekii genome14. A region of 30
kilobases (kb) located at position 886±916 kb contains as much as 41.6% non-coding DNA and 11.5% pseudogenes. The non-coding DNA in this region has a small, but signi®cantly higher, GC content (mean 27.3%) than non-coding DNA in other areas of the genome (mean 23.7%) (P , 0:001), indicating that it may corre-spond to inactivated genes that are being degraded by mutation (Fig. 3).
Origin of replication. The origin of replication has not been experimentally identi®ed in the R. prowazekii genome, but we identi®ed dnaA at ,750 kb. However, the genes ¯anking the dnaA gene differ from the conserved motifs found in Escherichia coli and Bacillus subtilis (rnpA±rpmH±dnaA±dnaN±recF±gyrB). In R. pro-wazekii, the genes rnpA and rpmH are located in the vicinity of dnaA, but in the reverse orientation compared to the consensus motif, and dnaN, recF and gyrB are located elsewhere.
The origin and end replication in microbial genomes are often associated with transitions in GC skew (G 2 C=G C) values24. In
R. prowazekii we observe transitions in the GC skew values at
around 0 and 500±600 kb (Fig. 1). There is a weak asymmetry in the distribution of genes in the two strands, such that the ®rst half of the genome has a 1.6-fold higher gene density on one strand and the second half of the genome has a 1.6-fold higher gene density on the other strand. The shift in coding-strand bias correlates with the shift in GC-skew values. As most genes are transcribed in the direction of replication in microbial genomes, the origin of replication may correspond to the shift in GC-skew values at the position that we have chosen as the start point for numbering. Indeed, several short sequence stretches that are characteristic of dnaA-binding motifs are found in the intergenic region of genes RP001 and RP885 at 0 kb, supporting this interpretation.
Stable RNA sequences and repeat elements. We identi®ed 33 genes encoding transfer RNA, corresponding to 32 different isoacceptor-tRNA species. There is a single copy of each of the rRNA genes, with rrs located more than 500 kb away from the rrl±rrf gene cluster
articles
134 NATURE|VOL 396|12 NOVEMBER 1998|www.nature.com 0 50,000 100,000 150,000 200,000 250,000 300,000 350,000 400,000 450,000 500,000 550,000 600,000 650,000 700,000 750,000 800,000 850,000 900,000 950,000 1,000,000 1,050,000 R. prowazekii 1111523 bp
Figure 1 Overall structure of the R. prowazekii genome. The putative origin of replication is at 0 kb. The outer scale indicates the coordinates (in base pairs). The positions of pseudogenes are highlighted with death's heads. The distribution of genes is shown on the ®rst two rings within the scale. The location and direction of transcription of rRNA are shown by pink arrows and of tRNA genes by black arrows. The next circle in shows GC-skew values measured over all bases in the genome. Red and purple colours denote positive and negative signs,
respec-tively. The window size was 10,000 nucleotides and the step size was 1,000 nucleotides. The central circles shows GC-skew values calculated for third positions in the codon only. GC-skew values were calculated separately for genes located on the outer strand (green) and on the inner strand (blue). To allow easier visual inspection, the signs of the values calculated for genes located on the inner strand have been reversed.
Figure 2 Linear map of the R. prowazekii chromosome. The position and orientation of known genes are indicated by arrows. Coding regions are colour-coded according to their functional roles. The positions of tRNA genes are indicated (inverted triangle on stalk). For additional information, see http:// evolution.bmc.uu.se/,siv/gnomics/Rickettsia.html.
Q
Genome size Exceptions
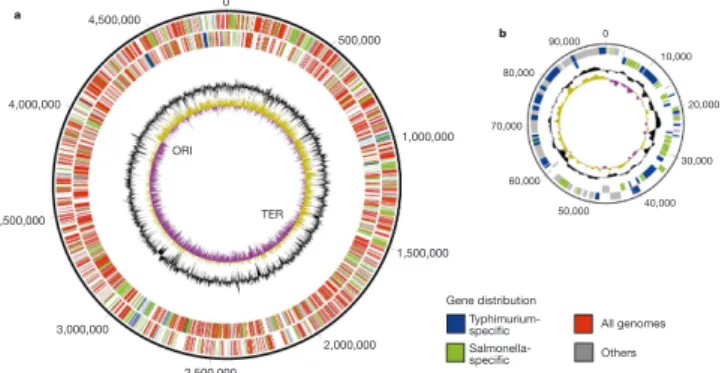
Pseudogenes in Mycobacterium leprae
NATURE|VOL 409|22 FEBRUARY 2001|www.nature.com 1007
articles
Massive gene decay in the leprosy
bacillus
S. T. Cole*, K. Eiglmeier*, J. Parkhill², K. D. James², N. R. Thomson², P. R. Wheeler³, N. HonoreÂ*, T. Garnier*, C. Churcher², D. Harris², K. Mungall², D. Basham², D. Brown², T. Chillingworth², R. Connor², R. M. Davies², K. Devlin², S. Duthoy*, T. Feltwell², A. Fraser², N. Hamlin², S. Holroyd², T. Hornsby², K. Jagels², C. Lacroix*, J. Maclean², S. Moule², L. Murphy², K. Oliver², M. A. Quail², M.-A. Rajandream², K. M. Rutherford², S. Rutter², K. Seeger², S. Simon*, M. Simmonds², J. Skelton², R. Squares², S. Squares², K. Stevens², K. Taylor², S. Whitehead², J. R. Woodward² & B. G. Barrell²
*Unite de GeÂneÂtique MoleÂculaire BacteÂrienne, Institut Pasteur, 28 rue du Docteur Roux, 75724 Paris Cedex 15, France ² Sanger Centre, Wellcome Trust Genome Campus, Hinxton, CB10 1SA, UK
³ Veterinary Laboratories Agency, Weybridge, Woodham Lane, New Haw, Addlestone, Surrey KT15 3NB, UK
...
Leprosy, a chronic human neurological disease, results from infection with the obligate intracellular pathogen Mycobacterium leprae, a close relative of the tubercle bacillus. Mycobacterium leprae has the longest doubling time of all known bacteria and has thwarted every effort at culture in the laboratory. Comparing the 3.27-megabase (Mb) genome sequence of an armadillo-derived Indian isolate of the leprosy bacillus with that of Mycobacterium tuberculosis (4.41 Mb) provides clear explanations for these properties and reveals an extreme case of reductive evolution. Less than half of the genome contains functional genes but pseudogenes, with intact counterparts in M. tuberculosis, abound. Genome downsizing and the current mosaic arrangement appear to have resulted from extensive recombination events between dispersed repetitive sequences. Gene deletion and decay have eliminated many important metabolic activities including siderophore production, part of the oxidative and most of the microaerophilic and anaerobic respiratory chains, and numerous catabolic systems and their regulatory circuits. Leprosy, one of the oldest recorded diseases, remains a major public
health problem. Although prevalence has been reduced extensively by WHO multidrug therapy and vaccination with BCG1,2, the
incidence of the disease remains worrying with more than 690,000 new cases reported annually3. In 1873, in the ®rst
convinc-ing association of a microorganism with a human disease, Armauer Hansen4discovered the leprosy bacillus in skin biopsies but failed to
culture Mycobacterium leprae. A century later, the nine-banded armadillo5was used as a surrogate host, enabling large quantities
of the bacillus to be isolated for biochemical and physiological studies. Subsequent efforts to demonstrate multiplication in syn-thetic media have been equally fruitless, although metabolic activity can be detected6. The exceptionally slow growth of the bacillus,
which has a doubling time of ,14 days (ref. 7), may contribute to these failures.
The means of transmission of leprosy is uncertain but, like tuberculosis, the infection is thought to be spread by the respiratory route because lepromatous patients harbour bacilli in their nasal passages. The bacterium accumulates principally in the extremities of the body where it resides within macrophages and infects the Schwann cells of the peripheral nervous system. Lack of myelin production by infected Schwann cells, and their destruction by host-mediated immune reactions, leads to nerve damage, sensory loss and the dis®guration that, sadly, are the hallmarks of leprosy. Genome features and reductive evolution
Sequence analysis. The complete genome sequence of M. leprae contains 3,268,203 base pairs (bp), and has an average G+C content of 57.8% (Table 1). These values are much lower than those reported for the M. tuberculosis genome, which comprises ,4,000 genes, 4,411,532 bp and 65.6% G+C (ref. 8). From detailed pairwise comparisons of both genome and proteome sequences8,9, only
49.5% of the M. leprae genome contains protein-coding genes, whereas 27% contains recognizable pseudogenes (inactive reading frames with functional counterparts in the tubercle bacillus). The remaining 23.5% of the genome does not appear to be coding, and may correspond to regulatory sequences or even gene remnants
mutated beyond recognition. The distribution of the 1,116 pseudo-genes is essentially random (Fig. 1), and if these are excluded 1,604 potentially active genes remain, of which 1,439 are common to both pathogens. Among the 165 genes with no orthologue in M. tuberculosis are 29 for which we can attribute functions. Many of the 136 residual coding sequences in M. leprae, which show no similarity to known genes, may also represent pseudogenes as they are shorter than average (Table 1) and occur in regions of low gene density (Fig. 1).
Reductive evolution. Assuming that the genome of M. leprae was once topologically equivalent and similar in size to those of all other mycobacteria (,4.4 Mb)10±12, then extensive downsizing and
rearrangement must have occurred during evolution. If all the genes in the ,3.3 Mb M. leprae genome were active, one would expect 3,000 proteins as compared with the 4,000 predicted in M. tuber-culosis. Comparative proteome analysis detected only 391 soluble protein species13, compared with ,1,800 in M. tuberculosis14,
indicating that the pseudogenes are translationally inert. Thus, since diverging from the last common mycobacterial ancestor, the leprosy bacillus may have lost more than 2,000 genes.
Reductive evolution is documented in obligate intracellular parasites, such as Rickettsia and Chlamydia spp., and in some endosymbionts15, because genes become inactivated once their
functions are no longer required in highly specialized niches. This process may have naturally de®ned the minimal gene set for a
Table 1 Comparison of genome features
Feature M. leprae M. tuberculosis
...
Genome size (bp) 3,268,203 4,411,532
G+C (%) 57.79 65.61
Protein coding (%) 49.5 90.8
Protein-coding genes (no.) 1,604 3,959
Pseudogenes (no.) 1,116 6*
Gene density (bp per gene) 2,037 1,114
Average gene length (bp) 1,011 1,012
Average unknown gene length (bp) 338 653
... * Excluding IS elements.
© 2001 Macmillan Magazines Ltd
Bacterial genome structures Genome size
Exceptions
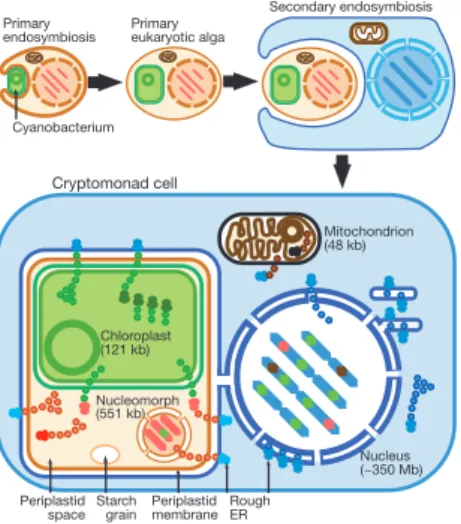
Tiny eucaryal genome: Guillardia theta is only 551 kb
letters to nature
1092 NATURE|VOL 410|26 APRIL 2001|www.nature.com
compartments, between which proteins are translocated. Until now, understanding how these genomes cooperate has been limited by the availability of only partial sequences for nucleomorph genomes11,12.
We report the ®rst complete genome sequence of a nucleomorph (551,264 base pairs (bp)), which proves conclusively that it is a vestigial nucleus13and that cryptomonads comprise one eukaryotic
cell nested in another. Gene density is extremely high (1 gene per 977 bp) and non-coding regions are ultrashort, with only one pseudogene wrpl24 (Fig. 2). The six chromosome ends are identical repeats, comprising telomeres ([AG]7AAG6A)11, 5S and 28S/5.8S/
18S ribosomal RNA genes and ®ve open reading frames (ORFs); the ubiquitin conjugation enzyme gene is repeated at ®ve ends, and the TATA-box binding protein gene (tfIId) at three ends. Except in these repeats and ®ve central 200±500-bp regions (possibly centromeric), intergenic spacers have few, if any, nucleotides. Forty-four genes overlap by up to seventy-six nucleotides (Fig. 2). One gene has three copies, one on chromosome 1 (ORF 160a) and two on chromosome 3 (ORF 160b,c); the only other repeated genes are in the termini. Coding regions of some genes are shorter than their homologues in other organisms.
Only 17 protein-coding genes contain spliceosomal introns (42± 52 bp long; see Supplementary Information), all located in the 59 region, as in yeast14, many immediately after the initiator AUG.
Eleven are in ribosomal protein genes, as in yeast where their splicing negatively regulates messenger RNA levels14. Like the even
shorter pygmy introns of chlorarachnean nucleomorphs12, they
have standard GT/AG boundaries. Twelve transfer RNA genes have protein-spliced introns. The marked contrast between the effective elimination of non-coding DNA from cryptomonad nucleomorphs and the accumulation of vast amounts of non-coding DNA in coexisting cryptomonad nuclei indicates that nuclear non-coding DNA in general is functional and positively selected5, and is not purely sel®sh or junk. Chromosomal A+T
content varies, suggesting that there have been three different mutational and selective pressures on base composition: on the terminal repeats (45.5% G+C); on housekeeping genes with a very low G+C content (23%); and on transfer RNA genes and genes for plastid proteins with intermediate G+C content (35%).
The function of 219 of the 464 putative protein-coding genes is unknown, but 31 have convincing database matchesÐ11 to cyano-bacteria and 20 to eukaryotes. Retention of the latter, even in this exceptionally compacted genome, shows that they must have important functions in all eukaryotes. The other 245 genes have homologues of known function, mostly for chromosome reproduc-tion or gene expression, with very few for cytoplasmic funcreproduc-tions such as protein assembly and degradation, signal transduction/ regulation, cell-cycle control and membrane transport (Fig. 3). Only one gene for metabolism (carotenoid synthesis) was found. There are 47 different genes for non-mRNAs (rRNA, tRNA, small nuclear RNA, small nucleolar RNA).
Three conclusions can be drawn about intergenome cooperation in these complex eukaryote/eukaryote chimaeras. First, most iden-ti®ed genes (. 250/302) are needed simply for self-perpetuation of the nucleomorph and its periplastid ribosomes. End products directly useful to the rest of the cell are encoded by only a few genes including 30 chloroplast proteins, 3 transporters (Sut1 for sulphate; Kea1 for potassium; Rli1, an ABC transporter), an ana-bolic enzyme (Ggt), and a few regulatory enzymes. Second, even fewer cryptomonad plastid proteins are encoded by the nucleo-morph than by the plastid genome15, so at least a thousand more1
must be imported into the plastid across four membranes, not two membranes as for nucleomorph-encoded ones. Third, as certain well-conserved genes essential for nucleomorph functions are absent from the nucleomorph genome, these functions must be provided by nuclear genes and imported into the periplastid compartment.
It was not known previously that nuclear gene products not destined for the chloroplast were imported into the periplastid space4. As in mitochondria and chloroplasts, DNA polymerase
genes are absent. DNA polymerases must be nuclear encoded and imported across the RER and periplastid membranes, and onwards into the nucleomorphs through their nuclear pores. As we identi®ed so few genes for transporters, most must be encoded by nuclear genes or nucleomorph ORFs. As chromobiotes lost the nucleo-morph, they are likely to have homologous transport proteins in their nuclei. If chromists are sisters of alveolate protozoa, sharing a photosynthetic common ancestor1,4,16, some may be also present in
Sporozoa, such as malaria parasites, and important for their periplastid membranes and as potential drug targets.
Under 10% of the genes encode end-product functions5that are
useful to the rest of the cell. Originally three end-product functions
Primary endosymbiosis Primary eukaryotic alga Cyanobacterium Nucleus (~350 Mb) Mitochondrion (48 kb) Starch grain Periplastid membrane Periplastid space Chloroplast (121 kb) Nucleomorph (551 kb) Rough ER Cryptomonad cell Secondary endosymbiosis
Figure 1 Secondary symbiogenetic origin and membrane topology of cryptomonads. After the primary endosymbiotic incorporation of a cyanobacterium to form the ®rst chloroplast (green), many of its genes were transferred into the host nucleus. After this ancestral plant diversi®ed to form green plants, red algae and glaucophytes, more complex algae were formed by independent secondary symbioses involving green or red algae, after which many or all plastid protein genes were transferred from the algal to the secondary host's nucleus. Shown here is the symbiosis of a red alga to form cryptomonads, where (as in all chromists) the food vacuole membrane fused with the RER. This fusion did not occur in alveolates, chlorarachneans or euglenoids. Former cyanobacterial genes now inserted in nucleomorph or nuclear chromosomes are shown in green, and former red algal genes now in the host nucleus in red. In cryptomonads, the chloroplast and nucleomorph (former red algal nucleus) are topologically in the periplastid space (starch- and ribosome-containing residual cytoplasm of the former red algal cell, yellow) in the periplastid membrane (former red algal plasma membrane), which is located in the lumen of the host's rough endoplasmic reticulum (RER). Chloroplast proteins are coded by three genomes (chloroplast, nucleomorph and nucleus) and mitochondrial proteins by two genomes (mitochondrion and nucleus). Nucleomorph and periplastid proteins are coded by two genomes (nucleus and nucleomorph). Coloured dots indicate protein translocation pathways in the periplastid complex: nuclear- or nucleomorph-encoded proteins targeted to the chloroplast are green; nuclear-encoded proteins imported into the periplastid space, and both nuclear- and nucleomorph-encoded proteins imported into the nucleomorph, are red. Mitochondrial proteins (brown) are encoded by both nuclear and mitochondrial genomes.
© 2001 Macmillan Magazines Ltd Douglas, S. et al (2001) Nature, 410:1091-1096.
Genome size Exceptions
Tiny eucaryal genome: Encephalitozoon cuniculi is only
2.9 Mb
463
Microsporidia are well-known to infect immunocompromised patients and are also responsible for clinical syndromes in immunocompetent individuals. In recent years, evidence has been obtained in support of a very close relationship between Microsporidia and Fungi. In some species, the compaction of the genome and genes is remarkable. Thus, a systematic sequencing project has been initiated for the 2.9 Mbp genome of Encephalitozoon cuniculi, which will be useful for future comparative genomic studies.
Addresses
Laboratoire Parasitologie Moléculaire et Cellulaire, UMR CNRS 6023, Université Blaise Pascal, 63177 Aubière Cedex, France *e-mail: [email protected]
Current Opinion in Microbiology 2000, 3:463–467
1369-5274/00/$ — see front matter © 2000 Elsevier Science Ltd. All rights reserved.
Abbreviations
DHFR dihydrofolate reductase
HSP heat-shock protein
ITS internal transcribed spacer
kbp kilobase pair
Mbp megabase pair
PTP polar tube protein
rRNA ribosomal RNA
TS thymidilate synthase
UTR untranslated region
Introduction
Microsporidia are amitochondrial unicellular eukaryotic and intracellular parasites. About 1000 species parasitize members of almost all animal phyla. They are oppor-tunistic pathogens, infecting AIDS patients, and their prevalence in the European population is predicted to be about 8% [1]. They harbor some prokaryotic-like fea-tures: 70S ribosomes, 16S and 23S ribosomal RNA (rRNA), and fusion of the 5.8S sequence to the 23S rRNA 5′end. Phylogenetical analysis of microsporidian small subunit ribosomal RNA (SSUrRNA) and transla-tion elongatransla-tion factors suggested a very early evolutionary origin of Microsporidia and lent credit to the hypothesis of a primitive amitochondrial state [2,3]. In contrast, the identification of separated coding regions for thymidilate synthase (TS) and dihydrofolate reductase (DHFR), as in fungi and metazoa, supported a late origin of Microsporidia [4]. The placement of these organisms among the fungi has been inferred from tubulin phylogenies [5].
The microsporidian life cycle occurs usually in a single host, starting after the ingestion of spores contaminating the environment or the diet. The invasion process is unique in the living world. The activated spore fires a very long tubular element (polar tube) into a target cell through which the sporoplasm including nucleus is then injected.
The intracellular development frequently takes place with-in a parasitophorous vacuole surrounded by numerous host mitochondria [6•]. The nuclear apparatus is represented by either single nucleus or paired nucleus (diplokaryon). The ploidy level is unknown. The intranuclear mitosis involves spindle pole bodies, and the cell divides by either binary or multiple fission. There is no evidence for meiosis in species parasitizing vertebrates.. The haploid genome size of
Encephalitozoon cuniculi, a species parasitizing a wide range
Towards the minimal eukaryotic parasitic genome
Christian P Vivarès* and Guy Méténier
Figure 1
Molecular karyotype variability in Encephalitozoon cuniculi. Three strains have been discriminated so far, on the basis of immunological and molecular criteria. A useful genetic marker is a tetranucleotide
repeat (5′-GTTT-3′) within the first and unique internal transcribed
spacer (ITS1) of the rDNA unit (three repeats for strain I, four repeats for strain II and two repeats for strain III). Hybridisation experiments have shown the conservation of 11 different chromosomes separated by pulsed-field gel electrophoresis (PFGE) in the strain I reference isolate. Isolates classified within different strains were found to be heterogeneous in respect of the PFGE karyotype [10]. Examples of profiles observed for these strains are illustrated here. The numbers down the side correspond to chromosomes in order of size. Each chromosome is identified by a specific gridded box. The left-most profile is characteristic of the strain I reference isolate. The boxes in white correspond to chromosomes that have not been clearly identified because of their small size range. Variations in banding pattern can be related to co-migration of some heterologous chromosomes, as well as to differential migration of some homologous ones. Chromosome size distributions in variants from strains II and III are shifted down (15–20 kbp) relative to strain I. VII V XI Strain I reference isolate
Strain I Strain III Strain II
X IX VIII VI IV III II I
Current Opinion in Microbiology Katinka, M.D. et al (2001) Nature, 414:450-453.
Genome size Exceptions
Overlap of free living forms
Eucarya Saccharomyces cerevisiae is 12 Mb
Bacteria Sorangium cellulosum is 13 Mb
Genome size
Between species variability
What is the distribution of bacterial genome size?
Study this yourself:
Genome size
Between species variability
Genome size for 279 bacteria (GOLD 2002)
Distribution de la tailles de 279 genomes bacteriens Taille du genome en Kb Densite 0 2000 4000 6000 8000 10000 0.00000 0.00010 0.00020 0.00030
Genome size
Between species variability
Genome size for 1062 bacteria (GOLD 2007)
Genome size distribution for 1062 bacterial genomesGenome size [Mb] Genome count 0 2 4 6 8 10 12 0 50 100 150 200 50 173 215 133 165 188 59 39 21 12 5 0 1 1 Maximum likelihood estimates:
p ^ 1==0.315 µµ^1==2 σσ^1==0.6 p ^ 2==0.685 µµ^2==4.5 σσ^2==1.8
Gaussian kernel density estimation Source of data: GOLD (Genomes OnLine Database) Sun Feb 4 20:49:42 2007
Genome size
Between species variability
Genome size for 681 bacteria (PFGE data)
Genome size distribution for 681 bacterial genomes Genome size [Mb] Genome count 0 2 4 6 8 10 12 0 50 100 150 4 42 62 154 77 47 37 494952 23 19 91313146 5 2 3 0 0 0 0 1
Genome size
Between species variability
Genome size summary
From PFGE data:
Range: from 0.45 Mb (Buchnera) to 13.0 Mb (Sorangium
cellulosum).
Three modes at 2 Mb, 4.5 Mb, and 8 Mb, respectively.
From complete genome data:
Range: from 0.146 Mb (Sulcia muelleri (Wu, D. et al. 2006
PLoS Biol,4:e188));0.160 Mb (Carsonella rudii (Nakabachi, A.
et al. 2006 Science,314:267)) to 13.0 Mb.
Genome size
Between species variability
Generalists versus specialists
Genome size
Between species variability
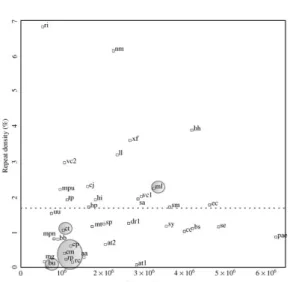
Genome size & repeat density
Genetica 115: 1–12, 2002.
© 2002 Kluwer Academic Publishers. Printed in the Netherlands. 1
Genome deterioration: loss of repeated sequences and accumulation of
junk DNA
A. Carolin Frank, Haleh Amiri & Siv G.E. Andersson
∗Department of Molecular Evolution, University of Uppsala, Uppsala, S-751 36 Sweden;∗Author for
correspon-dence (Phone:+46-18-4714379; Fax: +46-18-471 64 04; E-mail: [email protected])
Key words: gene loss, genome degradation, microbial genomes, repeated sequences
Abstract
A global survey of microbial genomes reveals a correlation between genome size, repeat content and lifestyle. Free-living bacteria have large genomes with a high content of repeated sequences and self-propagating DNA, such as transposons and bacteriophages. In contrast, obligate intracellular bacteria have small genomes with a low content of repeated sequences and no or few genetic parasites. In extreme cases, such as in the 650 kb-genomes of aphid endosymbionts of the genus Buchnera all repeated sequences above 200 bp have been eliminated. We speculate that the initial downsizing of the genomes of obligate symbionts and parasites occurred by homologous recombination at repeated genes, leading to the loss of large blocks of DNA as well as to the consumption of repeated sequences. Further sequence elimination in these small genomes seems primarily to result from the accumulation of short deletions within genic sequences. This process may lead to temporary increases in the genomic content of pseudogenes and ‘junk’ DNA. We discuss causes and long-term consequences of extreme genome size reductions in obligate intracellular bacteria.
Introduction
During the last few years, we have witnessed an ex-plosion in the field of microbial genomics. To date, over 60 microbial genome sequences have been pub-lished and another 100 genomes are in different stages of completion (http://www.tigr.org). These represent all three kingdoms and most bacterial and archaeal phyla. To interpret this flood of information from an evolutionary perspective, we have to develop models that describe causes and consequences of genome size variations and integrate these with our knowledge of microbial relationships, that is, rRNA phylogenetic trees (Olsen et al., 1994).
Microbial genomes vary more than tenfold in size, from 580 kb in Mycoplasma genitalium to 9.2 Mb in
Myxococcus xanthus (Casjens, 1998). Even within
bacterial subdivisions, the entire size span of ge-nome sizes may be represented. For example, in the α-proteobacterial subdivision genomes vary in size from 1.1 Mb in Rickettsia prowazekii to 8.7 Mb in Bradyrhizobium japonicum. Here, there are also
several examples of bacteria with complex genome structures, that is, more than one replicating circle, as observed for example in Agrobacterium
tumefa-ciens, Rhodobacter capsulatus, Brucella melitensis
(Casjens, 1998) and Rhizobium (Flores et al., 2000). The role of repetitive sequences as targets for homo-logous recombination and rearrangements has recently been demonstrated in Rhizobium (Flores et al., 2000). Genome sizes can vary quite extensively even for closely related strains and species that show low de-grees of divergence at the nucleotide sequence level. For example, a recent investigation of different iso-lates of Bartonella henselae revealed a size variation between 1.7 and 2.9 Mb (Maruyama et al., 2001). Likewise, a comprehensive study of natural isolates of
Escherichia coli shows that these vary in genome size
from 4.5 to 5.5 Mb (Bergthorsson & Ochman, 1998). The two completely sequenced E. coli genomes ex-emplify this size variation (Perna et al., 2001). Thus, the genome of strain O157:H7 is substantially lar-ger (5.5 Mb) than the genome of strain K12 (4.6 Mb) and there is a 422 kb inversion around the replication
Genome size
Between species variability
Genome size & repeat density
6
Figure 2. Comparisons of repeat density and genome size. Exact repeats larger than 200 bp were detected using the software Reputer (Kurtz &
Schleiermacher, 1999) (http://bibiserv.techfak.uni-bielefeld.de/reputer/). The number of basepairs present in one or several repeats larger than 200 bp was calculated for each genome. The repeated fraction of the genome is plotted against genome size and the average repeat density (1.7%) is indicated with a dotted line. Obligate intracellular parasites are shown in shaded colour. Genomic data not present in Figure 1 were taken from: Bolotin et al. (2001) (AE005176), Ogata et al. (2001) (AE006914), McClelland et al. (2001) (AE006468), Takami et al. (2000) (BA000004), Chambaud et al. (2001) (AL445566), Hoskins et al. (2001) (AE007317). Freiberg et al. (1997) (AE000083), Capela et al. (2001) (AL591688). Abbreviations are used as follows: aa (A. aeolicus), at1 (A. tumefaciens circular chromosome), at2 (A. tumefaciens linear chromosome), bb (B. burgdorferi), bh (B. halodurans), bs (B. subtilis), bu (Buchnera), cc (C. crescentus), cj (C. jejuni), cm (C. muridarum), cp (C. pneumoniae), ct (C. trachomatis), dr1 (D. radiodurans chromosome1), ec (E. coli), hi (H. influenzae), hp (H. pylori), ll (L. lactis), mg (M. genitalium), mp (M. pneumoniae), mpu (M. pulmonis), mt (M. tubercolosis), nm (N. meningitidis), rc (R. conorii), rp (R. prowazekii), ri (Rhizobium etli, plasmidcpNGR234a), sa (S. aureus), se (S. enterica), sm (S. meliloti), sp (S. pneumoniae), sy (Synechocystis), tp (T. pallidum), uu (U. urealytica), vc1 (V. cholerae chromosome 1), vc2 (V. cholerae chromosome 2), xf (X. fastidiosa).
segment (Syvänen et al., 1996). In some species, ge-nome rearrangements at repeated sequences occur at frequencies that are measurable in real time. For ex-ample, populations with all possible rearrangements matching those predicted from the location of dir-ectly repeated sequences in the symbiotic plasmid of
Rhizobium has been identified (Flores et al., 2000).
In this case, direct-repeated sequences ranging in size from 2.6 to 4.3 kb are flanking amplicons of 36– 307 kb (Flores et al., 2000). A total of 14 potential rearrangements generated by homologous recombina-tion at these sites could be identified in the Rhizobium population (Flores et al., 2000).
Short repetitive sequences have been identified near to the rRNA genes and the tuf genes in sev-eral Rickettsia species and these are flanking short deletions in other species (Andersson et al., 1995; Amiri, Alsmark & Andersson, 2002). This suggests that homologous recombination at repeated sites do not only cause major genome rearrangements but also contributes to the loss of short sequence segments (Andersson et al., 1995; Amiri, Alsmark & An-dersson, 2002). A novel type of repetitive element was recently identified in the R. conorii genome, called the Rickettsia Palindromic Element (Ogata et al., 2001). We have shown that this element flourished already
Genome size
Between species variability
Genome size & repeat density
8
Figure 3. Schematic illustration of genome size variations as a function of time during transitions to intracellular growth habitats. Filled boxes
represent mobile genetic elements. Genomes of obligate intracellular bacteria are smaller and have a lower content of repeated sequences (//) and a higher content of pseudogenes (x) than genomes of free-living bacteria and facultative intracellular parasites.
contrast to the rapid and clean excision of sequences that are flanked by repeated sequences.
The reductive evolutionary processes that we ob-serve in the genomes of modern obligate intracellu-lar parasites and symbionts may cast some light on the way in which the mitochondrial genomes were once reduced in size (Andersson & Kurland, 1999; Kurland & Andersson, 2000). The mitochondrion is thought to have originated from an endosymbiotic bac-terium that evolved by a massive elimination of genes, some of which genes may have been transferred from the endosymbiont to the nuclear genome (Andersson & Kurland, 1999; Karlberg et al., 2000; Kurland & Andersson, 2000). Studies of the evolution of obli-gate intracellular parasites and symbionts have already provided extensive information about the first of these processes, that is, genome degradation. Whether we can also identify examples of the other two processes, that is, downloading of bacterial genes to the host nu-clear genome and/or recruitment of host nunu-clear genes for service in the parasite/symbionts remain to be determined.
Acknowledgements
The authors work is supported by the National Science Research Council and the Foundation for Strategic Research.
References
Amiri, H., U.C.M. Alsmark & S.G.E. Andersson, 2002. Prolifera-tion and deterioraProlifera-tion of Rickettsia Palindromic Elements. Mol. Biol. Evol. In press.
Andersson, J.O. & S.G.E. Andersson, 2001. Pseudogenes, junk DNA, and the dynamics of Rickettsia genomes. Mol. Biol. Evol. 18: 829–839.
Andersson, J.O. & S.G.E. Andersson, 1999a. Insights into the evol-utionary process of genome degradation. Curr. Opin. Genet. Dev. 9: 664–671.
Andersson, J.O. & S.G.E. Andersson, 1999b. Genome degrada-tion is an ongoing process in Rickettsia. Mol. Biol. Evol. 16: 1178–1191.
Andersson, S.G.E., A. Zomorodipour, J.O. Andersson, T. Sicheritz-Ponten, U.C. Alsmark, R.M. Podowski, A.K. Naslund, A.S. Eriksson, H.H. Winkler & C.G. Kurland, 1998. The genome se-quence of Rickettsia prowazekii and the origin of mitochondria. Nature 396: 133–140.
Genome size
Within species variability
Genome size polymorphism in E. coli
6
Mol. Biol. Evol. 15(1):6–16. 1998
q 1998 by the Society for Molecular Biology and Evolution. ISSN: 0737-4038
Distribution of Chromosome Length Variation in Natural Isolates of
Escherichia coli
Ulfar Bergthorsson and Howard Ochman Department of Biology, University of Rochester
Large-scale variation in chromosome size was analyzed in 35 natural isolates of Escherichia coli by physical mapping with a restriction enzyme whose sites are restricted to rDNA operons. Although the genetic maps and chromosome lengths of the laboratory strains E. coli K12 and Salmonella enterica sv. Typhimurium LT2 are highly congruent, chromosome lengths among natural strains of E. coli can differ by as much as 1 Mb, ranging from 4.5 to 5.5 Mb in length. This variation has been generated by multiple changes dispersed throughout the genome, and these alterations are correlated; i.e., additions to one portion of the chromosome are often accompanied by additions to other chromosomal regions. This pattern of variation is most probably the result of selection acting to maintain equal distances between the replication origin and terminus on each side of the circular chromosome. There is a large phylogenetic component to the observed size variation: natural isolates from certain subgroups of E. coli have consistently larger chromosomes, suggesting that much of the additional DNA in larger chromosomes is shared through common ancestry. There is no significant correlation between genome sizes and growth rates, which coun-ters the view that the streamlining of bacterial genomes is a response to selection for faster growth rates in natural populations.
Introduction
Escherichia coli and Salmonella enterica are
close-ly related species of enteric bacteria that diverged an estimated 120 to 160 MYA (Ochman and Wilson 1987). Comparisons of the genetic maps of the best character-ized representatives of these species, E. coli K12 and S.
enterica sv. Typhimurium LT2, reveal extensive
conser-vation in the order and spacing of mapped loci (Riley and Krawiec 1987). Moreover, the chromosome sizes of these two strains, as estimated by physical mapping pro-cedures, are very similar: the E. coli K12 chromosome is 4.6 Mb in length (Kohara, Akiyama, and Isono 1987; Smith et al. 1987), whereas that of Typhimurium LT2 is 4.8 Mb (Liu and Sanderson 1992). Although these find-ings suggest that the structure of bacterial genomes is evolutionarily conserved, the range of variation in ge-nome size among natural isolates of E. coli greatly ex-ceeds that observed between E. coli K12 and Typhi-murium LT2 (Brenner et al. 1972; Bergthorsson and Ochman 1995). Genome sizes of natural isolates of E.
coli can vary by as much as 650 kb (Bergthorsson and
Ochman 1995), and among serovars of S. enterica (En-teriditis, Paratyphi, Typhi, and Typhimurium), chromo-some sizes can differ by 300 kb (Liu, Hessel, and San-derson 1993).
Despite the overall correspondence in the size and organization of the E. coli K12 and Typhimurium LT2 chromosomes, alignments of their physical and genetic maps have revealed several large regions confined to only one species. These regions—termed ‘‘chromosomal loops’’ (Riley and Krawiec 1987)—are distributed throughout the chromosome and cumulatively account Abbreviations: PFGE, pulsed-field gel electrophoresis; LEE, locus of enterocyte effacement; PCR, polymerase chain reaction; sv., serovar. Key words: chromosome size variation, Escherichia coli, genome evolution, physical mapping, pulsed field gel electrophoresis.
Address for correspondence and reprints: Howard Ochman, De-partment of Biology, University of Rochester, Rochester, New York 14627. E-mail: [email protected].
for more than 10% of the DNA in each species. Analysis of the base composition of sequenced genes from E. coli suggests that as much as 15%, or 700 kb, of the E. coli K12 genome may have been acquired by transfer from foreign sources and that perhaps 30 kb of foreign DNA is acquired every million years (Lawrence and Ochman 1997).
Although the evolution of E. coli and S. enterica has been marked by the acquisition and deletion of large regions of DNA, the chromosomes of these species re-main symmetric in the sense that approximately equal distances are maintained between the replication origin and terminus on each side of the circular chromosome. Selection to maintain chromosome symmetry is thought to preserve the order of genes by reducing rearrange-ments, and there is some support for this notion from experimental populations of E. coli in which the dele-terious effect of an inversion is related to the resulting asymmetry in the distance between the origin and ter-minus (Franc¸ois et al. 1990; Hill, Harvey, and Gray 1990; Riley and Sanderson 1990). Furthermore, in two naturally occurring isolates of S. enterica, inversions have apparently compensated for asymmetries intro-duced by large chromosomal insertions (Liu and San-derson 1995a, 1995b). Thus, it appears that patterns of change in bacterial genomes are affected by natural se-lection to maintain chromosome symmetry.
In this paper, we address several issues concerning the large degree of variation in genome size observed among naturally occurring strains of E. coli: 1. How much of the total variation in total genome size
can be attributed to chromosomal DNA? The previ-ously published estimates of genome size in natural isolates of E. coli were based on the cumulative lengths of all restriction fragments resolved on pulsed-field gels, and in that study, the assignment of length variation to particular chromosomal regions, or even to extrachromosomal elements, was impeded by the highly variable restriction fragment patterns present in natural populations.
Genome size
Within species variability
The ECOR collection
Genome size
Within species variability
Digestion of the E. coli chromosome with I-CeuI
8
Bergthorsson and Ochman
F
IG. 1.—Locations of I-CeuI recognition sites on the E. coli K12
chromosome. I-CeuI cleaves at the seven rrn genes, whose map
po-sitions are indicated. The resulting restriction fragments are designated
A through G.
Statistical Analysis
Differences in average chromosome size among
subspecific groups of E. coli were tested by a single
classification analysis of variance (Sokal and Rohlf
1981, p. 210).
Chromosome symmetry and distribution of length
variation with respect to the replication origin and
ter-minus were examined by comparing the cumulative
lengths of fragments flanking each side of the replication
origin. To eliminate nonindependence of data points due
to the common ancestry of isolates, we applied the
method of phylogenetic contrasts proposed by
Felsen-stein (1985). The analysis was performed with programs
written by Garland et al. (1993) and Martins (1996) and
applied to data extracted from the neighbor-joining tree
of the genetic relationships among strains (Herzer et al.
1990). Because the absolute values of standardized
con-trasts are inversely related to lengths of branches on the
tree, the branch lengths were log-transformed prior to
standardization and subsequent calculations (Garland,
Harvey, and Ives 1992). To test whether the correlations
were sensitive to uncertainties in the phylogenetic
rela-tionships among strains, phylogenetic contrasts were
performed on 1,000 random trees (Martins 1996) and on
an alternative tree for the ECOR collection based on
random amplified DNA sequences (Desjardins et al.
1995).
To test whether regions of the chromosome differ
in degree of variability, we compared the variances in
the lengths of different chromosomal regions based on
I-CeuI fragments. The variance in the length of a given
region is expected to increase linearly with fragment
size, assuming that the number of insertions,
duplica-tions and deleduplica-tions per fragment increases with fragment
length. Therefore, the variances in the sizes of the
I-CeuI fragments were standardized by dividing the
vari-ance of a given fragment by its average size before
sub-jecting the values to pairwise F-tests to test the equality
of variances (Sokal and Rohlf 1981, p. 185). Critical
significance values of pairwise F-tests were adjusted
with a sequentially rejective Bonferroni procedure for
multiple comparisons (Holm 1979; Rice 1989).
Copy numbers of IS elements in ECOR strains
were taken from Sawyer et al. (1987), Hall et al. (1989)
and Lawrence, Ochman and Hartl (1992), and
infor-mation on growth rates was from Mikkola and Kurland
(1991).
PCR
The chromosomes of certain strains of E. coli have
integrated large regions called pathogenicity islands.
The frequency of a 35-kb pathogenicity island—the
lo-cus of enterocyte effacement (LEE)—was assessed by
the PCR using primer sequences published in McDaniel
et al. (1995). Primers K255 and K260 flank the right
junction of the LEE (K260 is outside the locus), and
K295 and K296 flank the left junction (K295 is outside).
PCR products from reactions using the two primer pairs,
K255 and K260, and K295 and K296, denote the
pres-ence of the LEE at this site, whereas a reaction product
of 527 bp from the flanking primers (K260 and K261)
indicates that this site is not interrupted by the LEE or
any other piece of DNA. Amplification reactions were
performed for 25 cycles at 94
8C for 1 min, 508C for 1
min, and 72
8C for 1 min.
Results
Variation in Chromosome Size Among Natural
Isolates of E. coli
All 35 ECOR isolates produced seven fragments
after digestion with I-CeuI, indicating that the number
of rrn operons is conserved among strains of E. coli.
Following the convention of Liu, Hessel, and Sanderson
(1993), these fragments were designated A through G
(fig. 1). Based on the cumulative sizes of these
frag-ments for each strain, natural isolates of E. coli can
dif-fer by over 1 Mb in the lengths of their chromosomes,
with sizes ranging from 4,500 to 5,520 kb (table 1 and
fig. 2).
Differences Between Subgroups of E. coli
The phylogenetic tree of Herzer et al. (1990)
dis-plays five major subspecific groups within E. coli. We
detected significant differences in chromosome size
be-tween these subgroups of E. coli (F
5 6.8, P , 0.001).
The laboratory strain E. coli K12 has a chromosome size
of only 4.6 Mb and is most closely related to strains
from subgroup A, which contains strains with the
small-est chromosomes. Strains with the largsmall-est chromosomes
are found in subgroups B2, D, and E of the ECOR
col-lection.
Changes in Different Chromosomal Regions are
Correlated
The most striking feature of the size variation in
I-CeuI restriction fragments is that the sizes of fragments
to the left of the replication origin and those to the right
are strongly related (fig. 2). The correlation coefficient
between the cumulative size of the BC region, which
proceeds counterclockwise from the replication origin to
the terminus, and that of the DEFG region, which
pro-ceeds clockwise, is highly significant (r
5 0.83, P ,
0.001), denoting symmetry around the origin of
repli-Genome size
Within species variability
Results in kb
group strain Host..sex. Location A B C D E F G
1 A ECOR4 Human (F) Iowa 2585 707 527 90 166 38 608
2 A ECOR5 Human (F) Iowa 2940 743 515 90 128 38 699
3 A ECOR11 Human (F) Sweden 2750 824 556 90 128 38 735 4 A ECOR13 Human (F) Sweden 2485 680 515 90 128 38 639 5 A ECOR14 Human (F) Sweden 2645 735 608 90 128 38 707 6 A ECOR15 Human (F) Sweden 2690 735 575 90 138 38 639 7 A ECOR18 Celebese ape Washington 2510 699 515 90 122 38 608 8 A ECOR19 Celebese ape Washington 2480 699 527 90 122 38 639
9 A ECOR20 Steer Bali 2505 654 480 90 122 38 608
10 A ECOR21 Steer Bali 2505 654 480 90 122 38 608
11 A ECOR23 Elephant Washington 2675 807 532 90 138 38 680 12 B1 ECOR27 Giraffe Washington 2600 707 515 90 143 38 616 13 B1 ECOR28 Human (F) Iowa 2620 743 527 94 128 38 639 14 B1 ECOR29 Kangaroo rat Nevada 2610 787 527 94 138 38 639 15 B1 ECOR34 Dog Massachusetts 2500 790 515 94 138 38 680 16 B1 ECOR58 Lion Washington 2700 743 515 94 136 38 639 17 B1 ECOR68 Giraffe Washington 2745 843 532 94 138 38 807 18 B1 ECOR71 Human (F) Sweden 2650 771 547 90 138 38 654 19 B1 ECOR72 Human (F) Sweden 2635 771 532 94 138 38 680 20 B2 ECOR51 Human infant Massachusetts 2750 810 550 112 138 38 810
. . .
31 D ECOR39 Human (F) Sweden 2780 787 581 104 143 38 713 32 D ECOR40 Human (F) Sweden 2845 807 616 104 143 43 787 33 E ECOR31 Leopard Washington 2775 743 547 94 138 38 735 34 E ECOR37 Marmoset Washington 3100 787 581 94 175 38 743 35 E ECOR42 Human (M) Massachusetts 2735 743 616 94 143 38 699
Genome size
Within species variability
What is the polymorphism of E. coli genome size?
Study this yourself:
pgs <- read.table("http://pbil.univ-lyon1.fr/R/donnees/polygensize.txt", header = TRUE, sep = "\t")
head(pgs)
subgroup strain Host..sex. Location
A
B
C
D
E
F
G
1
A
ECOR4
Human (F)
Iowa 2585 707 527 90 166 38 608
2
A
ECOR5
Human (F)
Iowa 2940 743 515 90 128 38 699
3
A ECOR11
Human (F)
Sweden 2750 824 556 90 128 38 735
4
A ECOR13
Human (F)
Sweden 2485 680 515 90 128 38 639
5
A ECOR14
Human (F)
Sweden 2645 735 608 90 128 38 707
6
A ECOR15
Human (F)
Sweden 2690 735 575 90 138 38 639
What is the distribution of genome size?
Any relationship with the subgroup?
Genome size
Within species variability
Genome size is highly polymorphic in E. coli
0
1
2
3
4
5
Distribution of genome size for 35 Escherichia coli strains
Chromosome size [Mb]
Genome size
Within species variability
Genome size phylogenetic inertia
●
A
B1
B2
D
E
4.6
4.8
5.0
5.2
5.4
Genome size within 5 subgroups of Escherichia coli strains
Genome size
Within species variability
Genome size phylogenetic inertia
tcs <- rowSums(pgs[,5:11])/1000
options(show.signif.stars = FALSE)
anova(lm(tcs~pgs$subgroup))
Analysis of Variance Table
Response: tcs
Df Sum Sq
Mean Sq F value
Pr(>F)
pgs$subgroup
4 1.0756 0.268891
6.817 0.0004999
Genome size
Within species variability
The nice hidden structure
10
Bergthorsson and Ochman
F
IG
. 2.—Linear representation of I-CeuI maps for 19 natural
iso-lates of E. coli and E. coli K12. Letters A through G along the bottom
correspond to I-CeuI fragments, and the megabase scale at the top
shows chromosome lengths. Genetic relationships are inferred from
variation at 38 enzyme loci (Herzer et al. 1990). Numbers in this tree
represent ECOR strain designations, and letters represent major
sub-groups within E. coli. The shaded box depicts the range of variation
in chromosome size between E. coli K12 and the ECOR strain with
the largest chromosome.
F
IG
. 3.—Relationship between lengths of chromosomal regions
flanking the replication origin in natural isolates of E. coli. Region left
of the origin comprises I-CeuI fragments B and C, located between
56.2
9 and 84.69 on the E. coli K12 chromosome. (Although the
rep-lication origin lies within fragment C,
.90% of this fragment is
lo-cated counterclockwise to the origin.) The region right of the origin
comprises fragments D, E, F, and G, which map between 84.6
9 and
5.1
9 on the E. coli K12 chromosome (r 5 0.83, P , 0.001, df 5 33).
F
IG
. 4.—Bivariate plot of phylogenetically independent contrasts
of lengths of regions flanking the replication origin. The
neighbor-joining tree by Herzer et al. (1990) is used to remove covariation due
to common ancestry of isolates.
cation (fig. 3). The corresponding correlation between
the region surrounding the origin of replication,
frag-ments B through G, and the region flanking the terminus
represented by fragment A is much lower but still
sta-tistically significant (r
5 0.52, P , 0.01).
Because the strains used in this analysis are
phy-logenetically related, the high degree of significance in
the correlation between the lengths on either side of the
origin may be inflated due to changes in a few ancestral
strains. Using phylogenetically independent contrasts,
the association between changes on both sides of the
replication origin remains significant (fig. 2b, r
5 0.58,
P
, 0.01) (fig. 4), and the 99% confidence limits on the
distribution of correlation coefficients generated by
1,000 random phylogenetic trees do not include the zero.
The correlation between the lengths of the region that
spans the replication origin and that spanning the
ter-minus is also significant using the phylogenetic
correc-tion (r
5 0.39, P , 0.05). These correlations would not
be expected if chromosomal insertions and deletions
were independent events.
Variation Among Chromosomal Regions
With the exception of the smallest fragment (F), all
I-CeuI fragments show considerable length variation
among natural isolates of E. coli (table 1, fig. 2). For
example, I-CeuI fragment G ranges from 608 to 824 kb
in length, overlapping in size with fragments B (654 to
873 kb) and fragment C (480 to 616 kb). Therefore, the
identity of each fragment was determined by Southern
hybridizations to genes of known position on the E. coli
K12 chromosome. Probes to oriC and dif were used to
ascertain that the replication origin and terminus were
located on fragments C and A, respectively. PCR assays
of clpB, yhdZ, aroE, metA, and proS confirmed the
iden-tity and map position of the I-CeuI fragments. Although
these genes were generally recovered from the expected
fragments (based on size and Southern hybridizations),
there were a few exceptions: proS was amplified from
fragment B instead of fragment G of ECOR 57, and
Genome size
Within species variability
Genome size
Within species variability
Genome size
Within species variability