HAL Id: tel-02275792
https://tel.archives-ouvertes.fr/tel-02275792
Submitted on 2 Sep 2019
HAL is a multi-disciplinary open access
archive for the deposit and dissemination of
sci-entific research documents, whether they are
pub-lished or not. The documents may come from
teaching and research institutions in France or
abroad, or from public or private research centers.
L’archive ouverte pluridisciplinaire HAL, est
destinée au dépôt et à la diffusion de documents
scientifiques de niveau recherche, publiés ou non,
émanant des établissements d’enseignement et de
recherche français ou étrangers, des laboratoires
publics ou privés.
Direct laser writing of a new type of optical waveguides
and components in silver containing glasses
Alain Abou Khalil
To cite this version:
Alain Abou Khalil. Direct laser writing of a new type of optical waveguides and components in silver
containing glasses. Biotechnology. Université de Bordeaux; Université Laval (Québec, Canada), 2018.
English. �NNT : 2018BORD0290�. �tel-02275792�
THÈSE EN COTUTELLE PRÉSENTÉE
POUR OBTENIR LE GRADE DE
DOCTEUR DE
L’UNIVERSITÉ DE BORDEAUX
ET DE L’UNIVERSITÉ LAVAL
ÉCOLE DOCTORALE DES SCIENCES PHYSIQUES ET DE L’INGÉNIEUR
SPÉCIALITÉ : LASERS, MATIÈRE ET NANOSCIENCES
Par Alain ABOU KHALIL
Direct Laser Writing of a new type of optical waveguides
and components in silver containing glasses
Sous la direction de Réal VALLÉE
et de Lionel CANIONI
Soutenue le 28 Novembre 2018
Membres de Jury :
M. POUMELLEC, Bertrand, Directeur de recherche CNRS, Université Paris-Sud Président Rapporteur M. EATON, Shane, Chercheur Permanent à istituto di Fotonica e Nanotecnologie Rapporteur
M. MESSADDEQ, Younès, Professeur à l’Université Laval Examinateur
M. BELLEC, Mathieu, Chargé de recherche à l’Université Nice-Sophia Antipolis Examinateur
M. VALLÉE, Réal, Professeur à l’Université Laval Examinateur
M. CANIONI, Lionel, Professeur à l’Université de Bordeaux Examinateur
ii
Résumé
L'interaction laser-matière a intéressé la communauté scientifique depuis la découverte du laser dans les années 1960. La recherche et le développement au cours des dernières années ont conduit à un nombre quasiment illimité d'applications industrielles et médicales basées sur le laser. Nettoyage laser, découpe, marquage, chirurgie des yeux au laser, ablation de tumeurs cancéreuses, imagerie médicale, le laser offre un outil polyvalent et non remplaçable dans les domaines industriels et médicaux. Plus spécifiquement, l'interaction laser-verre a été largement étudiée au cours des deux dernières décennies. Le processus de focalisation des lasers femtosecondes à l'intérieur des verres, afin de modifier leurs propriétés physico-chimiques, est appelé inscription laser directe. La technique d’inscription laser directe permet une structuration tri-dimensionnelle (3D) directe et rapide du verre, rendant possible la création de composants optiques 3D intégrés dans des matériaux transparents. Cette nouvelle technique présente de nombreux avantages par rapport à la lithographie, technique traditionnellement utilisée pour la création des composants optiques. La lithographie se limite à la structuration bi-dimensionnelle (2D) des matériaux et nécessite de nombreuses étapes, ce qui rend l’inscription laser directe hautement compatible pour le transfert de procédés de fabrication industrielle. De nombreuses applications pourraient être basées sur la technique d’inscription laser directe, telles que la création de capteurs miniaturisés et/ou de composants photoniques dans des puces de verre. En effet, par exemple, la technique d’inscription laser directe dans les verres a conduit à la création de Modular Photonics, une entreprise basée en Australie qui vend des micro-puces à base de verre manufacturées par la technique d’inscription laser directe pour des applications de sélection de mode, plus spécifiquement pour des besoins astronomiques. Toutefois, il reste pertinent de mener une recherche permettant de développer la compréhension et la maitrise de nouveaux processus lors de l’interaction laser-matière, ce qui constitue le fondement de cette thèse.
Cette thèse a ainsi été réalisée grâce à une collaboration entre l'Université de Bordeaux (France) et l'Université Laval à Québec (Canada), dans le cadre du Laboratoire International Appliqué (LIA) LUMAQ (Lumière Matière Aquitaine Québec). Plus précisément, elle a été réalisée entre trois laboratoires, le Centre des lasers intenses et ses applications (CELIA) et l’Institut de chimie de la matière condensée de Bordeaux (ICMCB) de l’Université de Bordeaux et le Centre d’Optique, Photonique et Laser (COPL) à l'Université Laval, Québec, Canada. Elle consistait à consacrer près de la moitié du temps de la thèse dans chaque
université tout en travaillant sur le même projet, qui est la continuité des recherches menées dans le groupe « Short Pulse Lasers : Applications et Matériaux » (SLAM) de Lionel Canioni et le groupe « Chimie et Photonique des Matériaux Oxyde de Fluorescence », sous la direction de Thierry Cardinal à l'ICMCB. Les recherches précédentes étaient basées sur l'optimisation et la maîtrise de la synthèse des verres oxydes à base de phosphate de zinc contenant de l'argent, ainsi que sur la recherche et la compréhension des différents processus exotiques de l’interaction laser-verre après l’inscription laser directe. Ces recherches ont abouti à la création de l’entreprise « Argolight », une spin-off spécialisée dans la vente de lames de verre structurées au laser permettant l’étalonnage de fluorescence des microscopes. En outre, la NASA a utilisé un des produits d’Argolight pour équiper le microscope de fluorescence de la Station spatiale internationale pour le SpaceX SPX CRS 11 - Falcon 9.
Les travaux antérieurs du groupe sur les verres de phosphate de zinc contenant de l'argent ont permis d’une part de formuler et développer des verres innovants de qualité optique, et d’autre part d’induire par laser un riche éventail de propriétés induites par irradiation laser femtoseconde. En effet, de tels verres phosphate à l'argent sont des verres spéciaux et exotiques, en comparaison aux verres standards généralement utilisés par la communauté scientifique ou l’industrie manufacturière laser, pour réaliser l’inscription laser directe. L'incorporation d'ions d’argent à l'intérieur de la matrice de verre permet des réponses exotiques du verre après l’inscription laser directe, telles que : la création de très forts contrastes de fluorescence à partir de la synthèse de nouvelles espèces moléculaires de type agrégats ; l’exaltation localisée en 3D des propriétés optiques non linéaires de génération de troisième harmonique et aussi la création directe et pionnière de génération de second harmonique effective ; la fabrication localisée d’un milieu effectif verre/métal suite à la précipitation de nanoparticules métalliques d’argent à réponse plasmonique de surface. Dans ce contexte, ce projet de thèse ambitionne d’aller au-delà des avancées obtenues sur la création locale de propriétés optiques, en visant la création de nouvelles propriétés, et surtout le développement de fonctionnalités optiques. Ainsi, ce projet de thèse porte sur la création et la fonctionnalisation de nouveaux types de guides et composants optiques basés sur la photochimie de l’argent activée par irradiation laser. En particulier, le projet prévoit de créer de nouveaux types de guides d’ondes ainsi que des composants optiques intégrés, dont les propriétés ne sont pas accessibles à partir des verres standards.
iv
Ce manuscrit de thèse est divisé en quatre chapitres. Le premier chapitre parle du fond du verre, du laser et de l’interaction laser-verre en général tandis que le deuxième chapitre concerne plus spécifiquement l'écriture laser directe dans les verres à l'argent qui présente une réponse originale.
Elle induit la création des agrégats d'argent fluorescents Agmx+ autour du voxel
d'interaction. Leur distribution spatiale est dictée par la géométrie du faisceau laser gaussien au foyer de l’interaction. Ces espèces Agmx+ sont responsables d'un
nouveau type de changement d'indice de réfraction (∆n) compatible avec les applications de guidage optique. Ce nouveau type de ∆n diffère totalement du type
I bien connu. En effet, il prend son origine dans la création d’agrégats d'argent
photo-induits autour du voxel d'interaction. Ce type de ∆n, basé sur de nouvelles espèces chimiques, implique de nouvelles liaisons chimiques avec des nuages d'électrons plus polarisables que ceux des ions argent, Ag+, initiallement présents
dans le verre, ce qui donne accès à un changement d’indice de réfraction local permanent, indépendamment de toute modification de la matrice de verre elle-même, c'est-à-dire une modification extrinsèque à la matrice vitreuse. Le ∆n photo-induit augmente en fonction des paramètres d’irradiation et atteint une valeur maximale d’environ 8x10⁻³. Des guides d'ondes multimodes et monomodes ont été
créés à l'intérieur des verres à l'argent. Les guides multimode (MM) et monomodes (SM) ont été réalisés à partir de la photochimie induite de l’argent : un guide d'onde multimode (MM) dans les longueurs d'onde visible et infrarouge présentait des dimensions transverses typiques de ~415 µm2 avec un ∆n = 4.510-3 ; un
guide d'onde monomode (SM) à la longueur d’onde 𝜆 = 630 nm présentait des dimensions de 36 µm2, ∆n = 2.5x10⁻³ et des pertes de propagation dont la borne
supérieure a été estimée à plus 1.2 dB/cm. Le profil de mode de guide d'onde SM est un mode guidé par chacun des deux plans des agrégats d'argent agissant comme un supermode. La simulation des profils de mode, conjointement à des études de microscopie corrélative, nous a permis de montrer une correspondance significative avec les modes expérimentaux d’une part, et d’autre part de confirmer que le ∆n est vraiment basé sur la création des agrégats d’argent dans les verres d’argent. Après cela, un séparateur 50%-50% de faisceau de géométrie Y et un coupleur 50%-50% ont été écrits pour une longueur d’onde 𝜆= 630nm, ouvrant la porte à la réalisation de composants optiques 3D intégrés et de circuits photoniques intégrés. Finalement, le processus de guidage d'onde a été démontré dans des fibres en forme de ruban contenant de l'argent en inscrivant un guide d'onde de 1,4 cm de long. Ces résultats offrent des opportunités uniques pour des applications telles que la détection fibrée, le filtrage, et/ou la photonique totalement intégrée.
Le troisième chapitre concerne une étude comparative entre le type I et le nouveau
type A dans les verres contenant de l’argent.
En effet, l'inscription laser directe d’un changement d’indice de type I a été également réalisée, à la fois dans un verre au phosphate de zinc à l'argent et sans argent. Un ∆n négatif de type I peut être observé pour le verre contenant de l'argent, par rapport à un ∆n également de type I toujours positif dans un verre ne contenant pas d'argent, ce qui est probablement lié à la différence du rapport O/P dans la formulation de ces deux verres, ce qui a été déjà signalé par d'autres groupes de recherche. En revanche, dans les verres contenant de l’argent, en modifiant les paramètres et le régime du laser, il est possible de déclencher de façon sélective deux types de modifications différents, soit le type A, soit le type I. La modification d’indice de type I se produit dans le régime thermique avec une fluence laser élevée en utilisant un laser à taux de répétition de 250 kHz comparé à un régime athermique pour une modification de type A utilisant une faible fluence laser avec un laser à haut taux de répétition (9.8 MHz). Une comparaison de morphologie entre deux guides d'onde monomodes associé à chaque type montre la présence d’une grande zone affectée thermiquement pour une modification de type I et l’absence d’une telle zone pour le type A. Les dimensions globales des guides d'onde sont respectivement de 24 µm 38 µm et 3 µm 6 µm. Cependant, les dimensions des profils de mode guidés sont similaires pour les deux types. En effet, dans le cas du type I, la zone de guidage est d'environ 4 µm x 5 µm et présente un profil de mode circulaire (dû à l’utilisation des lentilles cylindriques dans but d’avoir un profil circulaire du faisceau laser) comparé à un modèle elliptique pour le type A (3 µm 5.5µm). De plus, le ∆n de type I peut passer de positif à négatif en fonction des paramètres d’irradiation, tandis que la modification du type A est toujours positive. Ainsi, nous introduisons un nouveau type de modification/changement d’indice de réfraction que nous appelons type A (inspiré du nom latin de l’argent, Argentum). Ce nouveau type est basé sur la création des agrégats d’argent qui prend lieu dans le régime de faible énergie d’impulsion, bien avant le régime de modification de type I. Ce nouveau type présente de nombreux avantages par rapport au type I qui sont rapportés dans ce travail : un ∆n toujours positif pour différents paramètres laser, de plus petites dimensions, ainsi que la capacité unique d’écrire directement des guides d’onde rasants à la surface du verre, ceci en prenant avantage du régime énergétique à faible impulsion pour le type A. De tels guides de surface en type A sont donc prometteurs pour de futures applications de détection et la réalisation de capteurs.
vi
Le quatrième chapitre présente un des avantages des guides de type A qui est l’inscription des guides d’ondes proche de la surface ainsi que la création d’un capteur d’indice de réfraction pionnière.
En prenant avantage du régime énergétique à faible impulsion pour créer le type A par rapport au type I, des guides d'ondes rasants à proximité de la surface ont été écrits dans un verre de phosphate de zinc à l’argent sans processus supplémentaires, ce qui constitue une première. Aucune attaque chimique, ni utilisation d’un verre renforcé, ni méthode de compensation ne sont nécessaires pour obtenir des guides d'ondes de type A proches de la surface en vue d’applications de détection. Non seulement des guides d'onde proches de la surface sont réalisables avec les guides d'ondes de type A, mais une écriture directe sur la surface du verre est également possible. Sur la base des guides d'ondes très proches de la surface (typiquement à 1 µm), un capteur d’indice de réfraction a été créé dans un bloc de verre de 1 cm. Ceci a permis de montrer pour la première fois, avec un guide intégré dans un échantillon monolithique, l’existence de deux résonances en terme d’énergie transportée dans le guide, donnant ainsi accès à une double zone de détection d’indice de réfraction du milieu environnant le verre, l’une pour des indices inférieurs à l’indice effectif du guide d'ondes et l’autre pour des indices égaux ou supérieurs. Une augmentation de 50% de la transmission et une diminution de 66% ont été observées, pour une gouttelette d'huile de 4 mm ayant un indice de 1.602 et 1.604 respectivement autour de l’indice du guide. Pour les guides d'ondes plus loin de la surface, une seule résonance est observée, correspondant à la chute de transmission lorsque l’indice de l'huile est égal ou légèrement supérieur à l’indice du guide d'ondes. Pour expliquer cette nouvelle phénoménologie de capteurs d’indice, un nouveau modèle théorique est proposé prenant en compte la forme du mode guidé, sa distance à la surface et le couplage évanescent entre le verre et le milieu extérieur, ainsi que le coefficient de réflexion de Fresnel. Ainsi, le nouveau modèle développé est le premier modèle à simuler l’augmentation de la transmission avant l’indice du guide d’onde. Enfin, un capteur d’indice de réfraction très sensible dans la gamme de 1→1.632 présentant une chute de transmission de 80% (7dB) pour une longueur d'interaction de 5 mm est fabriqué dans un bloc de verre de 1 cm contenant de l'argent. Ces résultats sont prometteurs pour toute application de détection de surface à partir de verres à l'argent dont l’indice de réfraction peut dès lors être ajusté en amont, en vue de la gamme réfractive visée.
viii
Abstract
Direct Laser Writing (DLW) has been an exponentially growing research field during the last two decades, by providing an efficient and robust way to directly fabricate three dimensional (3D) structures in transparent materials such as glasses using femtosecond laser pulses. It exhibits many advantages over the lithography technique, which is mostly limited to two dimensional (2D) structuring and involves many fabrication steps. This competitive aspect makes the DLW technique suitable for future technological transfer to advanced industrial manufacturing. Generally, DLW in glasses induces physical changes such as permanent local refractive index modifications that have been classified under three distinct types: (Type I, Type II & Type III). In silver containing glasses with embedded silver ions Ag+, DLW induces the creation of fluorescent silver clusters Agmx+ at the vicinity of the interaction voxel. In this work, we present a new type of refractive index change, called type A occurring in the low pulse energy regime that is based on the creation of the photo-induced silver clusters allowing the creation of new linear and nonlinear optical waveguides in silver containing glasses. Various waveguides, a 50-50 Y beam splitter, as well as optical couplers, were written based on type A modification inside bulk glasses and further characterized. In addition, a comparitive study between type A and type I waveguides is presented, showing that finely tuning the laser parameters allows the creation of either type A or type I modifications inside silver containing glasses. Finally, based on type A near-surface waveguides, a highly sensitive refractive index sensor is created in a 1 cm glass chip, which could exhibit a pioneer demonstration of double sensing refractive ranges. The waveguiding properties observed and reported in the bulk of such silver containing glasses were transposed to ribbon shaped fibers of the same material. Those results pave the way towards the fabrication of 3D integrated circuits and fiber sensors with original fluorescent, nonlinear and plasmonic properties that are not accessible using the standard type I modification.
x
Table of contents
Résumé ... ii
Abstract ... viii
Table of contents ... x
List of tables ... xii
List of figures ... xiv
List of Abbreviations ... xliv Acknowledgment ... xlvi General Introduction ... 1
Chapter I General background on glass and laser-matter interaction ... 7
I.1. Introduction ... 7
I.2. Glass ... 8
I.2.1. Glass history ... 8
I.2.2. Definition of glass ... 8
I.2.3. Glass formation ...12
I.2.4. Glass making ...15
I.2.5. Introduction to fiber optics ...16
I.3. The laser ... 17
I.3.1. Definition of laser ...18
I.3.2. Gaussian beam ...21
I.3.3. Laser-material interaction ...24
I.3.4. Effects of laser parameters ...29
I.4. Conclusion ... 36
Chapter II Direct laser writing of a new type of waveguide in silver containing glasses ... 39
II.1. Introduction ... 39
II.2. Principle of DLW and ∆n classification ... 40
II.2.1. Type I modification origins ...42
II.3. State of the art: ... 43
II.3.1. Waveguides ...43
II.3.2. Depressed cladding waveguides ...49
II.3.3. Couplers: ...51
II.3.4. Beam splitters ...56
II.3.5. Waveguide Bragg grating (WBG) ...57
II.3.6. Waveguide lasers ...59
II.3.7. Photonic lantern ...60
II.3.8. Study of phosphate glasses ...61
II.4. Silver containing zinc phosphate glasses ... 63
II.4.1. Optical properties ...64
II.4.2. Laser-silver containing glasses interaction ...66
II.4.3. Writing window in silver containing glasses ...71
II.4.4. Review of previous works on silver containing glasses ...72
II.5. Experimental setup: Glass and laser used ... 74
II.5.1. Glass synthesis and fiber drawing ...74
II.5.2. Silver containing zinc phosphate glass fibers ...75
II.5.3. Laser setup: ...79
II.5.4. Mode profile setup: ...80
II.5.5. Confocal Microscope: ...81
II.6. Results ... 84
II.6.1. Structures’ morphology ...84
II.6.2. ∆n vs laser parameters ...86
II.6.3. Waveguiding ...95
II.6.4. Optical components ... 110
II.6.5. Waveguides in Ribbon Fibers ... 115
II.7. Conclusion ... 118
Chapter III Comparative study between the type A and the type I refractive index changes ... 122
III.1. Introduction ... 122
III.2. Type I modification in phosphate – zinc phosphate glasses ... 124
III.3. Experimental methods ... 124
III.3.1. Glasses ... 124
III.3.2. Laser setup ... 125
III.4. Results ... 126
III.4.1. Type I modification in silver containing and non-containing zinc phosphate glasses ... 126
III.4.2. Structure morphology ... 133
III.4.3. Refractive index and mode profiles ... 135
III.4.4. Flipping ∆n ... 138
III.4.5. Advantages of type A ... 144
III.5. Conclusion ... 146
Chapter IV Direct laser writing of rising near-surface waveguides in silver containing glasses with no additional processing ... 150
IV.1. Introduction ... 150
IV.2. Evanescent wave theory ... 152
IV.3. Evanescent wave based sensors ... 154
IV.3.1. Refractive index sensors ... 155
IV.4. Experimental methods ... 166
IV.4.1. Glass ... 166
IV.4.2. Laser setup ... 166
IV.5. Results ... 167
IV.5.1. Writing near surface waveguides ... 167
IV.5.2. RI sensor ... 176 IV.6. Conclusion ... 182 General Conclusion ... 184 Perspectives ... 186 Appendix ... 192 References ... 202
xii
List of tables
Table II-1: Table summarizing the theoretical molar composition and the properties of the different zinc phosphate glasses used in this work. Taken from [135]. --- 63 Table II-2: Different silver (Ag) species identified following DLW in silver containing glasses as reported in [139]. --- 67 Table III-1: Table summarizing the different laser parameters for both lasers used in this chapter. --- 126 Table III-2: Table summarizing the comparison between type I and type A modification --- 145
xiv
List of figures
Figure I.1: The atomic arrangement of a A2O3 lattice of a (a) crystal (b) glass. The
crystal exhibits atomic order compared to the disorder exhibited by the glass compound [5]. ... 9
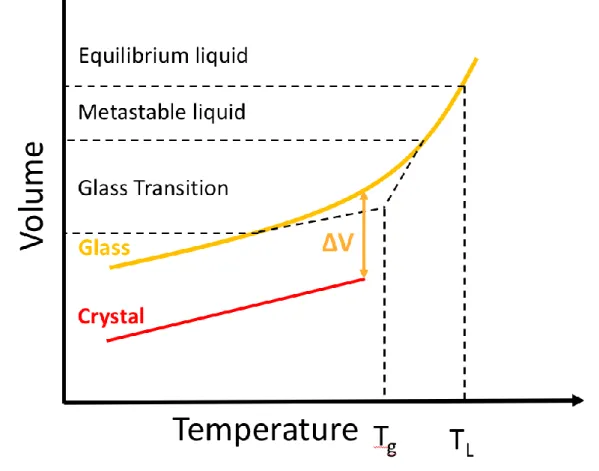
Figure I.2: Volume variation as a function of the temperature while cooling a liquid to form a crystal or a glass. Adapted from [1]. ...10
Figure I.3 The configurational entropy as a function of the temperature of the cooling process of an equilibrium liquid. The glass transition freezes the entropy and avoids a thermodynamic catastrophe. This is known as the Kauzmann paradox. Taken from [1] ...11
Figure I.4 Possible Differential Scanning Calorimetry (DSC) curve of a cooled liquid. Tg is the glass transition temperature, Tx the temperature of formation of the first crystal, and Tc the crystallisation temperature. The DSC curve taken from [11]. ..12
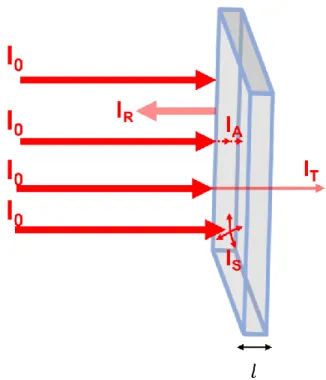
Figure I.5 : Schematic presentation of an incident light on a glass sample. Io is the
incident light, IR the reflected light, IA the light absorbed, IT the transmitted light
and IS the scattered light. ...14
Figure I.6:Absorption spectrum of a Silica glass in the visible and near infrared region. A high transmission is shown in the visible range. ...15
Figure I.7: Schematic representation of the melting-quenching process...16
Figure I.8: Schematic presentation of a cylindrical optic fiber with inner core and outer cladding ...17
xvi
Figure I.10: Schematic presentation of a laser beam (input beam) amplified using an external amplifier. Taken from [29]. ...20
Figure I.11: Intensity profile distribution of a Gaussian beam as function of r. ...22
Figure I.12: Schematic presentation of a propagating Gaussian beam. ...23
Figure I.13: Schematic presentation of the multi-photon absorption process. In this case, an electron in the valence band absorbs 3 photons to pass to the conduction band. ...24
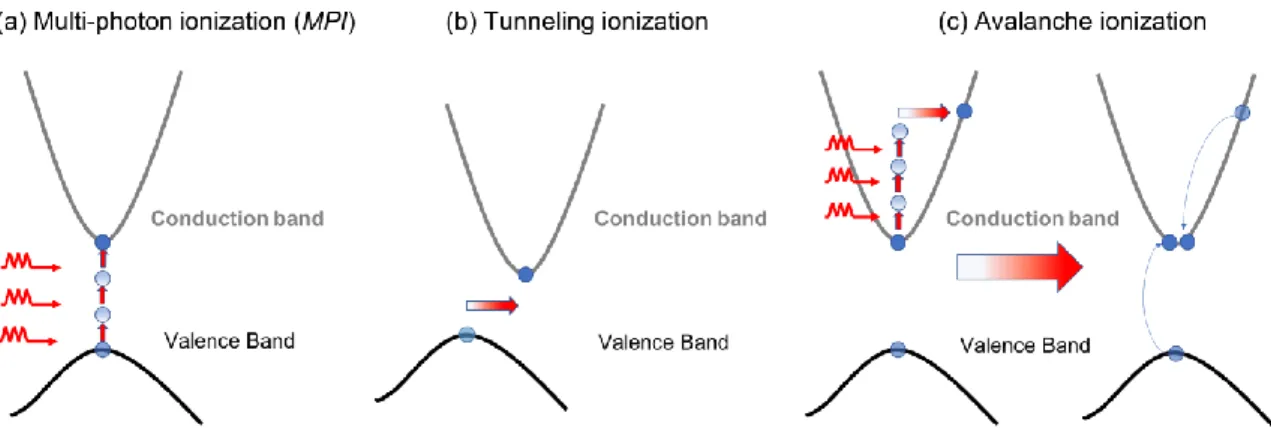
Figure I.14: Schematic presentation of the photo-ionization processes during laser-glass interaction. (a) Multi-photon ionization (MPI): An electron absorbs two or more photons to be promoted in the conduction band (b) Tunneling ionization where the electron passes through a barrier to be promoted the conduction band (c) Avalanche ionization where an electron in the conduction band absorbs two or more photons, then collides and promotes an electron from valence band to the conduction band. Inspired from [34, 35]. ...25
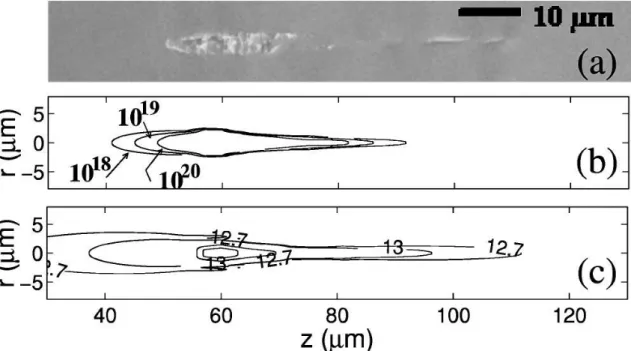
Figure I.15: (a) Scanning electron microscopy image of a track damage obtained by focusing femtosecond pulses inside fused silica (b) Numerical simulation electron density (c) Computed intensity counterplots. The comparison between experiment and simulations shows a good match of the morphology. Figure taken from [43]. .27
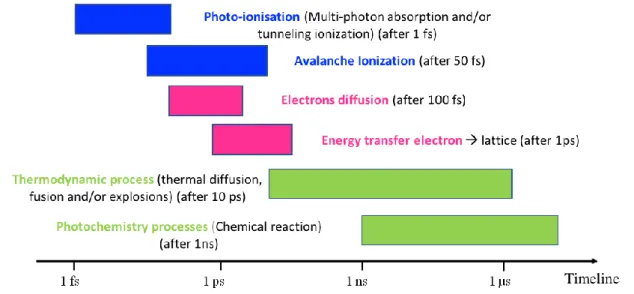
Figure I.16: Timeline of physical phenomena involved during laser-matter interaction. Inspired from [33]. ...28
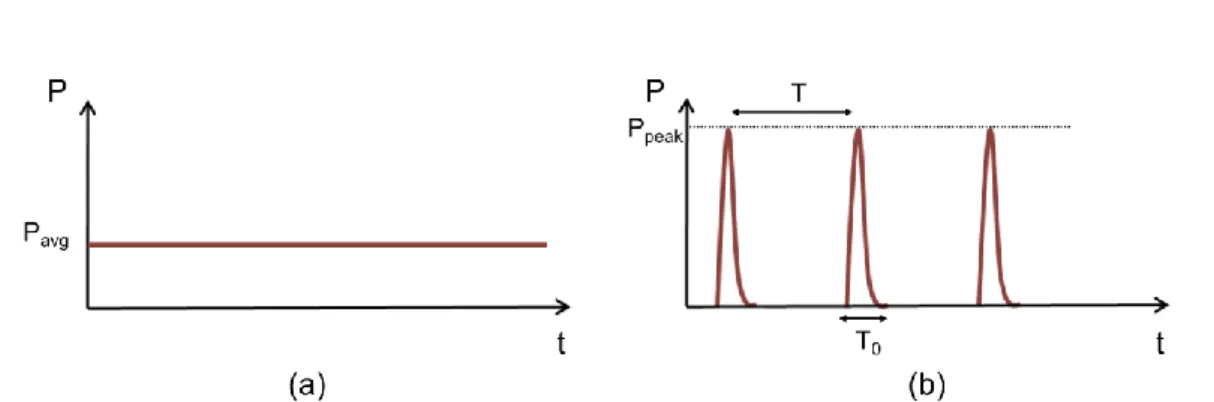
Figure I.17: Schematic presentation of the temporal evolution of the power of a (a) continuous laser (b) pulsed laser. ...30
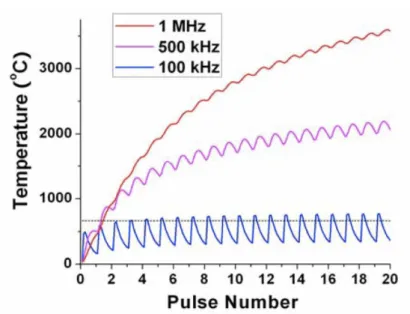
Figure I.18: Numerical simulations of the heat accumulation process inside glass following laser irradiation for different repetition rates, 100kHz, 500kHz and 1MHz. A heat accumulation process starts taking place at the 500kHz repetition rate [48]. ...32
xviii
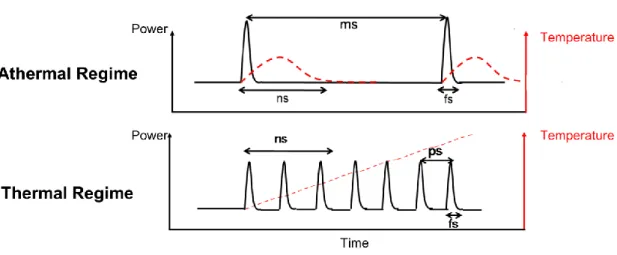
Figure I.19: Comparison between athermal and thermal regimes. For the athermal regime, low repetition rate laser, the pulses are well spaced in time so that the temperature does not have time to build up in the material. However for the thermal regime, high repetition rate laser, the pulses are close in time and the temperature builds ups. ...33
Figure I.20: Modification threshold dependence as a function of the numerical aperture of the microscope objective used in borosilicate glass [54]. ...35
Figure II.1: Schematic presentation of the Direct Laser Writing (DLW) process. ....40
Figure II.2: Map of the modification thresholds in fused silica for the four regions/three types of modification as a function of the pulse energy and the numerical aperture. Adapted from [64]. ...41
Figure II.3: The refractive index changes/modification classified as function of the irradiance. Pictures for every type of modification, waveguides, nanogratings and voids. ...42
Figure II.4: Schematic of guided and unguided rays in a planar dielectric waveguide. The rays exhibiting a propagation angle 𝜃 lower than 𝑐 = 𝑐𝑜𝑠 − 1(𝑛2𝑛1) are only guided. Taken from [99]. ...45
Figure II.5: Graphical solution of (II-2) to determine propagation angles 𝜃 of the mode of a planar dielectric waveguide. (a)The right side (RHS) and left side (LHS) of the equation are plotted as a function of sin𝜃. The intersection points marked by filled circles determines the propagation angles 𝜃. On the other hand, each intersection of the tan function (LHS) corresponds to a mode. In this example, the waveguide can support up to 9 modes. Taken from [99]. (b) RHS (orange dashed line) and LHS (black full line) of (II-2) is plotted for a planar waveguide exhibiting a single mode aspect with ∆n=2x10⁻³, dimensions of 5µm at a wavelength of 630nm.
...47
Figure II.6: Schematic presentation of the way light rays propagate inside a multimode step-index optical fiber. Taken from [99]. ...48
xx
Figure II.7: The acceptance angle 𝜃a of an optical fiber. The rays within the acceptance cone are guided inside the fiber by total internal reflection. The numerical aperture is given by: NA=sin𝜃𝑎. Taken from [99]. ...49
Figure II.8: (a) Top View phase contrast image of a type I waveguide written in silver containing zinc phosphate glass under white light illumination (b) Optical Path Difference (OPD) profile associated to the waveguide. A negative OPD is observed. ...50
Figure II.9: Tranverse view of a depressed cladding waveguide (DCW) (a) composed of 54 DCW distributed over 2 rings (b) composed of 212 DCW distributed over 4 rings. Taken from [101] ...51
Figure II.10: Schematic presentation of two close waveguides interacting along a distance “L” and separated by a distance “d”. The power is coupled between them. ...52
Figure II.11: Horizontal (squares) and Vertical (triangles) polarization transmission of laser written directional couplers as a function of the interaction length. First, the effect of the polarization is so slight, however when increasing the interaction distance, a bigger shift occurs indicating that the coupling effect could be altered based on the injected light polarization. Taken from [108]. ...54
Figure II.12: Schematic presentation of the first demonstration of a directional coupler presented by Strelstov et al [109]. ...55
Figure II.13: Schematic presentation of a 50-50 directional coupler. The light is injected in one branch and 50% of the power is coupled into the other branch. Taken from [110]. ...55
Figure II.14: (a) Schematic presentation of the 3D coupler (b) Mode profiles of the output indicating that the light is coupled in the three branches with a ratio of 43%:28%:29%. Taken from [111]. ...56
Figure II.15: (a) Schematic design of the 1 to 8 beam splitter with 7-Y junctions (b) Side view output of the far-field modes [113] ...57
Figure II.16: (a) Schematic presentation of the laser writing of the 1x3 beam splitter (b) Side view output visualization of the divided modes [114]. ...57
xxii
Figure II.17: Schematic presentation of the PointbyPoint (PbP) process of writing a Waveguide Bragg Grating (WBG) as well as a bright field image of the top view of the WBG. Taken from [101] ...58
Figure II.18: (a) Top view of the Waveguide Bragg Grating (WBG). The waveguide is indicated by the black lines (b) Reflection spectrum of the written WBG (upper curve) compared to the transmission of a normal waveguide (lower curve). Taken from [115]...59
Figure II.19: Sketch of a photonic lantern (PL) starting by a multimode rectangular waveguide separating into several single mode waveguides. Taken from [125]. ...60
Figure II.20: Side view bright field photos of the (a) 4x4 single mode waveguides (b) rectangular multimode waveguide. Output mode images of (c) the 4x4 single mode waveguides following the injection in the rectangular multimode waveguide (d) rectangular waveguide mode following the injection of light in the 4x4 single mode array waveguides. Taken from [125]. ...61 Figure II.21: Absorption coefficient as a function of the wavelength for zinc phosphate glass and silver containing zinc phosphate glasses with different silver concentrations. The silver containing glasses exhibit a higher absorption band and are shifted to higher wavelengths compared to non-containing zinc phosphate glass. Adapted from [11]. ...65
Figure II.22: Absorption as a function of the wavelength for the PZnAg2 sample from UV to IR. A good transparency window is observed between 380 nm and 2700 nm. ...65
Figure II.23: Schematic presentation of the formation of silver clusters in silver containing glasses following laser irradiation. ...66
Figure II.24: Absorption (black) of the photo-induced silver clusters following laser irradiation exhibiting two main absorption bands around 290 and 345 nm. Fluorescence emission (orange) under blue light excitation at 405 nm. ...67
Figure II.25: (a) Sketch of the morphology of the structures following static direct laser writing (DLW) (b) confocal fluorescence images under UV excitation (exc=405nm) of top view (xy) plane, ring shape (c) side view (xz) plane, two
fluorescent lines in a pipe shape [136]. Schematic presentation of the writing process for (d) top view (xy) plane, photodissociation of the clusters in the middle (e) side view (xz) plane. ...68
Figure II.26: Scheme of the formation of silver clusters during laser-glass interaction in silver containing glasses. Taken from [140]. ...70
xxiv
Figure II.27: (a) Fluorescence pattern of a written line under 405 nm excitation; (b) four-line of electric field induced second harmonic generation (EFISHG) under 1030 nm femtosecond laser excitation (c) superposition of the fluorescence and EFISHG correlated patterns under 405 nm and 1030 nm excitation. Taken from [143]...71
Figure II.28: Fluorescence intensity as a function of the laser irradiance and number of pulses for different laser repetition rates (a) 10MHz (b) 1MHz (c) 100kHz (d) 10kHz. Taken from [11]. ...72
Figure II.29: Top view under white light illumination for different lines written using a 250 kHz laser emitting at 1030 nm with a fixed pulse energy of 0.26 µJ for three different speeds from the left to the right: 10 mm/s-5 mm/s-1 mm/s. To be compared with figure 4 in [148]. ...74
Figure II.30: Zinc phosphate glass under UV excitation (a) non-containing (PZG-4N) and silver containing (PZG-2N2A) preforms. PZG-2N2A only exhibiting fluorescence emission; (b) fibers and a leftover of a preform. Taken from [149]. .76
Figure II.31: Comparison between bulk glass and fiber fluorescence emission properties (exc=245nm). A good match is found indicating that the drawing process
preserved the glass properties. Taken from [149]. ...77
Figure II.32: (a) Thermal drawing of ribbon fibers. Preform, bottom-neck preform and drawn fibers under UV excitation (exc=245nm). (b) Sketch, longitudinal and
side view of the drawn ribbon fiber. A flat surface with a rectangular side view is obtained. Taken from [149]. ...78
Figure II.33: Top view of the ribbon fiber (a) under white illumination before DLW (b) under UV excitation (exc=405 nm) following DLW. The fluorescence of the
written structures could be observed. (b) Fluorescence intensity broad band emission of the structures under UV excitation (exc=405 nm). (c) Fluorescence of
the written cartography and the corresponding differential transmission spectra. A higher absorption band is observed for a higher laser irradiance. Taken from [149]. ...79
xxvi
Figure II.35: Sketch of the SID4Bio wavefront sensor working principle. The incident beam is diffracted by the modified Hartmann Mask into four replicas making an interferogram on the sensor (CCD Camera) [155]. ...82
Figure II.36: Sketch of the light delayed by a refractive index object (n2) with a specific thickness “e” different than the surrounding medium (n1) leading to the construction of the phase image. The optical thickness i.e. optical path difference could be obtained [155]. ...82
Figure II.37: The SID4Bio installed on a transmission microscope. The light is diffracted by the grating creating the interferogram on the CCD camera giving an output of an intensity and phase image [155]. ...83
Figure II.38: (a) Schematic of the morphology of the structures following perpendicular translation to the laser beam propagation inside silver containing zinc phosphate glasses. Fluorescence confocal images of the (b.i) top view (xy) plane, and (c.i) side view (xz) plane. Schematic presentation of the writing process with (b.ii) top view and (c.ii) side view. ...85
Figure II.39: (a) Fluorescence image (ex=480nm, em=550nm) of the written
cartography. Writing irradiances are presented along the vertical axis while the number of pulses appears along the horizontal axis (b) Blowup of the phase image under white light illumination of the B2 structure (c) positive refractive index change (∆n) determined from the phase image of B2. ...87
Figure II.40: (a) Phase image under white light illumination showing one line of phase shift; (b) Line profile obtained from the phase image revealing only one positive peak of optical path different in that case for the structures instead of two peaks; (c) left column: experimental silver cluster spatial distribution for a progressive scale of irradiances; right column: simulated distribution of the silver clusters. For (i) and (v) low laser irradiance is used and a full disk of fluorescence is observed, which is not the case for higher irradiances. Taken from [140] ...88
Figure II.41: Refractive index change variation (∆n) as a function of the number of pulses and laser irradiance. ∆n increases as a function of the laser parameters. Laser repetition rate 9.8 MHz. ...89
Figure II.42: Variation of the length of the structure along z as a function of the laser parameters, laser irradiance and writing speed. The dimensions increase as a function of the laser irradiance. Laser repetition rate 9.8 MHz. The shades correspond to the standard deviation of the values. ...90
xxviii
Figure II.43: Top view phase image of different lines separated by 1 µm in the z plane. The seventh line becomes blurry indicating that the optical system is limited to around 6 µm in depth. ...91
Figure II.44: Refractive index change (∆n) as a function of the number of pulses for two methods: (orange) using the compensation method (black) fixed method where the depth of the structure higher than 6 µm is considered as 6 µm. Both methods converge more or less to the same values. The black shades correspond to the standard deviation of the values. ...92
Figure II.45: (a) High Resolution Scanning Electron Microscopy (HRSEM) image of the top view of a ring shape structure formed by silver clusters; (b) Line profile extracted from the HRSEM photo indicating a bump on the edges; (c) Atomic Force Microscopy (AFM) profile indicating no bumps on the sides. The bumps observed in the HRSEM are due to a change in the chemical composition and not to topological changes. Taken from [136]. ...93
Figure II.46: (a) fluorescence; (b) HRSEM, top view of the photo-induced structures. The fluorescence spatial distribution is correlated to the HRSEM indicating that the silver clusters are responsible for the change in the chemical composition. The scale bar is 1 µm. Taken from [136]. ...94
Figure II.47:(a) Silver clusters differential absorption spectrum as a function of the wavelength showing two main absorption bands near 290 nm and 350 nm; (b) Refractive index change (∆n) determined from the spectrum shown in (a) based on a Kramers-Kronig analysis, considering the filling factor of the silver clusters’ spatial distribution. DLW parameters: 7TW/cm2 – 40 µm/s. ...95
Figure II.48: (a) Schematic of the direct laser writing process and the laser injection; (b) Picture of the bulk sample under UV excitation (ex=405nm)
highlighting the fluorescence of the waveguide (indicated by the white arrow); (c) fluorescence image of the side view of the waveguide under UV excitation (ex=405nm); (d) near-field guided mode profile following laser injection [149]. ..96
Figure II.49: Cross section view of fluorescence under UV side-excitation (exc=405nm) of (a) WG1, (e) WG2. Superimposed near field mode profile and
fluorescence features for (b) WG1, (f) WG2. Near field mode profile for a high order propagating mode of (c) WG1, (g) WG2. Simulated mode profile using LUMERICAL for (d) WG1, (h) WG2. DLW parameters for WG1: 8 TW/cm2 – 10µm/s. For WG2:
8TW/cm2 – 20µm/s. ...98
Figure II.50: Near field mode profile following laser injection at 1.55 µm (a) fundamental mode, (b) higher order mode. The waveguide presented a multimode aspect. DLW parameters: 8TW/cm2 – 10 µm/s. ...99
xxx
Figure II.51: (a) Fluorescence confocal image of the side view of the waveguide. (b) Normalized horizontal fluorescence profile averaged along the y axis. (c) Normalized vertical fluorescence profile averaged along the z axis. ... 100
Figure II.52: (a) Phase image of the top view of the waveguide under white illumination (b) Refractive index change (∆n) profile obtained from the phase image. DLW paramters: 9TW/cm2 – 60 µm/s. ... 101
Figure II.53: Refractive index change (∆n) profile for different laser passages for an irradiance of 7 TW/cm2 and a speed of writing of (a) 50 µm/s, (b) 30 µm/s, (c)
20 µm/s. A negative ∆n dip appears for lower writing speeds and for many laser passages. ... 102
Figure II.54: Superposition of the silver cluster fluorescence spatial distribution (black), normalized topology after chemical etching (red) and silver ions concentration distribution (blue). Taken from [141]. ... 103
Figure II.55: The variation of the refractive index of the non-containing and silver containing zinc phosphate glasses as function of the silver concentration incorporated in the glass matrix. The higher the concentration of silver the higher the refractive index of the glass is (from bottom to top). Data from [135]. ... 104
Figure II.56: (a) Experimental: (a.i) Near field mode profile after injecting a 630 nm laser, (a.ii) normalized horizontal mode profile intensity averaged along the z axis, and (a.iii) normalized vertical mode profile intensity averaged along the y axis. (b) Simulations: (b.i) simulated mode profile (to compare with Figure II.56.a.i), (b.ii) normalized horizontal intensity mode profile averaged along the z axis (to compare with Figure II.56.a.ii), and (b.iii) normalized vertical mode profile intensity averaged along the y axis. ... 105
Figure II.57: Schematic model of the simulated waveguides using Lumerical Mode solutions software. The waveguides are simulated as two parallel ellipsoids with thickness “e”, with a length “z” and separated by a distance “d”. The color scale corresponds to the refractive index change. In this case, the glass refractive index change is 1.6 while the waveguide is 1.608 corresponding to a refractive index change (∆n) of 8x10⁻³. ... 106
xxxii
Figure II.58: Spatial superposition of the measured refractive index profile (∆n) (black), simulated near-field mode profile (blue) and experimental near-field mode profile (red). A good match is observed between the simulated and experimental modes and the ∆n distribution... 107
Figure II.59: Variation of the minimum ∆n required to trigger the multimode aspect as a function of the thickness of the structures. Blue vertical line indicates the thickness measured by confocal microscope and used during simulations (~500nm) while the red line indicates the HRSEM measurement (~100nm) performed earlier in our group [139]. ... 108
Figure II.60: Fundamental near-field mode profile of a (a) multimode (MM) waveguide, (b) single mode (SM) waveguide. (c) Near-field mode profiles of the MM and SM waveguides. DLW parameters for SM: 9TW/cm2 – 60µm/s, for MM:
10.5TW/cm2 – 20µm/s. ... 110
Figure II.61: (a) Sketch of the Y-beam splitter dividing the input light into two equal outputs (top view), (b) top view fluorescence image of the Y-junction (ex=480nm, em=550nm), (c) output modes of the beam splitter (d) normalized
intensity profile of the output modes indicating an almost equal splitting of light between both outputs. DLW parameters: 9TW/cm2 – 60µm/s. ... 111
Figure II.62: Sketch of the S-bend ... 112
Figure II.63: Normalized transmission of the S-bend waveguides as a function of the radius curvature Rc and the separation distance ∆h. Reversed injection data
corresponds to backward injection in the S-bend waveguides. DLW parameters: 9.3TW/cm2 – 40µm/s. ... 113
Figure II.64: Sketch of the coupler consisting of straight and S-bend waveguides. ... 113
Figure II.65: Simulated and experimental normalized coupled power as a function of the separation distance between the two waveguides. DLW parameters: 9.3TW/cm2 – 40µm/s ... 114
Figure II.66: (a) Near-field mode profiles of the output of the coupler; (b) normalized intensity of the mode profiles indicating the creation of a 50-50 coupler. DLW parameters: 10.8 TW/cm2 – 40µm/s. ... 115
xxxiv
Figure II.67: (a) Cross-section view of the ribbon fiber with the guided mode in the middle; (b) blowup of the near-field mode profile; (c) horizontal mode profile; (d) vertical mode profile. The mode profile is similar to the mode profile in bulk glasses as shown in Figure II.56. DLW parameters: 10TW/cm2 – 25µm/s. ... 116
Figure III.1: Schematic presentation of the laser setup used for writing type I waveguides. ... 126
Figure III.2: Optical Path Difference (OPD) of the waveguide written in (orange) silver containing zinc phosphate glass (PZnAg2) and (black) non-containing silver zinc phosphate glass (PZn). ... 127
Figure III.3: Various optical path difference (OPD) profiles as a function of (a) writing speed (b) pulse energy. The ∆n flips from negative to positive when increasing the pulse energy or decreasing the writing speed. ... 129
Figure III.4:Optical path difference (OPD) profiles of type I modification in non-containing silver zinc phosphate glass as a function of the laser parameters. The ∆n is always positive. ... 131
Figure III.5: Optical Path Difference (OPD) of the waveguide written in the same conditions (Ep=1µJ - v=1mm/s) in (orange) silver containing zinc phosphate glass
(PZnAg2) and (black) non-containing silver zinc phosphate glass (PZn). ... 133
Figure III.6: Top view white light illumination (a.i) for type I waveguide, (b.i) for typical type A waveguide. Top view fluorescence (a.ii) for type I waveguide, (b.ii) for typical type A waveguide. Side view white light illumination (a.iii) for type I waveguide, (b.iii) for typical type A waveguide. Side view fluorescence image of (a.iv) for type I waveguide, (b.iv) for typical type A waveguide. ... 135
xxxvi
Figure III.7 Top view phase image of (a.i) type I waveguide, (b.i) type A waveguide. Refractive index profile of (a.ii) type I waveguide exhibiting one single positive ∆n peak. Inset: side view of the type I waveguide under white light illumination. (b.ii) Type A waveguide exhibiting two positive ∆n peaks. DLW conditions for type I: (Ep=0.65µJ - v=5mm/s – 𝜏𝑟𝑒𝑝=250 kHz - NA=0.55 – 160µm
below the surface), type A (Ep=43nJ- v=60µm/s – 𝜏𝑟𝑒𝑝=9.8MHz - NA=0.75 -
160µm below the surface). ... 136
Figure III.8: Near-field mode profile following the injection of a 630nm laser for (a.i) Type I waveguide (b.i) Type A waveguide. Normalized horizontal intensity of (a.ii) type I waveguide (b.ii) type A waveguide. Normalized vertical intensity of (a.iii) type I waveguide (b.iii) type A waveguide. DLW conditions for type I: (Ep=0.65µJ - v=5mm/s – 𝜏𝑟𝑒𝑝=250 kHz - NA=0.55 – 160µm below the surface),
Type A (Ep=43nJ- v=60µm/s – 𝜏𝑟𝑒𝑝=9.8MHz - NA=0.75 - 160µm below the
surface). ... 138
Figure III.9: Optical path difference (OPD) profiles as a function of (a) laser irradiance (b) writing speed. The type A ∆n is always positive no matter what the laser conditions are. Pulse energies: 30 nJ → 50 nJ. ... 139
Figure III.10: Side view of a type I waveguide exhibiting negative ∆n (a) under white light illumination; (b) fluorescence image under blue excitation and emission in the visible range; (c) guided mode profile following laser injection at 630 nm. The dashed lines indicates the location of the waveguide. A small portion of light is guided on the side of the waveguide. (d) Refractive index change profile of the waveguide exhibiting a negative one. DLW parameters: 0.65µJ-25mm/s. ... 141
Figure III.11: Laser parameters for both lasers: (orange) T-pulse 200 which induces type A modification (blue) Ti:Sapphire which induces type I modification (a) laser fluence, (b) laser irradiance, (c) calculated laser dose deposited as a function of the writing speed. ... 143
Figure III.12: Different types of modification classifications as a function of a progressive scale of the laser fluence. The introduction of the new type A modification sits below the standard well known type I modification. ... 144
Figure IV.1: Simulations of the confinement factor as a function of the V parameter of the fiber for an LP01 mode. The confinement of the mode increases as
xxxviii
Figure IV.2: Schematic presentation of an evanescent wave based sensor. ... 154
Figure IV.3: Schematic presentation of the sensor. Taken from [182]. ... 155
Figure IV.4: Variation of the optical transmission for different refractive index liquids for taper thickness of (1) ~1.6 µm (2) ~700 nm. Taken from [182]. ... 156
Figure IV.5: (a) Transverse cut of the plastic fiber. (b) Top view of the polished section. (c) Side view of the polished section. Due to the mismatch between the refractive index liquids and the fiber core, part of the beam is lost (2) by refraction in the sensing zone (3) guided by internal reflection. Taken from [183]. ... 156
Figure IV.6: Experimental and theoretical normalized transmission output as a function of the refractive index liquids. Taken from [183]. ... 159
Figure IV.7: Schematic presentation of the refractive index (RI) sensor. Inset: Sketch of the optical rays in the sensing region. The refracted light represented in a dashed line only occurs when the RI of the liquid is higher than the RI of the cladding. Taken from [169]. ... 161
Figure IV.8: Experimental and simulated normalized transmitted powers as a function of the refractive index of the liquids. The previous model of Bilro et al [183] is represented with a dashed line. Inset: Comparison between Lapointe’s model [169] and Bilro’s model [183]. Taken from [169]. ... 163
Figure IV.9: Side view of (a) (b) the near-surface waveguides written in soda lime glass. (d) Gorilla glass. (c) 25µm below the surface. Near field mode profiles of the waveguides in Gorilla glass. (e)(f) 25µm below the surface. (g)(h) Near-surface waveguide. Taken from [71] ... 164
Figure IV.10: Side view of the near surface waveguides using the compensation method compared to waveguides written ~150 µm below the surface without the glass cover in (a) fused silica (b) Eagle. Taken from [91]. ... 165
xl
Figure IV.11: (a) Side view of near-surface waveguide using the compensation method and the guided mode profile following laser injection at =488 nm. (b) Fluorescence emission of an aqueous fluorescein solution excited by the evanescent wave of the light guided (=488 nm) in the near-near-surface waveguide observed through a band pass filter 528/38 (top view) (c) Dark field image of a linear periodic assembly of AG@SiO2@FITC nanowires (top view) (d) Fluorescence
emission of AG@SiO2@FITC nanowires (top view). Taken from [197]. ... 166
Figure IV.12: Sketch of the rising near-surface waveguide. ... 168
Figure IV.13: Side view under white light illumination of (a) 32 µm straight waveguide (b)(c)(d) rising near-surface waveguides. (e) Top view under white light illumination of a portion of a near-surface waveguide. Smooth modifications where no ablations or mini explosions were observed. DLW parameters: 28 nJ – 50 µm/s. ... 169
Figure IV.14: (a) Side view of the rising near-surface waveguide NWG1 under while light illumination. (b) Near-field mode profile following the injection of a 660 nm laser. (c) Sketch of the simulation of the waveguide where ~1 µm of the waveguide is simulated outside the glass. (d) Simulated mode profile based on the simulations shown in (c). A good match between experimental and simulated modes showing that the mode is confined more towards the glass due to the glass-air interface. 170
Figure IV.15: (a) Side view of a rising near-surface waveguide under white light illumination. (b) Near-field mode profile following the injection of a 660 nm laser. (c) Sketch of the simulation of the waveguide 2 µm away from the surface. (d) Simulated mode profile based on the simulations shown in (c). A good match between experimental and simulated modes showing that the mode is not affected. ... 172
Figure IV.16: (a) Top view phase image of a portion of a waveguide neighboring the surface waveguides exhibiting smooth type A modification. (b) ∆n profile extracted from the phase image showing two positive peaks of ~2.4 x 10⁻³. DLW
parameters: 28 nJ – 50 µm/s. ... 173
Figure IV.17: Normalized transmission for all written waveguides following the deposition of a ~4 mm droplet of 1.604 Cargile oil. No interaction was observed after 7 µm spacing between the waveguide and the surface. Inset: Near-field mode profile of the most sensitive waveguide at ~2 µm below the surface. DLW parameters: 28 nJ – 50 µm/s. ... 175
xlii
Figure IV.18: Normalized transmission as a function of the size of the droplet of a 1.604 Cargille oil for two waveguides with different distances from the glass surface. The larger the droplet the higher the losses in transmission. ... 176
Figure IV.19: Normalized transmission as a function of different refractive index (RI) Cargille oils deposited on the glass surface for four different waveguides at different depths from the surface. DLW parameters: 28 nJ – 50 µm/s. ... 178
Figure IV.20: Experimental (full line) and simulations (dashed lines) for two different near surface waveguides at different distances from the surface. A good match between the experiment and the simulations. ... 180
Figure IV.21: Sketch of the evanescent wave/mode profile inside a near-surface waveguide for a refractive index (RI). (a) Lower than the cladding/glass; (b) higher than the cladding/glass; (c) equal to the cladding/glass. Inspired from [200]. Simulated mode profile for a (a.i) glass-air interface; (c.ii) glass-oil interface with a refractive index of oil matching the glass 𝑛𝑒𝑥𝑡~𝑛𝑔𝑙𝑎𝑠𝑠. ... 181
xliv
List of Abbreviations
DLW Direct Laser Writing
CELIA CEntre des Lasers Intenses et ses Applications
ICMCB Institut de chimie de la matière condensée à Bordeaux COPL Centre d’optique, photonique et laser
SLAM Short Laser Pulses: Applications & Materials
NPs Nanoparticles
DSC Differential Scanning Calorimetry
IR InfraRed
TIR Total Internal Reflection
VIs Visible
UV Ultra-Violet
NIR Near InfraRed
MPI Multi Photon Ionization
NA Numerical Aperture
3D Three Dimensions
2D Two Dimensions
∆n Refractive Index Change
SLM Spatial Light Modulator
DWC Depressed Waveguide Cladding
WG Waveguide
WBG Waveguide Bragg Grating
PbP Point by Point WGL Waveguide Laser DFB Distributed Feedback PL Photonic Lantern MM Multimode SM Single Mode
AOM Acousto-Optic Modulator OPD Optical Path Difference
QWLSI Quadri-Wave Lateral Shearing Interferometry DHM Digital Holographic Microscopy
TIE Transport Of Intensity
HRSEM High Resolution Scanning Electron Microscopy AFM Atomic Force Microscopy
FWHM Full Width Half Maximum
EFISHG Electric Field Induced Second Harmonic Generation
LPG Long Period Grating
FBG Fiber Bragg Grating
RI Refractive Index
xlvi
xlviii
Acknowledgment
This PhD has been completed between two labs in two different countries, France and Canada. These labs collaborating together under the umbrella of the Laboratoire International Associé (LIA) LUMAQ (Lumière Matiere Aquitaine Quebec). I would like to thank the directors of LUMAQ Thierry Cardinal and Younès Messaddeq as well as of the Centre des Lasers Intenses et ses Applications (CELIA), Philippe Balcou and Eric Mevel and the director of the Centre d’Optique, Photonique et Laser, Réal Vallée for accepting me as a member of their great labs.
I would like to thank also, Dr. Bertrand Poumellec, Dr. Shane Eaton, Prof Younès Messaddeq and Dr. Mathieu Bellec for accepting to take part in my PhD jury. It was an honor for me.
To my PhD supervisors, Prof. Lionel Canioni, Prof. Réal Vallée and Dr. Yannick Petit, special thanks for choosing me for this PhD. Thank you for your support, understanding and help during the most difficult time of the PhD. Prof. Lionel Canioni, you were a real mentor during my PhD and also my personal life. I really appreciated all the discussions we had, related or not related to the PhD project. Thank you for the huge amount of trust you put in me. I also enjoyed travelling to several conferences with you. I am grateful for your contribution in teaching me new things and introducing me to the scientific community. Prof. Réal Vallée, I have always admired your way of engaging me in lab meetings so I could give more, work more and get better results. Yes, you are a picky person in science but I love that because I think it is a good quality for a scientist and it made me a better scientist. It was a pleasure to work for you, in your lab. Dr. Yannick Petit thank you for your friendly reception and the friendly environment you created during the course of the PhD. Thank you for following all of my work and for your constructive, critical remarks and observations. I learned a lot from you.
I also wish to thank all my colleagues in the SLAM group and COPL. Thank you all for your help and the good times we spent together. Being a part of the SLAM group is like being a part of a family and I really liked this atmosphere. Thank you to the SLAM (ex) colleagues/friends, EungJang Lee, Marie Vangheluwe, Brice Mutelet, Allu Amarnath Reddy, Arthur Le Camus, Sophie Rouzet, Délphine Syvilay, Wendwesen Gebremichael (Wendey), Laura Loi, Inka Mannek-Honninger and Bruno Bousquet. Thank you all for the great atmosphere we had in the lab and outside the
lab. Also thank you to Arnaud Royon for the interesting discussions about the PhD project. Thank you to my colleagues at ICMCB: Jean-Charles Desmoulin, Alexander Fargues, Sylvain Danto, Téa Skopak and Thierry Cardinal. Thank you to Jean-Charles Desmoulin and Sylvain Danto for providing glass samples, otherwise my project would not have been possible. Thank you for enduring my special demands! Téa Skopak, thank you for the discussions we had and for the time we spent talking. Special thanks and appreciation to Thierry Cardinal for all the financial support for my travels to Canada. Thanks also to my (ex) colleagues in COPL for the warm welcome and friendly environment: Mathieu Boivin, Cheikou Ba, Souleymane Toubou Bah, Fréderic Jobin, Frédéric Maes, JC Gauthier, Laurent Dusablon, Simon Duval, Yigit Ozan Aydin, Clément Frayssinous and Feng Liang. Thank you to Denis Boudreau, Alex Grégoire, Victor Azzi for the help and letting me use their equipment. Thank you also to Yannick Ledemi and Sandra Messadeq for the help. I would like to thank also Tigran Galstian for accepting me to assist him in his lab course. It gave me a great experience. Special thanks to Marc D’Auteuil, Stéphane Gagnon, David Hélie, Martin Blouin, Vincent Fortin and Diane Déziel. Marc, thank you for all you help in mounting my setups and finding the tools. I really appreciated the volleyball discussions we used to have. Stéphane, Stéphane... I asked you a lot of difficult and tricky tasks to do with my glasses during my PhD so thank you a lot for your help. Without your help and skills, it would have been nearly impossible for me to do it by my own. David and Diane, thank you a lot for the help provided for me before my arrival and to facilitate my arrival. Moreover, your friendly welcome is amazing and really appreciated. David thank you for the Québecois cultural introduction during the sugar shack. Martin Bernier, thank you for the warm welcome and the reputation you gave me at COPL (don’t ask about it). It was really a pleasure to get to know you in Rochester and dance, to interact with you in and outside the lab (on my farewell party). Thank you! Julien, it was a pleasure playing volleyball with you, I really enjoyed it. Now the two brothers I had at COPL, JP Bérubé and Jérôme Lapointe. Guys!!! It was really a pleasure to work with you and go out together for beer and pool. Jay (Jérôme), I will miss having a beer with you buddy, working late together at night and our paths crossing late in the lab. JP, thank you for answering all my emails almost every day for almost 2 years, following my daily work, giving advice and helping me with my work. Thank you for enduring my persisting character and correcting my papers/abstracts. I hope you are not bored now that I am not around anymore.
l
Also thank you to Céline, Sophie, Sonia, Cinthia, Michelle, Caroline and Carole from both universities for all the administrative help that you provided.
Of course, I would like to thank my funding sponsors, the French National Research Agency (ANR), “Investments for the Future” Idex program for the mobility grant, LAPHIA for funding the contract extension. From the Canadian side, I would like to thank the Natural Sciences and Engineering Research Council of Canada (NSERC) (CG101779), Canada Foundation for Innovation (CFI) (GF072345), and Fonds de Recherche du Québec-Nature et Technologies (FQRNT) (FT097991, CO201310) for their funding and for the equipment bought and used during this project.
On a personal note, I would like to dedicate this PhD to my parents. I would like to thank my friends from France and Canada who supported and helped me during this PhD: Christelle, Georges, Jean-Baptiste, Clément, Linh, Diaa. To the close friends, Vittorio, Jack and Georges thank you. Vittorio, I will miss our trips together man. Arthur Bagramyan: Thank you for having me as your friend and being like family in Québec. We had awesome memories together. And Joyce, it was a pleasure meeting you from the first day I arrived to the lab and I am lucky to have you as a friend. That’s enough for you. A person who stood by me, he calls himself “the sun”, thank you very much. You helped a lot. I appreciate it.
1
General Introduction
Laser-matter interaction has challenged the scientific communities since the discovery of the laser in the 1960s. Research and development through the past years led to almost a limitless number of industrial and medical laser-based applications. Ranging from laser cleaning, cutting, welding, marking to laser-eye surgery, ablating cancer tumours, medical imaging, the laser provides a versatile and non-replaceable tool in both the industrial and medical fields. More specifically, laser-glass interaction has been extensively studied during the last two decades. The process of focusing femtosecond lasers inside glasses in order to change the physical-chemical properties of the glass is called Direct Laser Writing (DLW). DLW technique provides fast direct three-dimensional (3D) structuration of the glass allowing the creation of 3D optical components embedded inside transparent materials. It exhibits many advantages compared to the lithography technique which is limited to the two-dimensional (2D) structuring of materials and involve many steps, making DLW highly compatible with industrial manufacturing. Many applications could be based on the DLW technique such as the creation of miniaturized sensors and/or photonic components on glass chips. Indeed, for example, the DLW technique in glasses has led to the creation of Modular Photonics a company based in Australia selling glass based micro-chips processed by the DLW technique used for mode-selective applications, more specifically for astronomical needs.
This PhD was performed in a joint collaboration between University of Bordeaux, France and Université Laval in Québec, Canada in the framework of the Laboratoire International Associé (LIA) LUMAQ (Lumière Matière Aquitaine Québec). More specifically, it was carried out between three labs: Centre des Lasers Intenses et ses Applications (CELIA) and Institute of Chemistry of the Condensed Matter of Bordeaux (ICMCB) at University of Bordeaux, France and Centre d’Optique, Photonique et Laser (COPL) at Université Laval, Québec, Canada. It consisted in spending almost half the time of the PhD at each university while working on the same project which is a continuity of research activities conducted in the “Shortpulse Lasers: Applications and Materials” (SLAM) research group of my supervisor Lionel Canioni and the group “Chimie et photonique des matériaux oxide de fluores”, supervised by Thierry Cardinal at ICMCB. Previous work was based on optimizing and mastering the silver containing zinc phosphate glasses synthesis, investigating and understanding the exotic laser-glass process following DLW. Those activities led to the creation of “Argolight”, a spin-off company selling laser

![Figure I.20: Modification threshold dependence as a function of the numerical aperture of the microscope objective used in borosilicate glass [54].](https://thumb-eu.123doks.com/thumbv2/123doknet/14494354.718098/88.892.154.719.114.556/modification-threshold-dependence-function-numerical-microscope-objective-borosilicate.webp)
